. 2016 Sep 8;12(9):e1005847.
doi: 10.1371/journal.ppat.1005847. eCollection 2016 Sep.

Rice Dwarf Virus P2 Protein Hijacks Auxin Signaling by Directly Targeting the Rice OsIAA10 Protein, Enhancing Viral Infection and Disease Development

Affiliations

Rice Dwarf Virus P2 Protein Hijacks Auxin Signaling by Directly Targeting the Rice OsIAA10 Protein, Enhancing Viral Infection and Disease Development

Lian Jin et al. PLoS Pathog. .

Abstract

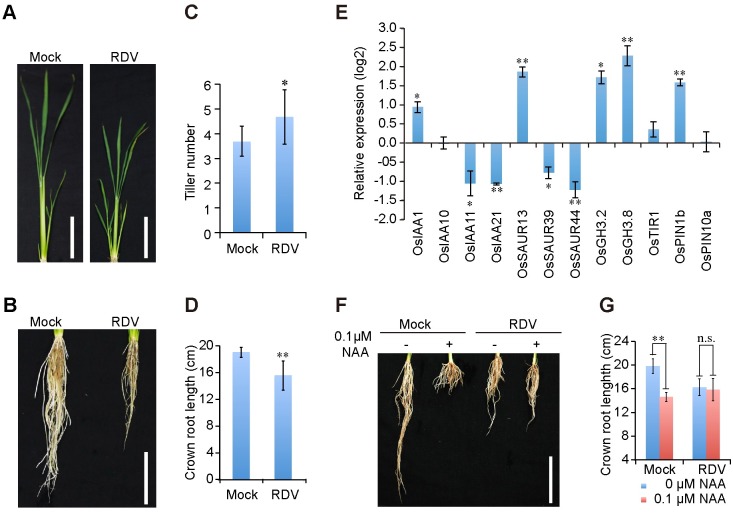
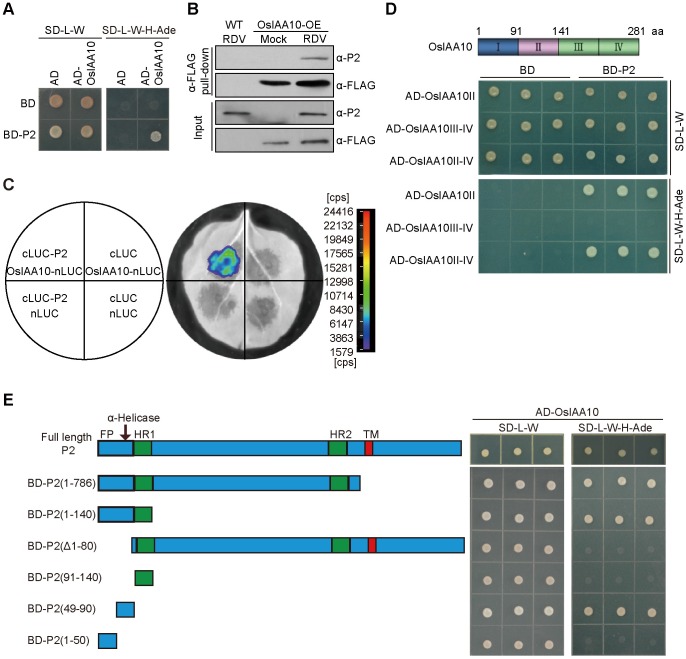
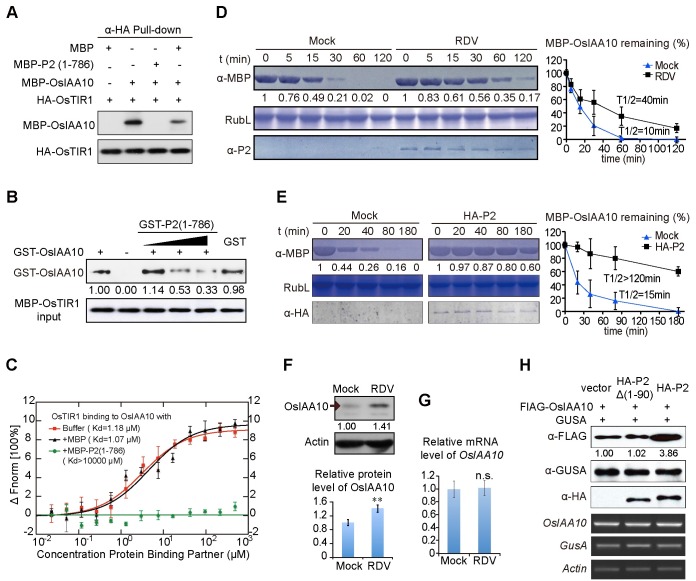
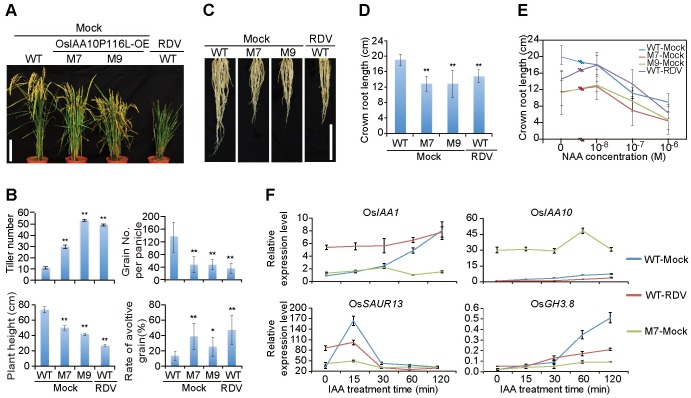
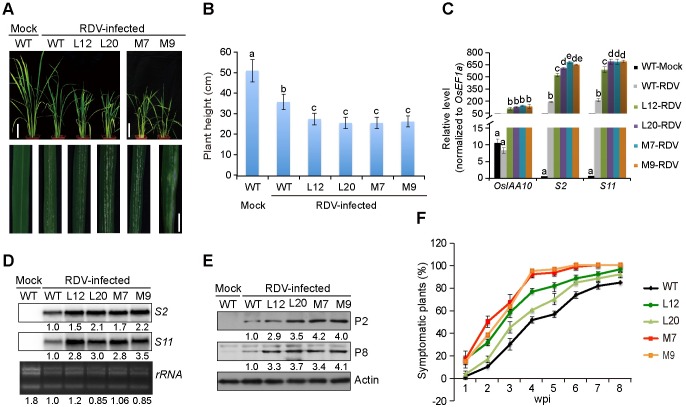
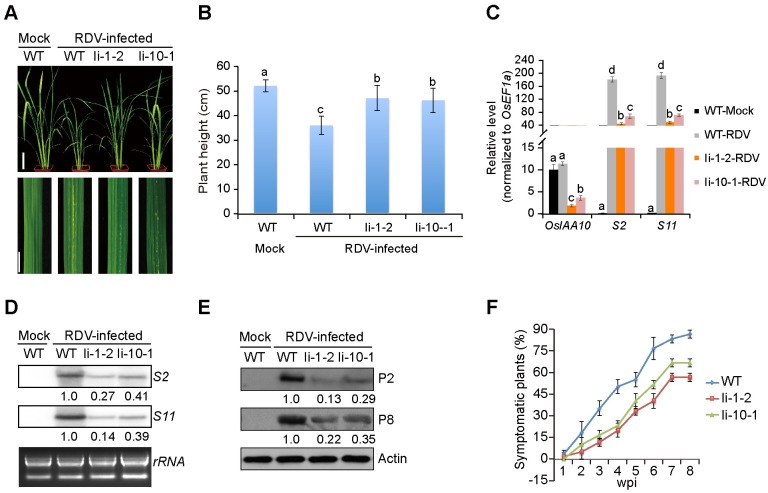
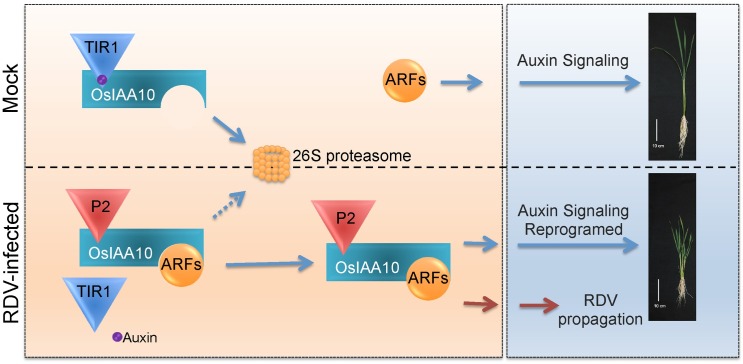
The phytohormone auxin plays critical roles in regulating myriads of plant growth and developmental processes. Microbe infection can disturb auxin signaling resulting in defects in these processes, but the underlying mechanisms are poorly understood. Auxin signaling begins with perception of auxin by a transient co-receptor complex consisting of an F-box transport inhibitor response 1/auxin signaling F-box (TIR1/AFB) protein and an auxin/indole-3-acetic acid (Aux/IAA) protein. Auxin binding to the co-receptor triggers ubiquitination and 26S proteasome degradation of the Aux/IAA proteins, leading to subsequent events, including expression of auxin-responsive genes. Here we report that Rice dwarf virus (RDV), a devastating pathogen of rice, causes disease symptoms including dwarfing, increased tiller number and short crown roots in infected rice as a result of reduced sensitivity to auxin signaling. The RDV capsid protein P2 binds OsIAA10, blocking the interaction between OsIAA10 and OsTIR1 and inhibiting 26S proteasome-mediated OsIAA10 degradation. Transgenic rice plants overexpressing wild-type or a dominant-negative (degradation-resistant) mutant of OsIAA10 phenocopy RDV symptoms are more susceptible to RDV infection; however, knockdown of OsIAA10 enhances the resistance of rice to RDV infection. Our findings reveal a previously unknown mechanism of viral protein reprogramming of a key step in auxin signaling initiation that enhances viral infection and pathogenesis.


Conflict of interest statement

The authors have declared that no competing interests exist.

Figures

Fig 1
Fig 1. RDV infection disturbs auxin pathway in rice.
(A and B) Aboveground (A) and root (B) phenotypes of mock- and RDV- infected rice plants at 6-week-old seedling stage. Bars: 10 cm. (C and D) Schematic representation of the tiller number and crown roots length of mock- and RDV- infected rice plants in (A) and (B). The average (± standard deviation (SD)) values were obtained from three biological repeats, with 15 plants from each line in every repeat. Significant differences were indicated (*P<0.05, **P<0.01) based on Student’s t-test. (E) Relative average expression (log2) of auxin-induced genes in RDV-infected rice plants. Data were obtained from qPCR assays and analyzed using 2-ΔΔC(t) method and the OsEF1a mRNA levels were used as internal controls. Values are mean ± SD (n = 3 biological replicates). Columns with asterisks are statistically different according to Student’s t-test (*P<0.05, **P<0.01) as compared to their expression in mock-inoculated rice plants. (F and G) RDV-infected rice plants exhibit reduced sensitivity to auxin treatment. Phenotypes (F) and lengths (G) of crown roots of mock- and RDV- infected 4-week-old seedlings cultured in liquid nutrition containing 0 or 0.1 μM NAA for 10 days. Bar: 10 cm. The average (± SD) values were from three biological repeats with 15 plants for each line every repeat. Significant differences were indicated (n.s., no significant, **P<0.01) based on Student’s t-test.
Fig 2
Fig 2. The RDV P2 protein interacts with OsIAA10.
(A) RDV P2 interacts with OsIAA10 in yeast. Yeast transformants were spotted on the control medium (SD-Leu/-Trp (SD-L-W)) and selection medium (SD-Leu/-Trp/-His/-Ade (SD-L-W-H-Ade)). AD, activating domain; BD, binding domain; SD, synthetic dropout. (B) Co-immunoprecipitation confirms the interaction between P2 and OsIAA10 in RDV-infected FLAG-OsIAA10 overexpressing (OsIAA10-OE) rice. WT, wild type rice; Mock, mock-inoculated rice; RDV, RDV-infected rice. (C) LCI assay shows interaction between P2 and OsIAA10 in vivo. The left diagram indicates the leaf panels that were infiltrated with A. tumefaciens containing the different combinations of indicated constructs. Cps indicates signal counts per second. (D) P2 interacts with domain II of OsIAA10. (E) Determination of the functional domains of P2 that interact with OsIAA10. The prey protein AD-OsIAA10 was expressed with the indicated bait proteins in yeast AH109 cells. Interaction was indicated by the ability of cells to grow on medium SD-L-W-H-Ade.
Fig 3
Fig 3. The RDV P2 protein stabilizes OsIAA10 by inhibiting OsIAA10/OsTIR1 interaction.
(A) Interaction between MBP-OsIAA10 and HA-OsTIR1 is disrupted by MBP-P2 (1–786). MBP-OsIAA10 protein combined with MBP-P2(1–786) or MBP was incubated with immobilized HA-OsTIR1. The immunoprecipitated fractions were detected by anti-MBP antibody. HA-OsTIR1 input is shown in the lower panel. (B) In vitro interaction between GST-OsIAA10 and MBP-OsTIR1 is weakened by GST-P2 (1–786) in a dose dependent manner, revealed by pull-down. GST-OsIAA10 protein combined with GST-P2(1–786) or GST was incubated with immobilized MBP-OsTIR1. The immunoprecipitated fractions were detected by anti-GST antibody. The gradient indicates increasing amount of GST-P2(1–786). MBP-OsTIR1 input is shown in the lower panel. (C) P2 affects dynamic association between OsTIR1 and OsIAA10. Data were collected from microscale thermophoresis (MST) assays as described in Materials and Methods. Experiments repeat for three times and Error bars indicate SD. Fnorm, normalized fluorescence. (D and E) Cell-free degradation assay of MBP-OsIAA10 in mock- or RDV- infected rice extracts (D) or N. benthamiana leaf extracts (E). Mock in (D) indicates healthy rice extracts; Mock in (E), extracts of leaves infiltrated with pWM101 vector as a negative control; HA-P2, extracts of leaves infiltrated with pWM101-HAS2 that express HA-P2. Rubisco large protein (RuL) was used as a loading control of total plant protein. On the right was a normalized plot for the degradation of MBP-OsIAA10 of the left. The details for quantification and normalization are described in Materials and Methods. Error bars indicate SD. (F) Western blot showing OsIAA10 protein levels in mock and RDV-infected WT rice plants. Actin was used as a loading control. And the Histogram underneath represents the relative protein level. Experiments repeat for three times and Error bars indicate SD. Significant differences were indicated (**P<0.01) based on Student’s t-test. (G) qPCR showing OsIAA10 transcript levels, respectively, in mock and RDV-infected WT rice plants. OsEF1a was used as the reference. Values are mean ± SD (n = 3 biological replicates). n.s. indicates no significant difference based on Student’s t-test. (H) Effects of P2 and P2Δ(1–90) on the accumulation of OsIAA10 in N. benthamiana after auxin treatment. The three upper panels show protein levels on Western blots and the three lower panels show mRNA levels revealed by RT-PCR. GusA was expressed and loaded as a reference control.
Fig 4
Fig 4. OsIAA10P116L-overexpressing transgenic rice plants phenocopy RDV-infected rice plants.
(A) Morphologies of mock-inoculated M7 and M9 as well as WT-RDV plants at maturity stage. Bar: 15 cm. (B) Schematic representation of the tiller number, plant height, grain number per panicle, and rate of avoltive grain (%) for the above plants at maturity stage. The average (±SD) values were obtained from three biological repeats, with 15 plants from each line in every repeat. Significant differences were indicated (*P<0.05, **P<0.01) based on Student’s t-test. (C and D) Phenotypes (C) and schematic representation (D) of the length of the crown roots of 6-week-old mock-inoculated WT and OsIAA10P116L-overexpressing (M7 and M9), as well as RDV-infected WT, rice plants. Bar: 10 cm. The average (±SD) values were obtained from three biological repeats, with 15 plants from each line in every repeat. Significant differences were indicated (**P<0.01) based on Student’s t-test. (E) Lengths of crown roots of 6-week-old mock-inoculated WT, M7 and M9 as well as RDV-infected WT rice seedlings cultured in a liquid nutrient containing the indicated concentration of NAA. The average (±SD) values were obtained from three biological repeats, with 15 plants from each line in every repeat. (F) qPCR analysis of auxin-induced gene expression after IAA treatment in mock-inoculated WT and M7 as well as RDV-infected WT rice seedlings. The expression levels were normalized using the signal from OsEF1a, and values are mean ± SD (n = 3 biological replicates).
Fig 5
Fig 5. OsIAA10 accumulation enhances RDV pathogenicity.
(A) Phenotypes of RDV-infected WT, L12, L20, M7, and M9 rice plants. Photos were taken 4 weeks after RDV inoculation. The areas of white specks on the leaves represent the degree of disease symptoms. Scale bars: 10 cm (upper panel) and 1 cm (lower panel). (B) Schematic representation of plant height for the plants in (A). The average (±SD) values were obtained from three biological repeats, with 15 plants from each line in every repeat. Different letters indicate significant differences (p < 0.05) based on the Tukey-Kramer HSD test. (C) qRT-PCR assay showing the relative expression level of OsIAA10 and RDV RNAs (S2 and S11) in plants in (A). The expression levels were normalized using the signal from OsEF1a, and values are mean ± SD (n = 3 biological replicates). Different letters indicate significant differences (p < 0.05) based on the Tukey-Kramer HSD test. (D and E) Northern (D) and Western (E) blots showing the accumulation of RDV RNAs and proteins in RDV-infected WT, L12, L20, M7 and M9 rice lines. rRNAs were used as a loading control for RNA and Actin was used as a loading control for proteins. (F) Time course of symptomatic plants (%) of WT, L12, L20, M7 and M9 from one week-post-inoculation (wpi) to 8 wpi. Inoculation assays were repeated three times, respectively. The error bars indicate SD. L12 and L20 are transgenic rice lines overexpressing OsIAA10; M7 and M9 are transgenic rice lines overexpressing OsIAA10P116L.
Fig 6
Fig 6. Reduced expression of OsIAA10 inhibits RDV infection and replication.
(A) Phenotypes of RDV-infected WT, Ii-1-2, and Ii-10-1 rice plants. Photos were taken 4 weeks after RDV-inoculation. The areas of white specks on the leaves represent the degree of disease symptoms. Scale bars: 10 cm (upper panel) and 1 cm (lower panel). (B) Schematic representation of plant height for the plants in (A). The average (±SD) values were obtained from three biological repeats, with 15 plants from each line in every repeat. Different letters indicate significant differences (p < 0.05) based on the Tukey-Kramer HSD test. (C) qRT-PCR assay showing the relative expression level of OsIAA10 and RDV RNAs (S2 and S11) in plants in (A). The expression levels were normalized using the signal from OsEF1a, and values are mean ± SD (n = 3 biological replicates). Different letters indicate significant differences (p < 0.05) based on the Tukey-Kramer HSD test. (D and E) Northern (D) and Western (E) blotting showing the accumulation of RDV RNAs and proteins in the corresponding rice lines in A. rRNAs were used as a loading control for RNA and Actin was used as a loading control for proteins. (F) Time course of RDV symptomatic plants (%) in WT, Ii-1-2 and Ii-10-1 rice lines from one week-post-inoculation (wpi) to 8 wpi. Inoculation assays were repeated three times, respectively. The error bars indicate SD. Ii-1-2 and Ii-10-1 are OsIAA10RNAi transgenic rice lines.
Fig 7
Fig 7. Proposed model.
In mock rice plants, high auxin concentration promotes the interaction between OsIAA10 and OsTIR1, leading to the ubiquitination and 26S proteasome degradation of OsIAA10, releasing the specific OsARFs. Then genes of auxin signaling pathway were adequately regulated by corresponding ARF transcription factors, promoting normal rice growth. Under RDV infection condition, P2 binds to the domain II of OsIAA10, blocking its association with OsTIR1 for degradation. The stabilized OsIAA10 binds to corresponding OsARFs, manipulating down-stream gene expression in the auxin signaling pathway. Reprogramed auxin signaling causes stunting, more tillering, shorter crown roots to the rice plants and promotes RDV propagation in rice.

Similar articles

Cited by

References

    1. Soosaar JLM, Burch-Smith TM, Dinesh-Kumar SP (2005) Mechanisms of plant resistance to viruses. Nat Rev Microbiol 3: 789–798. - PubMed
    1. Wang A (2014) Dissecting the molecular network of virus-plant interactions: the complex roles of host factors. Annu Rev Phytopathol 53: 1–22. - PubMed
    1. Bari R, Jones JDG (2009) Role of plant hormones in plant defence responses. Plant Mol Biol 69: 473–488. 10.1007/s11103-008-9435-0 - DOI - PubMed
    1. Jameson PE, Clarke SF (2002) Hormone-virus interactions in plants. CRC Crit Rev Plant Sci 21: 205–228.
    1. Dangl JL, Horvath DM, Staskawicz BJ (2013) Pivoting the plant immune system from dissection to deployment. Science 341: 746–751. 10.1126/science.1236011 - DOI - PMC - PubMed

Publication types

LinkOut - more resources