. 2017 Jun;232(6):1275-1286.
doi: 10.1002/jcp.25586. Epub 2016 Dec 19.

Acute Ethanol Increases IGF-I-Induced Phosphorylation of ERKs by Enhancing Recruitment of p52-Shc to the Grb2/Shc Complex

Affiliations

Acute Ethanol Increases IGF-I-Induced Phosphorylation of ERKs by Enhancing Recruitment of p52-Shc to the Grb2/Shc Complex

Matthew Dean et al. J Cell Physiol. 2017 Jun.

Abstract

Ethanol plays a detrimental role in the development of the brain. Multiple studies have shown that ethanol inhibits insulin-like growth factor I receptor (IGF-IR) function. Because the IGF-IR contributes to brain development by supporting neural growth, survival, and differentiation, we sought to determine the molecular mechanism(s) involved in ethanol's effects on this membrane-associated tyrosine kinase. Using multiple neuronal cell types, we performed Western blot, immunoprecipitation, and GST-pulldowns following acute (1-24 h) or chronic (3 weeks) treatment with ethanol. Surprisingly, exposure of multiple neuronal cell types to acute (up to 24 h) ethanol (50 mM) enhanced IGF-I-induced phosphorylation of extracellular regulated kinases (ERKs), without affecting IGF-IR tyrosine phosphorylation itself, or Akt phosphorylation. This acute increase in ERKs phosphorylation was followed by the expected inhibition of the IGF-IR signaling following 3-week ethanol exposure. We then expressed a GFP-tagged IGF-IR construct in PC12 cells and used them to perform fluorescence recovery after photobleaching (FRAP) analysis. Using these fluorescently labeled cells, we determined that 50 mM ethanol decreased the half-time of the IGF-IR-associated FRAP, which implied that cell membrane-associated signaling events could be affected. Indeed, co-immunoprecipitation and GST-pulldown studies demonstrated that the acute ethanol exposure increased the recruitment of p52-Shc to the Grb2-Shc complex, which is known to engage the Ras-Raf-ERKs pathway following IGF-1 stimulation. These experiments indicate that even a short and low-dose exposure to ethanol may dysregulate function of the receptor, which plays a critical role in brain development. J. Cell. Physiol. 232: 1275-1286, 2017. © 2016 Wiley Periodicals, Inc.


Conflict of interest statement

None of the authors of this work have any conflicts of interest to disclose.

Figures

Figure 1
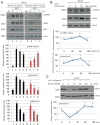
Figure 1. Effects of acute ethanol exposure on IGF-1-induced signaling responses in PC12 neuron-like cells in vitro
Western blot analysis showing levels of phosphorylated (activated) forms of IRS-1, ERKs, and Akt. During 24 hours of serum starvation, PC12 cells were cultured in serum-free medium (SFM) in the presence or absence of 50mM ethanol (EtOH), which was applied for either 1 hour (Panel A) or 24 hours (Panel B). In both panels control cells were treated with an equal volume of vehicle (sterile H2O), indicated as “No EtOH”. Prior to IGF-1 stimulation, the medium containing EtOH was replaced with EtOH-free SFM and the cells were stimulated with IGF-1 (50 ng/mL) for 0.5, 3, or 6 hours. Loading conditions were tested by reprobing the same blot with anti-Erks and Grb-2 antibodies. Histograms below demonstrate densitometric evaluation of the obtained blots using ImageJ software. Data represent average values from 3 independent experiments with standard deviation (n=3). Densitometric values for each protein were normalized by the corresponding densitometric values of the loading marker, Grb-2, and are expressed as arbitrary densitometry units × 100. (*) indicates statistically significant differences (paired student t-test, P≤0.05) between controls (No EtOH) and matching ethanol treated samples (EtOH 50mM) at indicated time points following IGF-1 stimulation.
Figure 2
Figure 2. Time- and dose- dependent effects of ethanol exposure on IGF-IR signaling pathways
Panel A: PC12 cells were grown and passaged in the presence or absence of 50 mM ethanol (EtOH) for 3 weeks (21 days). On day 20, both EtOH-containing and EtOH-free cultures were serum-starved for 24 hours. Prior to IGF-1 stimulation, the medium containing EtOH was replaced with EtOH-free medium and the cells were stimulated with IGF-1 (50 ng/mL) for 0.5, 3, or 6 hours. Loading conditions were tested by reprobing the same blot with anti-Grb-2 antibody, as described in our previous studies. Panel B: PC12 cells were serum-starved for 24 hours and treated with increasing concentrations of EtOH (0, 25, 50, 200 mM) for 1 hour at the end of serum starvation. Panel C: PC12 cells were serum-starved for 24 hours and then incubated with 50mM EtOH for varying amounts of time (0, 5, 30, 60, 180 minutes) at the end of serum starvation. Data represent average values from 3 independent experiments with standard deviation (n=3). (*) indicates statistically significant differences (paired student T-test, P≤0.05) between controls (No EtOH) and matching ethanol treated samples (EtOH 50mM) at indicated time points. In Panels B and C (*) indicates statistically significant difference from 0 mM EtOH.
Figure 3
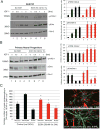
Figure 3
Effects of ethanol on IGF-1-induced IRS-1 and ERKs phosphorylation analyzed inhuman neuroblastoma cell line, SH-SY5Y (Panel A), and in three dimensionally-growing, primary, mouse neural progenitors (Panel B). Western blot analysis and ethanol treatment of SH-SY5Y were identical to the experimental protocol described in Figure 1A. For neural progenitors, however, the ethanol treatment was applied in medium containing growth factors and insulin, which are required to maintain their survival (see Materials and Methods). Data represent average values from 3 independent experiments with standard deviation (n=3). (*) indicates statistically significant differences (paired student T-test, P≤0.05) between controls (No EtOH) and matching ethanol treated samples (EtOH 50mM) at indicated time points. Panel C: Effects of acute (24 hour) ethanol exposure on the growth and differentiation of neural progenitors. In this experiment neurosphere cultures were exposed first to 50 mM ethanol for 24 hours, and then the neurospheres were re-plated to induce neural differentiation (see methods). The quantifications of the average number of voxels associated with neurons (βIII tubulin positive), astrocytes (GAFP positive) and nuclei (DAPI positive) were based on confocal images using SlideBook5 software as described in our previous studies (Gualco et al., 2010, Wilk et al., 2011). Data represent average values with standard deviation (n=3). * indicates values statistically different from the corresponding controls (no EtOH).
Figure 4
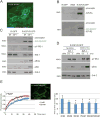
Figure 4. Effects of ethanol on IGF-IR mobility within the plasma membrane
Panel A: Fluorescent image of a positive clone of R- cells [(mouse fibroblasts with targeted disruption of IGF-IR gene (Ullrich et al., 1986)] expressing IGF-IR-GFP fusion protein. Panel B: Western blot analysis of total protein extracts from R-/IGF-IR/GFP cells depicted in Panel A. R- cells expressing GFP only (R-/GFP) and R508 cells, were used as negative and positive controls, respectively. The blots were probed with anti-IGF-IR antibodies recognizing either alpha (upper panel) or beta subunit (lower panel) of the IGF-IR. Note the significant difference in the mobility of the IGF-IRβ isolated from R-/IGF-IR-GFP cells in comparison to the IGF-IR beta subunit from R08 cells (lower panel). Panel C: IGF-1 stimulation of IGF-IR-GFP signaling in R-/GFP and R-/IGF-IR-GFP cells. Anti-Grb-2 antibody was used as a loading marker. In contrast to R-/GFP cells (negative control) R-/IGF-IR-GFP cells demonstrated IGF-I-induced phosphorylation of all tested signaling molecules. Panel D: Effects of ethanol on IGF-I-induced ERKs and IRS-I phosphorylation in PC12/IGF-IR-GFP cells. Panel E: Fluorescence recovery after photo bleaching (FRAP) of PC12 cells stably expressing the IGF-IR-GFP fusion protein (PC12/IGF-IR-GFP; inset). The graph at right is a representative plot of fluorescence intensity recorded during the recovery of fluorescence after photo bleaching of PC12/IGF-IR-GFP cells in the presence or absence of 50 mM ethanol, which was applied 1 hour before the measurement. The histogram demonstrates average values of the time to 50% recovery after photo bleaching for PC12/IGF-IR-GFP cells exposed to the indicated concentrations of EtOH. (*) indicate values which are statistically different (p≤0.05) from control (0 mM EtOH).
Figure 5
Figure 5. Effects of ethanol on IGF-1-induced activation of the IGF-IR
Panel A: Western blot analysis using PC12 cell protein lysates and an anti-pY1135/1136 IGF-IR antibody (Cell Signaling). Western blot and ethanol treatment conditions were identical to the experimental protocol described in Figure 1A. Panel B: Immunoprecipitation (IP) Western blot (W) analysis (IP/W) in which PC12 total protein lysates were extracted following 24h EtOH exposure (50mM) and IGF-1 stimulation. For Panels A and B, histograms below the corresponding blots show densitometric analysis using ImageJ software. The data represent average densitometric values from three blots (n=3), which were normalized either with the loading marker, Grb-2 (Panel A), or with immunoprecipitated IGF-IR (panel B), and are expressed as arbitrary densitometry units ×100. Panel C: Effects of acute EtOH exposure on IGF-IR content in membrane rafts. The procedure for cytosolic and membrane raft protein extraction is described in Material and Methods. Following 1 hour EtOH exposure and IGF-1 stimulation (50 ng/mL for 30 min), cytosolic and membrane raft fractions were isolated and used for Western blot analysis with anti-IGF-IRα, anti-Src (membrane raft marker), and with anti-GAPDH (cytosolic marker).
Figure 6
Figure 6. Effects of ethanol on the formation of Grb2-p52-Shc complex
Panel A: Immunoprecipitation of Grb2 followed by a Western blot using an α-(pan)Shc antibody (Millipore). PC12 cells were exposed to EtOH for 24h and then stimulated with IGF-I. Cells were then lysed and lysates were subjected to immunoprecipitation using α-Grb2 antibody. In the presence of EtOH, there was an increase in Grb2-p52-Shc complexes, the results of which are quantified and shown in (Panel B). Following production of GST-tagged Grb2, a GST-pulldown was performed (Panel C). As in the IP/Western blot there was an increase in the amount of Grb2 bound to p-52-Shc in the presence of EtOH. The results from this GST- pulldown are quantified in (Panel D). Data represent average values from 3 independent experiments with standard deviation (n=3). (*) indicates statistically significant differences (paired student T-test, P≤0.05) between controls (No EtOH) and matching ethanol treated samples (EtOH 50mM).

Similar articles

Cited by

References

    1. Aberg MA, Aberg ND, Palmer TD, Alborn AM, Carlsson-Skwirut C, Bang P, Rosengren LE, Olsson T, Gage FH, Eriksson PS. IGF-I has a direct proliferative effect in adult hippocampal progenitor cells. Mol Cell Neurosci. 2003a;24:23–40. - PubMed
    1. Aberg ND, Blomstrand F, Aberg MA, Bjorklund U, Carlsson B, Carlsson-Skwirut C, Bang P, Ronnback L, Eriksson PS. Insulin-like growth factor-I increases astrocyte intercellular gap junctional communication and connexin43 expression in vitro. J Neurosci Res. 2003b;74:12–22. - PubMed
    1. Arsenijevic Y, Weiss S. Insulin-like growth factor-I is a differentiation factor for postmitotic CNS stem cell-derived neuronal precursors: distinct actions from those of brain-derived neurotrophic factor. J Neurosci. 1998;18:2118–2128. - PMC - PubMed
    1. Arsenijevic Y, Weiss S, Schneider B, Aebischer P. Insulin-like growth factor-I is necessary for neural stem cell proliferation and demonstrates distinct actions of epidermal growth factor and fibroblast growth factor-2. J Neurosci. 2001;21:7194–7202. - PMC - PubMed
    1. Bache KG, Slagsvold T, Stenmark H. Defective downregulation of receptor tyrosine kinases in cancer. The EMBO journal. 2004;23:2707–2712. - PMC - PubMed

MeSH terms

Substances

LinkOut - more resources