. 2016 Sep 8;7(9):e2361.
doi: 10.1038/cddis.2016.264.

Atg5-dependent autophagy contributes to the development of acute myeloid leukemia in an MLL-AF9-driven mouse model

Affiliations

Atg5-dependent autophagy contributes to the development of acute myeloid leukemia in an MLL-AF9-driven mouse model

Qiang Liu et al. Cell Death Dis. .

Abstract

Acute myeloid leukemia (AML) is a hierarchical hematopoietic malignancy originating from leukemic stem cells (LSCs). Autophagy is a lysosomal degradation pathway that is hypothesized to be important for the maintenance of AML as well as contribute to chemotherapy response. Here we employ a mouse model of AML expressing the fusion oncogene MLL-AF9 and explore the effects of Atg5 deletion, a key autophagy protein, on the malignant transformation and progression of AML. Consistent with a transient decrease in colony-forming potential in vitro, the in vivo deletion of Atg5 in MLL-AF9-transduced bone marrow cells during primary transplantation prolonged the survival of recipient mice, suggesting that autophagy has a role in MLL-AF9-driven leukemia initiation. In contrast, deletion of Atg5 in malignant AML cells during secondary transplantation did not influence the survival or chemotherapeutic response of leukemic mice. Interestingly, autophagy was found to be involved in the survival of differentiated myeloid cells originating from MLL-AF9-driven LSCs. Taken together, our data suggest that Atg5-dependent autophagy may contribute to the development but not chemotherapy sensitivity of murine AML induced by MLL-AF9.


Figures

Figure 1
Figure 1
Verification of the dMLL-AF9 vector expressing luciferase and GFP-LC3. (a) C-kit+ BM cells or malignant leukemia cells driven by exogenous pMIG-MLL-AF9 were cultured in cytokine-supplemented medium and treated with vehicle or 100 nM BafA1 for 6 h and subjected to immunoblotting. Quantified LC3-II levels were normalized against β-actin and its respective vehicle-treated control. Western blotting is representative of two independent experiments. (b) Schematic representing the retroviral construct containing MLL-AF9, luciferase (Luc), and GFP-LC3 with their respective promoters. (c) The luminescence of PHOENIX/Eco cells 24 h after calcium transfection of the pMSCV-empty (Empty), pMSCV-Luc-IRES-YFP (Luc), or dMLL-AF9. Error bars represent S.D. of three replicates. (d) Green fluorescence of PHOENIX/Eco cells 24 h after calcium transfection with the indicated vectors was detected with the Olympus CKX41 microscope using the Olympus DP20 camera and the Olympus CellSens software (original magnification × 40). (e) Luminescence of non-transduced or dMLL-AF9-transduced c-kit+ BM cells (c-kit+ BM+dMLL-AF9) compared with MOLM13 cells stably expressing pMSCV-Luc-IRES-YFP (MOLM13+Luc). Error bars represent S.D. of three replicates. (f) Non-transduced or dMLL-AF9 transduced c-kit+ BM cells were seeded to methylcellulose for three passages at 5 days each and counted for the number of colonies. Error bars represent S.D. of three replicates. (g) One day after c-kit+ BM were transduced with dMLL-AF9, cells were seeded to methylcellulose medium containing 100 nM 4OHT for three rounds of serial replating. Black bars represent the mean±S.D. Statistics were calculated by ANOVA with multiple comparisons. **P<0.01. (h) Atg5FL c-kit+ BM were treated with 100 nM 4OHT for the indicated days, and control Atg5WT c-kit+ BM cells were treated with 100 nM 4OHT for 5 days. Genomic DNA was extracted and analyzed by PCR
Figure 2
Figure 2
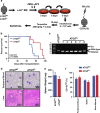
Development of AML in mice transplanted with ATG5WT and Atg5FL MLL-AF9-BM cells transduced with dMLL-AF9 and treated with tamoxifen. (a) A schematic representing the strategy by which the role of Atg5-dependent autophagy was assessed during primary transplantation in MLL-AF9-driven AML. (b) The Kaplan–Meier survival curve of mice transplanted with Atg5WT (n=8) and Atg5FL (n=7) MLL-AF9 cells. The P-value for the log-rank test between the two groups is shown. (c) Genomic DNA extracted from the splenocytes of a representative Atg5WT and six Atg5FL moribund mice from panel (b) were analyzed by PCR for the status of Atg5 alleles. (d) Representative figures of peripheral blood smears stained by May Grünwald–Giemsa (top) and liver section stained by hematoxylin and eosin (bottom) of moribund mice from panel (b). (e) The spleen weight of moribund mice from panel (b) for Atg5WT (n=7) and Atg5FL (n=6) mice. Error bars represent S.E.M. (f) The Annexin V7-AADCD11b+ myeloid cells are shown as percentage of all Annexin V7-AAD cells according to flow cytometry in the indicated hematopoietic tissues of moribund mice from panel (b). Error bars represent S.E.M. of six mice
Figure 3
Figure 3
Vehicle and tamoxifen treatment in mice transplanted with ATG5WT and Atg5FL BM cells transduced with dMLL-AF9. (a and b) Kaplan–Meier survival curve of mice transplanted with Atg5WT (a) or Atg5FL (b) cells treated with vehicle or tamoxifen (n=11 for each group). The P-values for the log-rank test between vehicle and tamoxifen treatment are shown. (c) Quantification of in vivo bioluminescent imaging of Atg5FL mice from panel (b) is represented by total flux. Error bars represent S.E.M. of nine mice. Statistics were calculated by analysis of variance (ANOVA) with multiple comparisons. **P<0.01. (d) Representative animals for in vivo bioluminescence of mice from panel (b). Images were normalized to the scale bar at bottom right. (e) Flow cytometric analysis of Annexin V7-AAD cells in the indicated hematopoietic tissues of moribund mice from panel (b), showing the following cell populations: c-kit+Sca-1CD16/32+CD34 LSCs, c-kit+Sca-1CD16/32CD34+ CMPs, c-kit+Sca-1CD16/32+CD34+ GMPs,c-kit+Sca-1CD16/32CD34 MEPs, Linc-kit+Sca-1+ LSKs, and Linc-kit+Sca-1+CD48CD150+ LT-HSCs. Error bars represent S.E.M. of eight mice. Statistics were calculated by ANOVA with multiple comparisons. **P<0.01. (f) Flow cytometric analysis of Annexin V7-AAD cells in the indicated hematopoietic tissues of moribund mice from panel (b) shows the populations of CD19+ B-cells, CD3+ T-cells, F4/80+ monocytes, and cells of the indicated phenotype. Statistics were calculated by ANOVA with multiple comparisons. NS, not statistically significant
Figure 4
Figure 4
Autophagy, proliferation, and apoptosis of in vitro cultured Atg5FL and Atg5KO cells. (a) Genomic DNA extracted from the splenocytes of five moribund mice in each group from Figure 3b were analyzed by PCR for the status of Atg5 alleles. DNA extracted from ears of mice with the genotype of Atg5WT/WT and Atg5FL/FL was used as controls. (b) Atg5FL and Atg5KO primary splenocytes from panel (a) were cultured in vitro and treated with 100 nM BafA1 for 2 h, followed by immunoblot analysis. (c) Atg5FL and Atg5KO AML cells from panel (b) were respectively pooled. Slides were either immediately fixed or subjected to digitonin treatment followed by fixation. Slides were then analyzed by immunofluorescence microscopy of GFP-LC3 (green) and DAPI (blue) on the Olympus IX81 deconvolution microscope with × 100 oil immersion objective lens and processed on the Intelligent Imaging Solutions SlideBook 5.0 software. Ten fields of view were analyzed for each group and representative images are shown. Scale bars in merge images represent 10 μm. White boxes in merged images are shown magnified to the right. Scale bars in magnified images represent 2 μm. (d) Atg5FL and Atg5KO cells were analyzed for mitochondrial respiration and presented as oxygen consumption rate (OCR). Error bars represent the S.E.M. of five different clones. (e) Five clones each of Atg5FL and Atg5KO cells were seeded at 1 × 10⁴ cells/well in 96-well plates under normoxia and hypoxia, and cell viability was measured every 12 h. Doubling time was calculated according to the exponential growth equation. Statistics were calculated by Student's t-test. *P<0.05 (f) AML cells were subjected to flow cytometric cell cycle analysis and shown as a percentage of all cells excluding Sub-G0 cells on the left. Sub-G0 cells according to cell cycle analysis are shown as a percentage of all cells. (g and h) The viability of AML cells in panel (g), c-kit+Sca-1CD16/32+CD34 LSCs, and AML cells of the indicated phenotypes in panel (h) were analyzed by flow cytometry and categorized as viable (Annexin V7-AAD), early apoptotic (Annexin V+7-AAD), and late apoptotic (Annexin V+7-AAD+) as a percentage of all cells of the indicated phenotype. Error bars represent the S.D. of five clones in each group. Statistical calculations were performed using ANOVA with multiple comparisons for panels (eh). *P<0.05; **P<0.01; ***P<0.001; ****P<0.0001
Figure 5
Figure 5
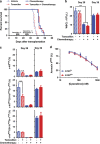
The role of Atg5 in progression and chemotherapy response of MLL-AF9-driven murine AML. (a) The Kaplan–Meier survival curve of non-irradiated C57BL/6J recipient mice transplanted with malignant Atg5FL AML cells. Gray boxes indicate the dates by which the indicated treatments or vehicle controls were given once daily. (b) WBC counts as enumerated by peripheral blood flow cytometry of mice from panel (a) at the indicated dates. Error bars represent the S.E.M. of 10 mice. Statistics were calculated by ANOVA with multiple comparisons. ****P<0.0001; NS, not statistically significant. (c) Peripheral blood flow cytometric analysis of mice from panel (a) on the indicated days shows the Annexin V7-AAD cells of the indicated phenotype as a percentage of total Annexin V7-AADCD45+ cells. Error bars represent S.E.M. of 10 mice. Statistics were calculated by ANOVA with multiple comparisons. ****P<0.0001; NS, not statistically significant. (d) Atg5FL or Atg5KO cells were treated with the indicated concentrations of cytarabine for 24 h and subjected to flow cytometric analysis, representing Annexin V cells as a percentage of all cells and normalized to untreated controls. Error bars indicate S.D. of five different clones

Similar articles

Cited by

References

    1. Döhner H, Weisdorf DJ, Bloomfield CD. Acute myeloid leukemia. N Engl J Med 2015; 373: 1136–1152. - PubMed
    1. Somervaille TCP, Cleary ML. Identification and characterization of leukemia stem cells in murine MLL-AF9 acute myeloid leukemia. Cancer Cell 2006; 10: 257–268. - PubMed
    1. Barabé F, Kennedy JA, Hope KJ, Dick JE. Modeling the initiation and progression of human acute leukemia in mice. Science 2007; 316: 600–604. - PubMed
    1. Corral J, Lavenir I, Impey H, Warren AJ, Forster A, Larson TA et al. An Mll-AF9 fusion gene made by homologous recombination causes acute leukemia in chimeric mice: a method to create fusion oncogenes. Cell 1996; 85: 853–861. - PubMed
    1. Zuber J, Radtke I, Pardee TS, Zhao Z, Rappaport AR, Luo W et al. Mouse models of human AML accurately predict chemotherapy response. Genes Dev 2009; 23: 877–889. - PMC - PubMed

Publication types

MeSH terms

Substances