. 2016 Sep 8;7(9):e2365.
doi: 10.1038/cddis.2016.271.

Inhibition of BET bromodomain-dependent XIAP and FLIP expression sensitizes KRAS-mutated NSCLC to pro-apoptotic agents

Affiliations

Inhibition of BET bromodomain-dependent XIAP and FLIP expression sensitizes KRAS-mutated NSCLC to pro-apoptotic agents

Olaf Klingbeil et al. Cell Death Dis. .

Abstract

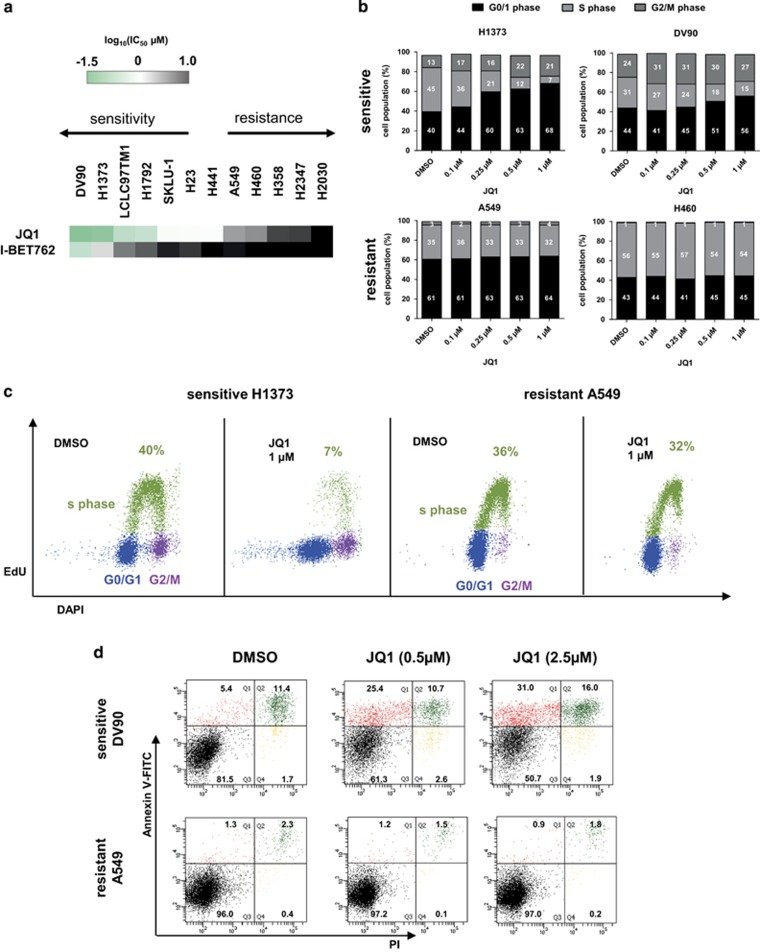
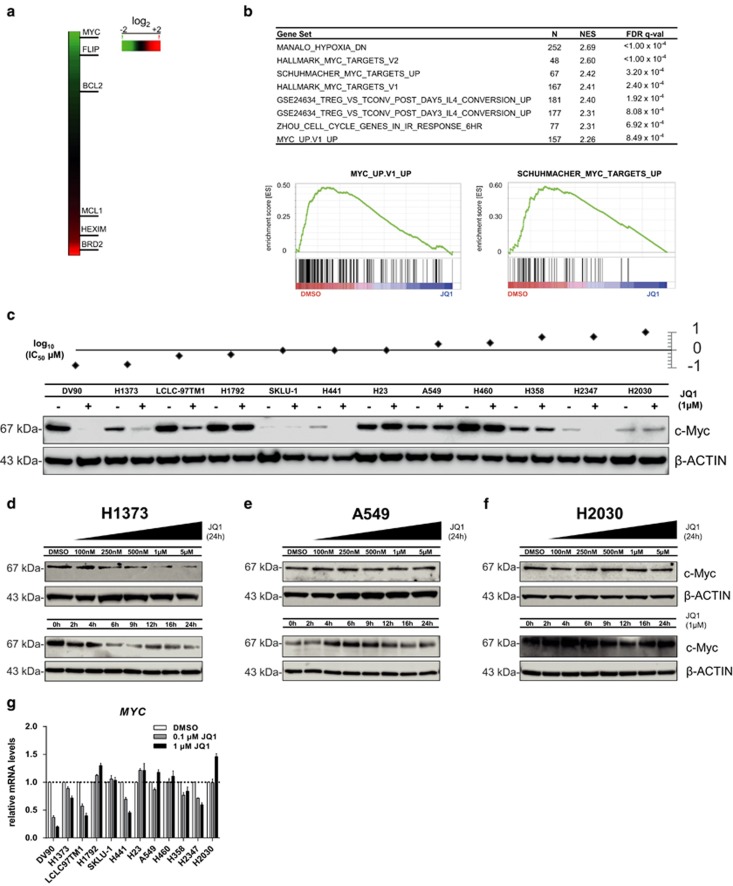
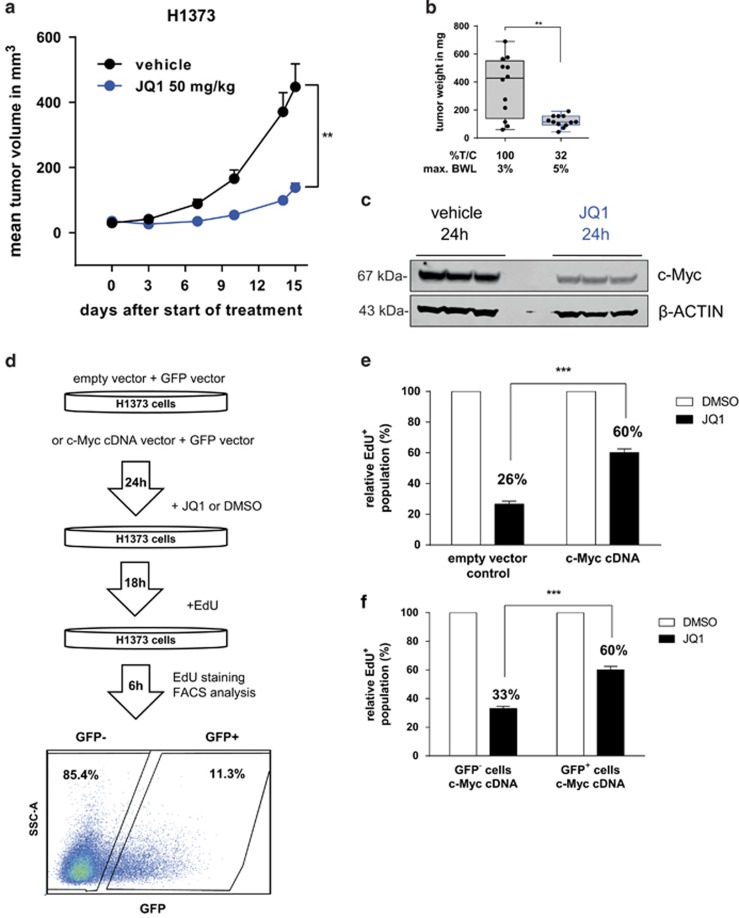
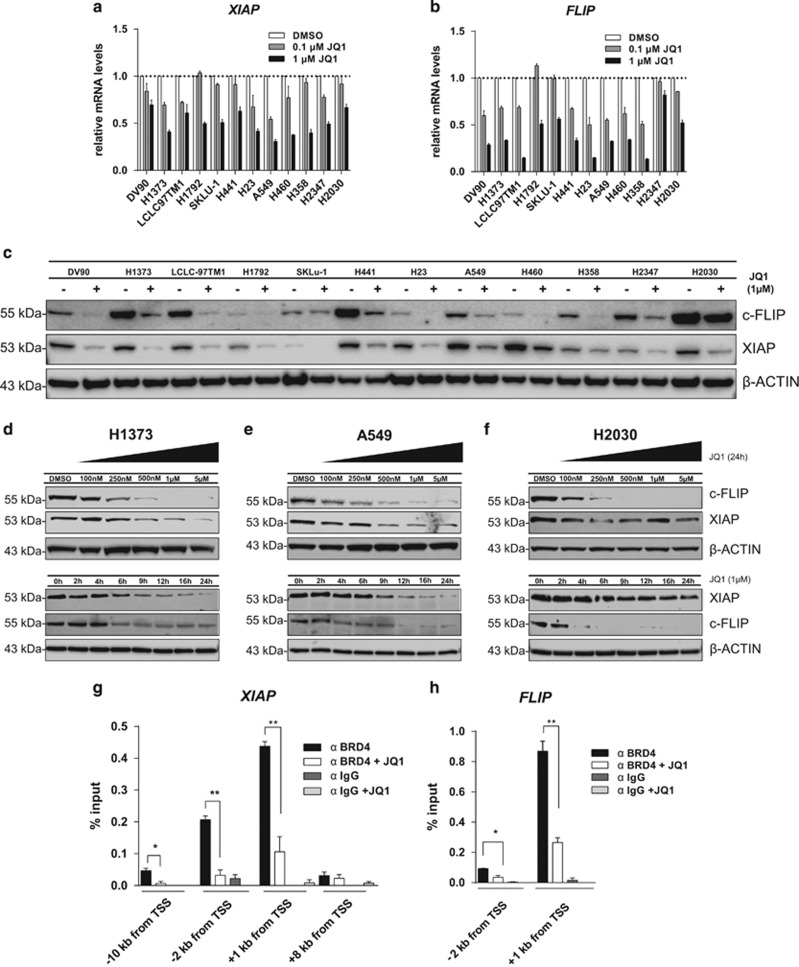
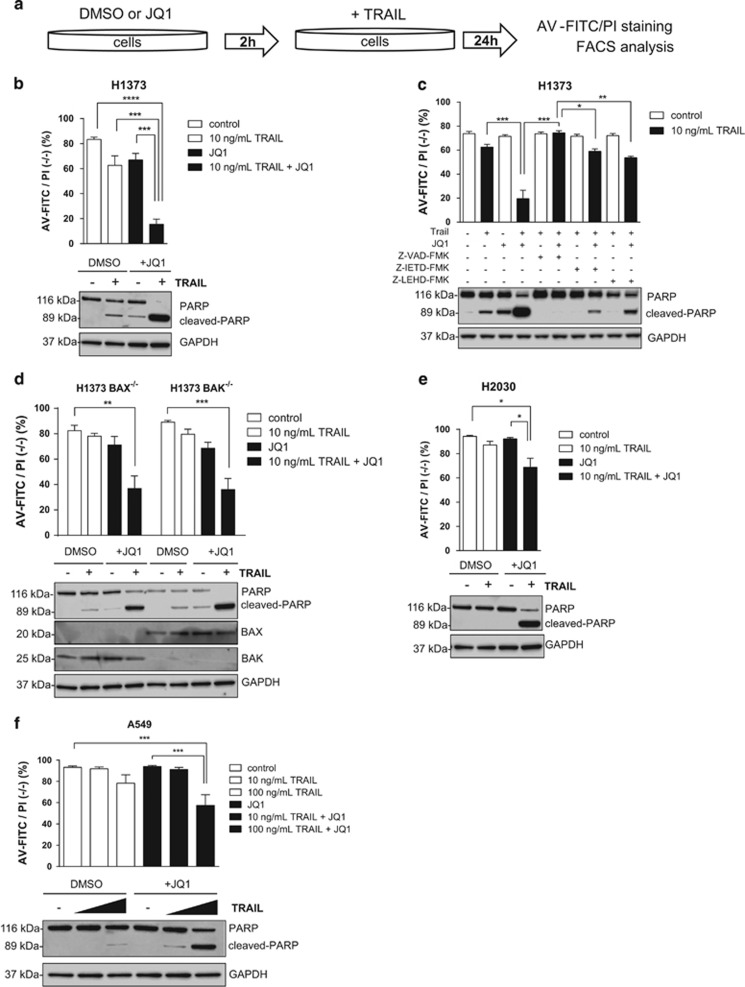
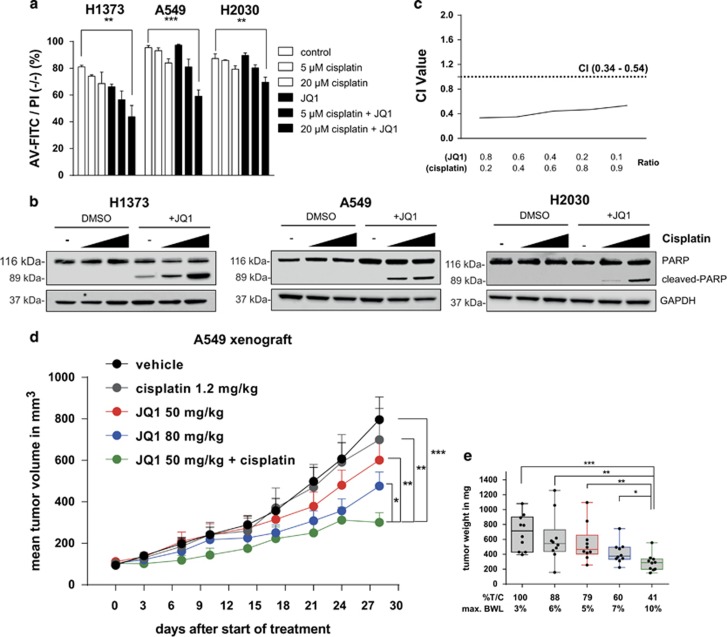
Non-small cell lung cancer (NSCLC) has the highest incidence of cancer-related death worldwide and a high medical need for more effective therapies. Small-molecule inhibitors of the bromodomain and extra terminal domain (BET) family such as JQ1, I-BET762 and OTX-015 are active in a wide range of different cancer types, including lung cancer. Although their activity on oncogene expression such as c-Myc has been addressed in many studies, the effects of BET inhibition on the apoptotic pathway remain largely unknown. Here we evaluated the activity of BET bromodomain inhibitors on cell cycle distribution and on components of the apoptosis response. Using a panel of 12 KRAS-mutated NSCLC models, we found that cell lines responsive to BET inhibitors underwent apoptosis and reduced their S-phase population, concomitant with downregulation of c-Myc expression. Conversely, ectopic c-Myc overexpression rescued the anti-proliferative effect of JQ1. In the H1373 xenograft model, treatment with JQ1 significantly reduced tumor growth and downregulated the expression of c-Myc. The effects of BET inhibition on the expression of 370 genes involved in apoptosis were compared in sensitive and resistant cells and we found the expression of the two key apoptosis regulators FLIP and XIAP to be highly BET dependent. Consistent with this, combination treatment of JQ1 with the tumor necrosis factor-related apoptosis-inducing ligand (TRAIL) or the pro-apoptotic chemotherapeutic agent cisplatin enhanced induction of apoptosis in both BET inhibitor sensitive and resistant cells. Further we showed that combination of JQ1 with cisplatin led to significantly improved anti-tumor efficacy in A549 tumor-bearing mice. Altogether, these results show that the identification of BET-dependent genes provides guidance for the choice of drug combinations in cancer treatment. They also demonstrate that BET inhibition primes NSCLC cells for induction of apoptosis and that a combination with pro-apoptotic compounds represents a valuable strategy to overcome treatment resistance.


Conflict of interest statement

OK, RL, KAG, BH and PL are employees of Bayer Pharma AG, a company having a commercial interest in the development of BET inhibitors.

Figures

Figure 1
Figure 1
(a) IC50 values calculated from cell viability assays using KRAS mutant NSCLC cell lines after 72 h treatment with JQ1 or I-BET762. The data are represented as the mean IC50 of two or three independent experiments. (b) Cell cycle analysis of sensitive DV90 or H1373 and resistant A549 or H460 cells following 24 h of JQ1 treatment. Data are shown as the mean (n=2). (c) Representative cell cycle distribution of viable H1373 or A549 cells 24 h after 1 μM JQ1 treatment. The S-phase cell population is shown in green, G0/G1 in blue and G2 in purple. (d) Flow cytometry results showing percentage of viable population and apoptotic cells of DV90 and A549 after 48 h JQ1 treatment using Annexin-V-FITC and PI staining. AV-positive only population (red), AV/PI-double-positive population in green, AV/PI-negative population in black and PI-positive only in yellow
Figure 2
Figure 2
(a) Heat map of differentially expressed genes in DV90 cells 24 h after treatment with IC50 dose (135 nM) of JQ1. Microarray data were normalized and log fold difference compared to DMSO control is shown. (b) Gene set enrichment analysis (GSEA) of genes downregulated by JQ1 in DV90 cells. Top gene sets ranked by normalized enrichment score (NES), number of genes (N) and false discovery rate (FDR) are shown. Two representative MYC gene sets are depicted. (c) Western blot analysis of c-Myc level 24 h after DMSO (−) or 1 μM JQ1 (+) treatment. Sensitivity of cell lines to JQ1 is represented by log (IC50 μM). (d–f) Western blot analysis of c-Myc level in cell lines with different sensitivities to JQ1. H1373 (d) A549 (e) and H2030 (f) cells were treated with different doses of JQ1 for 24 h or 1 μM JQ1 for different times. (g) Quantitative real time-PCR (qRT-PCR) analysis of MYC mRNA expression 24 h after treatment with 0.1 or 1 μM of JQ1 normalized to housekeeping gene human cyclophilin A and DMSO-treated control. Error bars denote S.E.M. (n=3)
Figure 3
Figure 3
(a) Growth curve of H1373 xenograft treated with vehicle or 50 mg/kg JQ1 i.p. daily. Error bars denote S.E.M. (n=12 mice per group) **P<0.01 two-tailed unpaired Student's t-test on log transformed tumor volume on day 15 after start of treatment. (b) Box and whiskers plot of tumor weight in the H1373 xenograft study on day 15 after start of treatment. Error bars denote S.E.M. (n=12 mice per group). **P<0.01 two-tailed unpaired Student's t-test on log transformed tumor weight. (c) Western blot analysis c-Myc level in tumor tissue from the H1373 xenograft study treated with vehicle or 50 mg/kg JQ1. (d) Workflow of rescue experiment in H1373. Cells were transfected with empty vector or c-Myc expressing vector and GFP vector, and then subsequently treated with JQ1 (0.5 μM) or DMSO and stained using EdU. (e and f) Results of overexpression rescue experiments comparing empty vector versus c-Myc vector transfected cells (e) and GFP versus GFP+ cells co-expressing c-Myc (f) EdU+ population was normalized to DMSO-treated control sample. Error bars denote S.E.M. (n=3). ***P<0.001 two-tailed unpaired Student's t-test
Figure 4
Figure 4
(a and b) Quantitative real time-PCR (qRT-PCR) analysis of XIAP and FLIP mRNA expression 24 h after treatment with 0.1 or 1 μM of JQ1 normalized to both the expression levels of the housekeeping gene human cyclophilin A and DMSO-treated control. Error bars denote S.E.M. (n=3). (c) Western blot analysis of c-FLIP and XIAP 24 h after DMSO (−) or 1 μM JQ1 (+) treatment. (df) Western blot analysis of c-FLIP and XIAP in cell lines with different sensitivities to JQ1. H1373 (d) A549 (e) and H2030 (f) cells were treated with increasing doses of JQ1 for 24 h or with 1 μM for different times. (g and h) ChIP-qPCR analysis of BRD4 binding at the XIAP and FLIP promoters (primer distance from transcription start site (TSS) is indicated) in H1373 cells treated with DMSO or JQ1 (0.5 μM). Error bars denote S.E.M. (n=3). *P<0.05, **P<0.01, two-tailed unpaired Student's t-test
Figure 5
Figure 5
(a) Workflow of combination treatment using JQ1 and TRAIL. Cells were pre-treated with JQ1, subsequently treated with TRAIL, and stained using AV-FITC/PI for analysis of apoptosis with flow cytometer (results showing the percentage of viable population (%AV-FITC/PI negative (−/−)) are reported in top of (bf); western blot results showing PARP cleavage are on the bottom of b–f). (b) Treatment of H1373 cells with TRAIL (10 ng/ml) and JQ1 (1 μM) alone or in combination. (c) As in (b), however, with 20 μM of the caspase inhibitors z-VAD-FMK (pan-caspase inhibitor), z-IETD-FMK (caspase 8 inhibitor) or z-LEHD-FMK (caspase 9 inhibitor). (d) Results of the rescue experiment after treatment of H1373 BAX or BAK knockout cells with TRAIL (10 ng/ml) and JQ1 (1 μM) alone or in combination. (e and f), H2030 or A549 cells after treatment with TRAIL (10 or 100 ng/ml) and JQ1 (1 μM) alone or in combination. Error bars denote S.E.M. (n=3–5). *P<0.05, **P<0.01, ***P<0.001, non-parametric one-way analysis of variance (ANOVA) with Sidak's correction for multiple comparisons
Figure 6
Figure 6
(a) Flow cytometry results showing the percentage of viable population (%AV-FITC/PI negative (−/−)) after treatment of H1373, A549 and H2030 cells with cisplatin and JQ1 (1 μM) alone or in combination. Error bars denote S.E.M. (n=3). **P<0.01, ***P<0.001, non-parametric one-way analysis of variance (ANOVA) with Sidak's correction for multiple comparison. (b) Western blot analyses of PARP cleavage following treatment with cisplatin and JQ1 (1 μM) alone or in combination. (c) Assessment of the degree of synergy between cisplatin and JQ1 in A549 cells using the Chou Talalay method. Calculated CI is plotted against drug ratios. Results are shown as the mean (n=2). The cutoff point for synergy is defined by CI<1.0. (d) Growth curve of A549 xenograft treated with vehicle, JQ1 (50 mg/kg, 80 mg/kg) i.p. daily, cisplatin 1.2 mg/kg i.v. QDx5 or in combination (50 mg/kg JQ1+1.2 mg/kg QDx5 cisplatin). Error bars denote S.E.M. (n=10 mice per group) *P<0.05, **P<0.01, ***P<0.001 two-tailed unpaired Student's t-test on log transformed tumor volume on day 28 after start of treatment. (e) Box and whiskers plot of tumor weight of the A549 xenograft study on day 28 after start of treatment. Error bars denote S.E.M. (n=10 mice per group). *P<0.05, **P<0.01, ***P<0.001 two-tailed unpaired Student's t-test on log transformed tumor weight

References

    1. Valdespino V, Valdespino PM. Potential of epigenetic therapies in the management of solid tumors. Cancer Manag Res 2015; 7: 241–251. - PMC - PubMed
    1. Filippakopoulos P, Qi J, Picaud S, Shen Y, Smith WB, Fedorov O et al. Selective inhibition of BET bromodomains. Nature 2010; 468: 1067–1073. - PMC - PubMed
    1. Bandopadhayay P, Bergthold G, Nguyen B, Schubert S, Gholamin S, Tang Y et al. BET bromodomain inhibition of MYC-amplified medulloblastoma. Clin Cancer Res 2014; 20: 912–925. - PMC - PubMed
    1. Asangani IA, Dommeti VL, Wang X, Malik R, Cieslik M, Yang R et al. Therapeutic targeting of BET bromodomain proteins in castration-resistant prostate cancer. Nature 2014; 510: 278–282. - PMC - PubMed
    1. Segura MF, Fontanals-Cirera B, Gaziel-Sovran A, Guijarro MV, Hanniford D, Zhang G et al. BRD4 sustains melanoma proliferation and represents a new target for epigenetic therapy. Cancer Res 2013; 73: 6264–6276. - PMC - PubMed

MeSH terms