. 2016 Sep 8;7(9):e2367.
doi: 10.1038/cddis.2016.133.

Clearance of autophagy-associated dying retinal pigment epithelial cells - a possible source for inflammation in age-related macular degeneration

Affiliations

Clearance of autophagy-associated dying retinal pigment epithelial cells - a possible source for inflammation in age-related macular degeneration

M Szatmári-Tóth et al. Cell Death Dis. .

Abstract

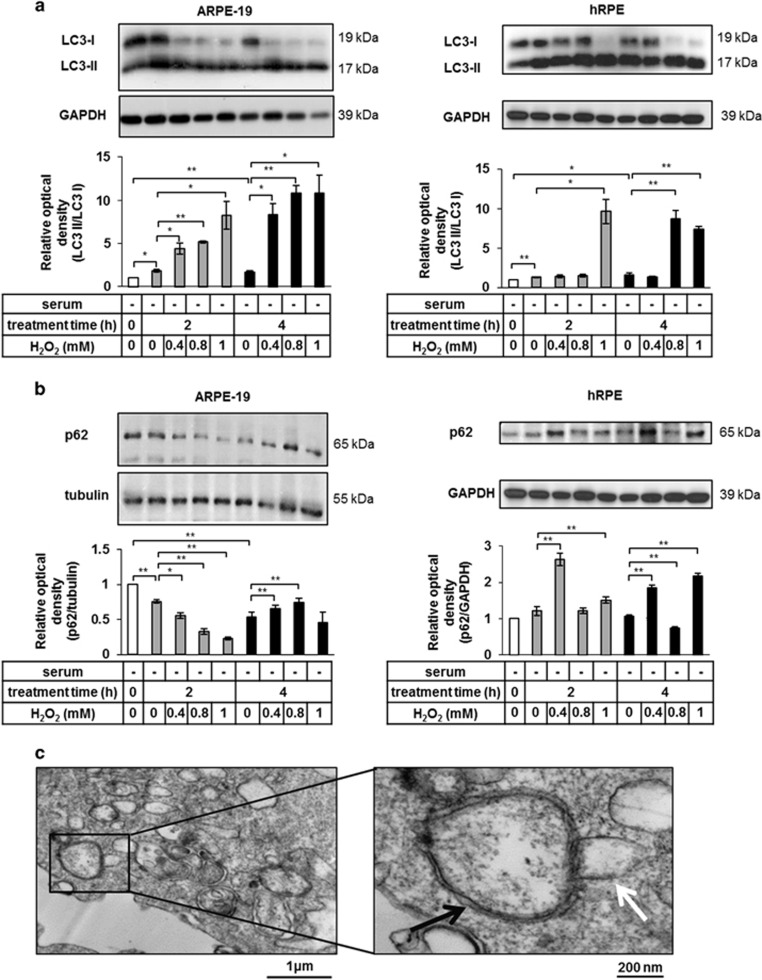
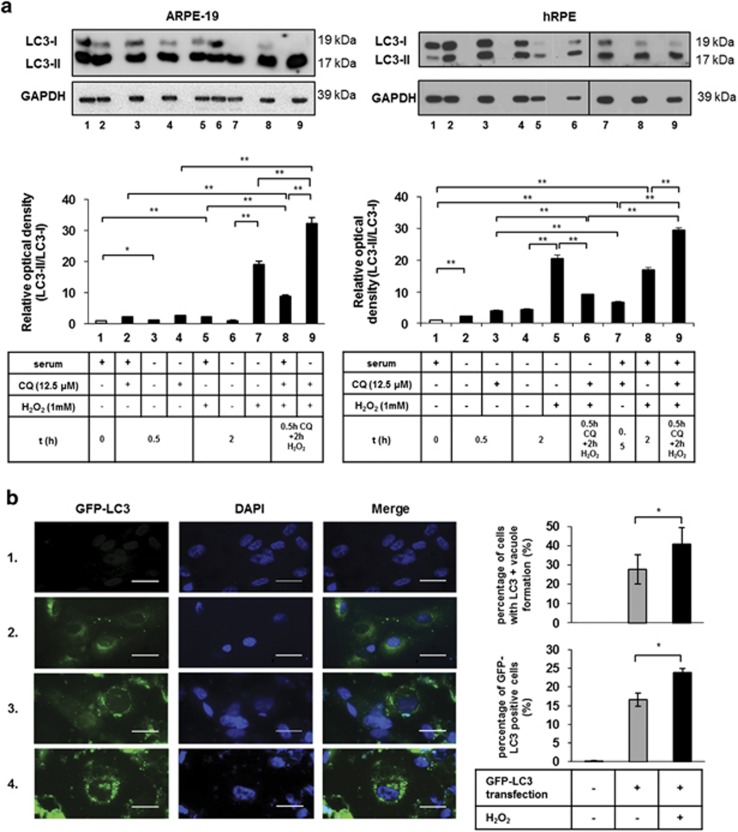
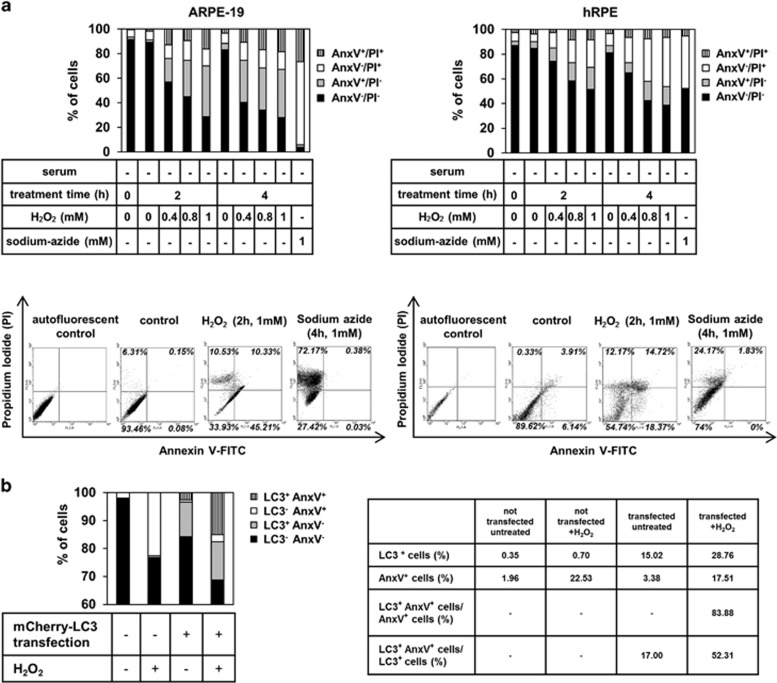
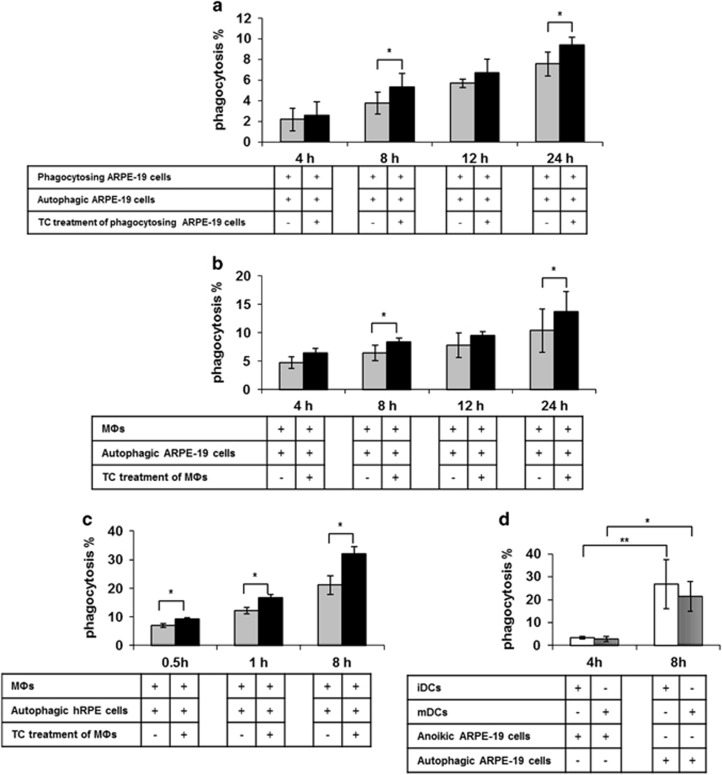
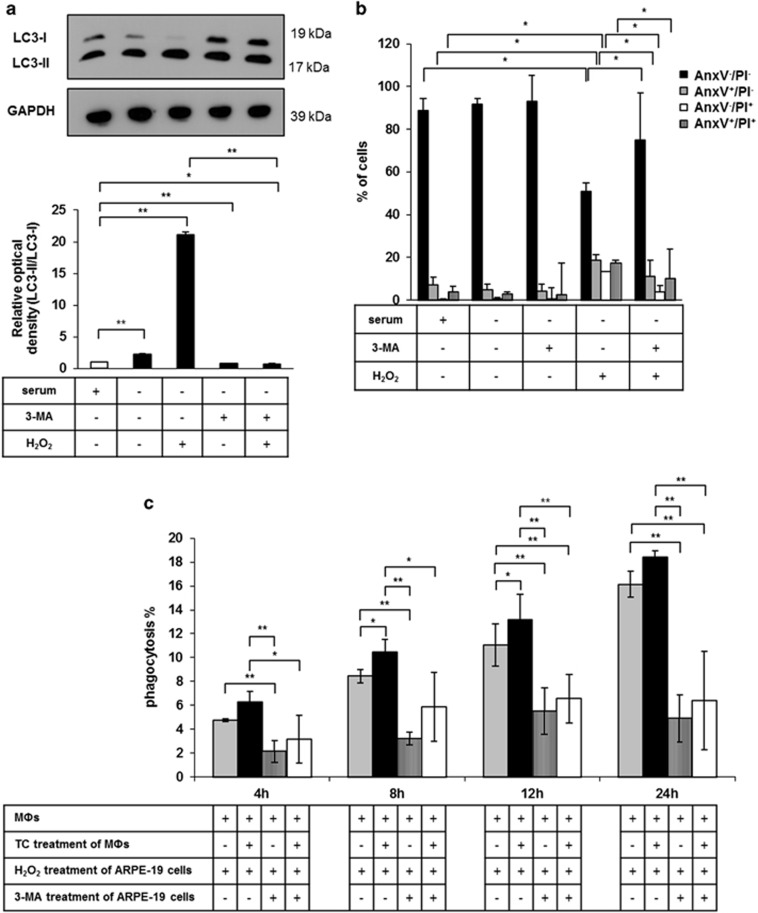
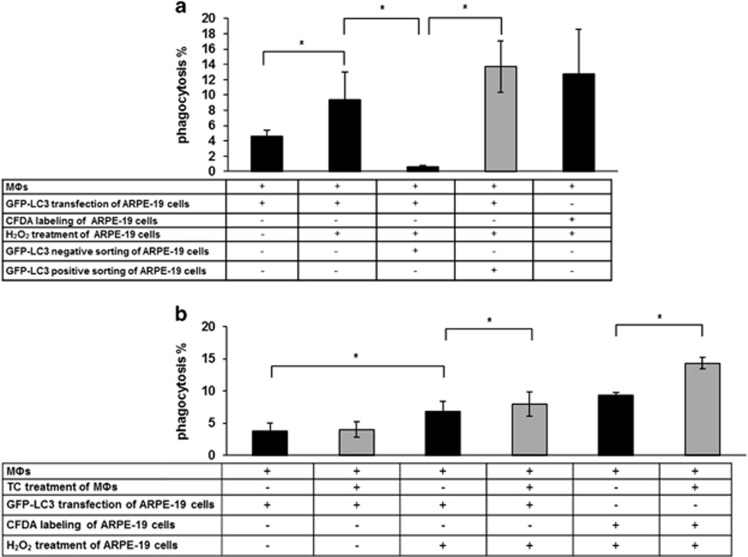
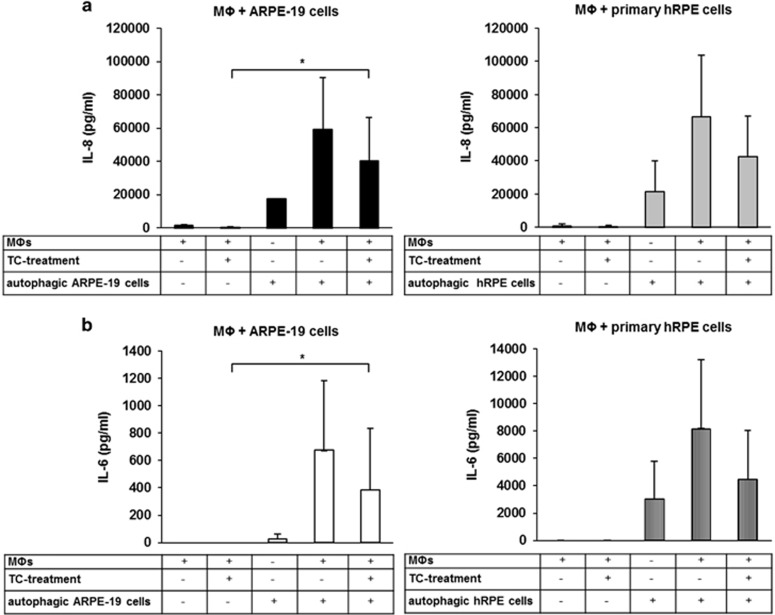
Retinal pigment epithelial (RPE) cells can undergo different forms of cell death, including autophagy-associated cell death during age-related macular degeneration (AMD). Failure of macrophages or dendritic cells (DCs) to engulf the different dying cells in the retina may result in the accumulation of debris and progression of AMD. ARPE-19 and primary human RPE cells undergo autophagy-associated cell death upon serum depletion and oxidative stress induced by hydrogen peroxide (H2O2). Autophagy was revealed by elevated light-chain-3 II (LC3-II) expression and electron microscopy, while autophagic flux was confirmed by blocking the autophago-lysosomal fusion using chloroquine (CQ) in these cells. The autophagy-associated dying RPE cells were engulfed by human macrophages, DCs and living RPE cells in an increasing and time-dependent manner. Inhibition of autophagy by 3-methyladenine (3-MA) decreased the engulfment of the autophagy-associated dying cells by macrophages, whereas sorting out the GFP-LC3-positive/autophagic cell population or treatment by the glucocorticoid triamcinolone (TC) enhanced it. Increased amounts of IL-6 and IL-8 were released when autophagy-associated dying RPEs were engulfed by macrophages. Our data suggest that cells undergoing autophagy-associated cell death engage in clearance mechanisms guided by professional and non-professional phagocytes, which is accompanied by inflammation as part of an in vitro modeling of AMD pathogenesis.


Figures

Figure 1
Figure 1
Serum deprivation and H2O2 co-treatment result in induced autophagy in ARPE-19 and human primary RPE (hRPE) cells. Detection of autophagy by quantification of the LC3-II/LC3-I ratio (a) and p62 expression (b) in ARPE-19 (left panels) and primary hRPE cells (right panels) using western blot analysis after increasing time (2 h, 4 h) and concentrations (0.4 mM, 0.8 mM, 1 mM) of H2O2-treatment in the absence of serum. Relative optical density was determined by densitometry using the ImageJ software (white bars show the untreated controls; gray and black bars represent 2 h and 4 h long treatments, respectively). GAPDH and tubulin were used as loading controls. Data are mean±S.E.M. of three independent measurements, *P<0.05, **P<0.01. (c) Double-membraned autophagic vesicles (black arrow) were detected in H2O2-treated (2 h, 1 mM) ARPE-19 cells by transmission electron microscopy (TEM, Philips CM 10 microscope). Fusion between the autophagosomes and lysosomes (white arrow) was observed. Scale bars represent 1 μm (left panel) or 200 nm (right panel). Data are representative of three independent experiments
Figure 2
Figure 2
Detection of increased autophagic flux in ARPE-19 and primary hRPE cells. (a) Autophagic flux was assessed by western blot analysis based on the quantification of LC3-II/LC3-I ratio. ARPE-19 (left panel) and primary hRPE cells (right panel) were pre-treated with chloroquine (CQ) (0.5 h,12.5 μM) and then treated with H2O2 (2 h, 1 mM) in the presence or absence of serum. GAPDH was used as a loading control. Relative optical density was determined by densitometry using the ImageJ software. Data are mean±S.E.M. of three independent experiments, *P<0.05, **P<0.01. (b) Representative immunofluorescence images of ARPE-19 cells transiently transfected with a GFP-LC3 plasmid. Non-transfected, GFP-LC3-transfected and untreated cells are shown in row 1 and 2, respectively. H2O2 treatment resulted in the accumulation of perinuclear, ring-shaped GFP-LC3-positive aggregates in the transfected ARPE-19 cells (row 3). CQ and subsequent H2O2 treatment (2 h, 1 mM) led to more abundant and bigger GFP-LC3-positive AVs (row 4). Cell nuclei were labeled with DAPI. Scale bar represents 20 μm. Images are representative of three independent experiments. Quantification of cells containing GFP-LC3-positive vacuoles (top graph) was performed by manual cell counting based on the fluorescent images. The ratio of the number of GFP-LC3-positive cells to the total cell number in H2O2-treated ARPE-19 cells is shown as a percentage. Data are expressed as mean±S.D. of at least 10 different visual fields on microscopy from three independent experiments in each condition (*P<0.05, by Student t-test). The percentage of GFP-LC3-positive cells (bottom graph) was quantified using FACS analysis. Data are expressed as mean±S.D. of three independent experiments, *P<0.05 by Student t-test
Figure 3
Figure 3
ARPE-19 and primary hRPE cells die as a result of serum deprivation and H2O2 co-treatment in a time- and concentration-dependent manner. (a) Quantification of the cell death rate by flow cytometry after increasing time intervals (2 h, 4 h) and concentrations (0.4 mM, 0.8 mM, 1 mM) of H2O2-treatment in the absence of serum in ARPE-19 (left panel) and hRPE (right panel) cells using Annexin V (AnxV)-FITC/propidium iodide (PI) labeling. Sodium-azide treatment (4 h, 1 mM) was used as positive control for necrotic cell death. The bar charts indicate the percentage of AnxV/PI (viable; black bars), AnxV+/PI (early apoptotic; gray bars), AnxV/PI+ (necrotic; white bars) and AnxV+/PI+ (late apoptotic; striped bars) cells. Data are shown from three and four independent experiments for ARPE-19 and hRPE, respectively. Representative dot plots of AnxV/PI measurements of dying ARPE-19 and hRPE cells are also shown. The horizontal axis represents intensity of staining for Annexin V (logarithmic scale) and the vertical axis shows intensity of staining for PI (logarithmic scale). The numbers in the quadrants indicate the percentage of different cell populations: viable (lower left), apoptotic (lower right), necrotic (upper left), late apoptotic cells (upper right). Data are representative of three independent experiments. (b) The rate of H2O2-induced cell death of ARPE-19 cells containing LC3-positive AVs and showing PS externalization is demonstrated; mCherry-LC3 plasmid was transiently transfected into ARPE-19 cells using PEI reagent. The cells were treated with H2O2 (2 h, 1mM) and then annexin V-FITC labeling was performed. The bar charts represent the percentage of LC3AnxV (black bars), LC3+AnxV (gray bars), LC3AnxV+ (white bars) and LC3+AnxV+ (striped bars) cells. The table shows the percentage of LC3+ and AnxV+ cells and the rate of LC3+AnxV+/AnxV+ and LC3+AnxV+/LC3+ untreated and H2O2-treated cells. Data are shown from three independent experiments
Figure 4
Figure 4
Non-professional and professional phagocytes are able to efficiently engulf autophagy-associated dying RPE cells in vitro. The clearance of autophagy-associated dying ARPE-19 cells by living ARPE-19 cells (a) and macrophages (MΦ) (b) after increasing co-incubation periods (4 h, 8 h, 12 h, 24 h) is shown as determined by FACS analysis. Phagocytes pre-treated with triamcinolone (TC) (48 h, 1 μM) were labeled by black bars (gray bars indicate untreated phagocytes). (c) The rate of phagocytosis of autophagy-associated dying primary hRPE cells by MΦs treated with (black bars) or without (gray bars) TC were measured after increasing co-incubation periods (0.5 h, 1 h, 8 h) by FACS analysis. (d) Phagocytic capacity of immature DCs (iDCs) (white bars) and mature DCs (mDCs) (striped bars) for engulfment of anoikic or autophagy-associated dying ARPE-19 cells after 4 and 8 h co-incubation is shown, respectively. Bars represent the mean±S.D. of four independent experiments. *P<0.05, **P<0.01
Figure 5
Figure 5
Inhibition of autophagy-associated cell death of ARPE-19 cells by 3-MA and subsequent effect upon phagocytosis. (a) Detection of autophagy inhibition by quantification of LC3-II/LC3-I ratio in 3-MA pre-treated (24 h, 10 mM) and H2O2-treated (2 h, 1 mM) ARPE-19 cells is shown using western blot analysis. Relative optical density was determined by densitometry using the ImageJ software (white bar shows the untreated control, black bars represent the treated samples). GAPDH was used as a loading control. Data are mean±S.E.M. of three independent measurements, *P<0.05, **P<0.01. (b) Quantification of the cell death rate of 3-MA pre-treated (24 h, 10 mM) and H2O2-treated (2 h, 1 mM) ARPE-19 cells by FACS analysis using Annexin V-FITC/PI labeling. Data are expressed as mean±S.D. of four independent experiments, *P<0.05 by Student t-test. (c) Phagocytosis of 3-MA pre-treated (24 h, 10 mM) and H2O2-treated (2 h, 1 mM) ARPE-19 cells by untreated and TC-treated (48 h, 1 μM) MФs after increasing co-incubation periods (4 h, 8 h, 12 h, 24 h). Bars represent mean±S.D. of three independent experiments, *P<0.05, **P<0.01
Figure 6
Figure 6
Dynamics of the engulfment of GFP-LC3 transfected, H2O2-treated ARPE-19 cells. (a) Phagocytosis of GFP-LC3-transfected, untreated or H2O2-treated (2 h, 1 mM) and GFP-LC3-negative or -positive sorted cells, and not transfected, H2O2-treated ARPE-19 cells by MФs after 8 h co-incubation. (b) Clearance of GFP-LC3-transfected, untreated or H2O2-treated and not transfected, H2O2-treated ARPE-19 cells by untreated and TC-treated (48 h, 1 μM) MФs after 8 h co-incubation. Bars represent mean±S.D. of three independent experiments, *P<0.05
Figure 7
Figure 7
Release of IL-6 and IL-8 during phagocytosis of autophagy-associated dying RPE cells. H2O2-treated ARPE-19 (left panels) and hRPE cells (right panels) were co-incubated with untreated and TC-treated (48 h, 1 μM) MФs for 8 h, then the supernatants were collected, and the concentration of IL-8 (a) and IL-6 (b) was determined by ELISA. Bars represent the mean±S.D. of three independent experiments, *P<0.05

Similar articles

Cited by

References

    1. Ardeljan CP, Ardeljan D, Abu-Asab M, Chan CC. Inflammation and cell death in age-related macular degeneration: an immunopathological and ultrastructural model. J Clin Med 2014; 3: 1542–1560. - PMC - PubMed
    1. Wada Y, Sun-Wada GH, Kawamura N, Aoyama M. Role of autophagy in embryogenesis. Curr Opin Genet Dev 2014; 27: 60–66. - PubMed
    1. Hu Z, Yang B, Mo X, Xiao H. Mechanism and regulation of autophagy and its role in neuronal diseases. Mol Neurobiol 2014; 52: 1190–1209. - PubMed
    1. Kaarniranta K, Sinha D, Blasiak J, Kauppinen A, Vereb Z, Salminen A et al. Autophagy and heterophagy dysregulation leads to retinal pigment epithelium dysfunction and development of age-related macular degeneration. Autophagy 2013; 9: 973–984. - PMC - PubMed
    1. Edelman JL. Differentiating intraocular glucocorticoids. Ophthalmologica 2010; 224 (Suppl 1): 25–30. - PubMed

MeSH terms