. 2016 Sep 8;13(1):81.
doi: 10.1186/s12984-016-0187-9.

Model-based variables for the kinematic assessment of upper-extremity impairments in post-stroke patients

Affiliations

Model-based variables for the kinematic assessment of upper-extremity impairments in post-stroke patients

Alessandro Panarese et al. J Neuroeng Rehabil. .

Abstract

Background: Common scales for clinical evaluation of post-stroke upper-limb motor recovery are often complemented with kinematic parameters extracted from movement trajectories. However, there is no a general consensus on which parameters to use. Moreover, the selected variables may be redundant and highly correlated or, conversely, may incompletely sample the kinematic information from the trajectories. Here we sought to identify a set of clinically useful variables for an exhaustive but yet economical kinematic characterization of upper limb movements performed by post-stroke hemiparetic subjects.

Methods: For this purpose, we pursued a top-down model-driven approach, seeking which kinematic parameters were pivotal for a computational model to generate trajectories of point-to-point planar movements similar to those made by post-stroke subjects at different levels of impairment.

Results: The set of kinematic variables used in the model allowed for the generation of trajectories significantly similar to those of either sub-acute or chronic post-stroke patients at different time points during the therapy. Simulated trajectories also correctly reproduced many kinematic features of real movements, as assessed by an extensive set of kinematic metrics computed on both real and simulated curves. When inspected for redundancy, we found that variations in the variables used in the model were explained by three different underlying and unobserved factors related to movement efficiency, speed, and accuracy, possibly revealing different working mechanisms of recovery.

Conclusion: This study identified a set of measures capable of extensively characterizing the kinematics of upper limb movements performed by post-stroke subjects and of tracking changes of different motor improvement aspects throughout the rehabilitation process.

Keywords: Kinematics; Modeling; Robotic rehabilitation; Stroke.


Figures
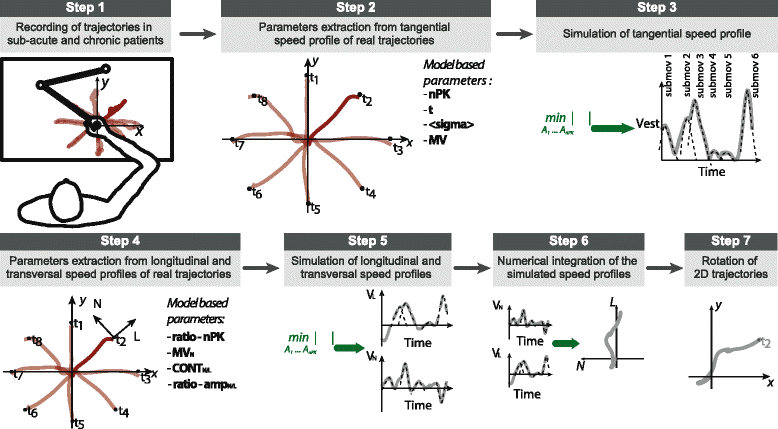
Fig. 1
Fig. 1
Schematic overview of the computational model for post-stroke trajectories simulation. (1) Endpoint kinematics of one pathological subject making point to point forward and backward movements from the center of the workspace to one of eight different targets equally spaced around a circle of 14 cm of radius assisted by InMotion2. (2) Kinematic parameters are extracted from the real trajectories of the post-stroke subjects. The tangential speed profile of real trajectories (for each movement direction and subject, separately for each group of patients and time of therapy) is analyzed to extract probability distributions of nPK, <σ>, T, and MV. (3) Based on the inferred probability distributions, tangential speed profiles of simulated trajectories are generated by solving a constrained optimization problem (Eq. 2). (4) The transversal and longitudinal speed profiles of real trajectories are analyzed to extract probability distributions of ratio-amp L, ratio-amp N, ratio-nPK, MV N, CONT L, and CONT N. (5) From the simulated tangential velocities and the inferred distributions of kinematic parameters, transversal and longitudinal speed profiles of simulated trajectories are generated, by solving an unconstrained optimization problem (Eq. 4). (6) The trajectories in the Cartesian space defined by the (L, N) axes (see step 4) are obtained from the speed profiles by numerical integration. (7) The generated trajectories are then rotated by means of a geometrical transformation to reproduce the point-to-point movements performed by post-stroke subjects during a turn in the InMotion2 coordinate frame system
Fig. 2
Fig. 2
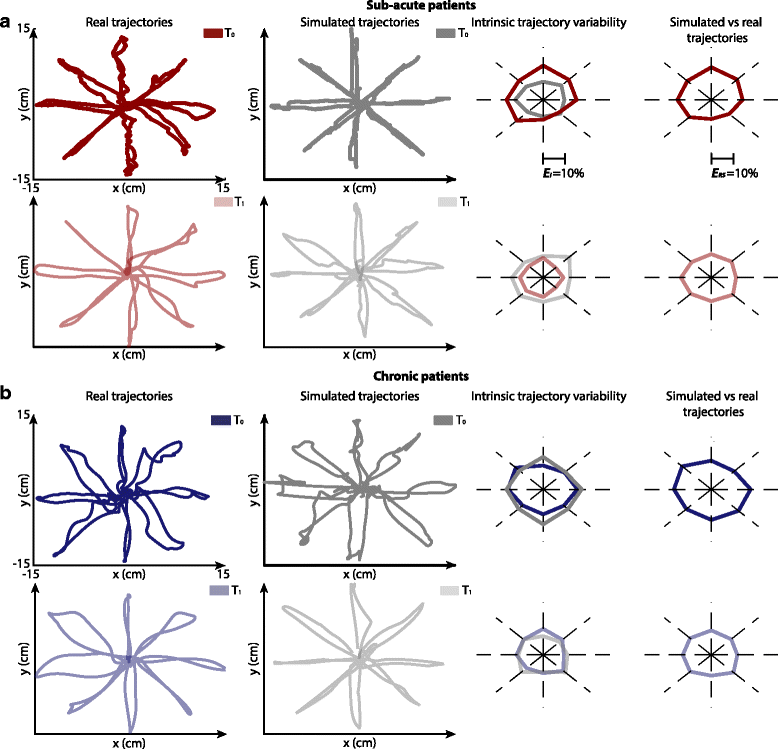
Real and simulated trajectories: Cartesian space. a Results for sub-acute patients. Real and simulated trajectories (first and second columns respectively) at T 0 (first row) and T 1 (second row) for a representative subject and for one repetition of the simulation. On the third columns the angular plots of the average normalized Euclidean distance among repetitions of the model (grey line, E I (S)) and among subjects (red line, E I (R)) for the 8 directions of movements. On the fourth columns the angular plots of the average normalized Euclidean distance between repetitions of the model and subjects for the 8 directions of movements (E RS). b Results for a representative chronic patient, same organization of sub-acute patient
Fig. 3
Fig. 3
Real and simulated trajectories: Joint space. In the first row the results for the joint angular excursions for a sub-acute representative patient. In particular, in the first and second columns inter-joint coordination between elbow and shoulder angles for the 8 directions of movements, only for movements from the center of the workspace to targets, for T 0 (first column) and T 1 (second column) for real (red lines) and simulated trajectories (grey lines). Angular plots show shoulder (third column) and elbow (fourth column) normalized distance between real and simulated trajectories for the 8 directions of movements for T 0 (dark colors) and T 1 (light colors). In the second row results for a representative chronic patient, same organization of sub-acute patient
Fig. 4
Fig. 4
Clinical scores and movement characterization. a Mean and standard deviation of clinical scores (FMA, MAS shoulder and MAS elbow, and MI) for T 0 and T 1 (dark and light colors bars, respectively) for sub-acute and chronic patients (red and blue bars, respectively). Correlation matrix among clinical scales is also reported. b For the Model-based parameters, the average ± standard error (shaded area) time course of recovery for sub-acute (red line) and chronic patients (blue line) is reported. In the bar plots mean values (over repetitions, movement directions, and subjects) for T 0 (dark colors) and T 1 (light colors) for sub-acute (red bars) and chronic (blue bars) patients and for healthy subjects (yellow bars). Standard error is calculated over subjects. Asterisks (*) indicate significant differences (Wilcoxon signed-rank test, p < 0.05) between T 0 and T 1 for sub-acute (red), chronic (blue). Yellow and orange asterisks (*) refer to significant differences (Mann–Whitney U-test, p < 0.05) between post-stroke and healthy subjects for only T 0 and for T 0 and T 1, respectively
Fig. 5
Fig. 5
Factorial analysis of Model-based parameters. a Correlation matrix for the Model-based parameters. b Three-dimensional factor representation of the Model-based parameters. Pink, black, and green lines code the parameters associated with factor 1, factor 2, and factor 3, respectively. Blue lines code the parameters that are “shared” across factors. c Right: correlation matrix between factors and clinical scores. The colorbar is the same of panel (a). MASs and MASe abbreviate MAS shoulder and MAS elbow, respectively. Left: Scatter plots of the correlation between the three main factors and the clinical scores. d Temporal evolution of the three factors for sub-acute (top row) and chronic patients (bottom row). Each point represents the value of the factor for each session averaged across patients. Thick lines represent the results of the fitting of experimental data (i.e., linear, exponential or double exponential). Y-axis scales are different for each factor and patients group

Similar articles

Cited by

References

    1. Gresham GE, Duncan PW, Stason WB. Post-stroke rehabilitation. Darby: DIANE Publishing; 1997.
    1. Donnan GA, Fisher M, Macleod M, Davis SM. Stroke. Lancet. 2008;371:1612–1623. doi: 10.1016/S0140-6736(08)60694-7. - DOI - PubMed
    1. Rohrer B, Fasoli S, Krebs HI, Hughes R, Volpe B, Frontera WR, Stein J, Hogan N. Movement smoothness changes during stroke recovery. J Neurosci. 2002;22:8297–8304. - PMC - PubMed
    1. Patton J, Small SL, Zev Rymer W. Functional restoration for the stroke survivor: informing the efforts of engineers. Top Stroke Rehabil. 2008;15:521–541. doi: 10.1310/tsr1506-521. - DOI - PMC - PubMed
    1. Krebs HI, Krams M, Agrafiotis DK, DiBernardo A, Chavez JC, Littman GS, Yang E, Byttebier G, Dipietro L, Rykman A. Robotic measurement of arm movements after stroke establishes biomarkers of motor recovery. Stroke. 2014;45:200–204. doi: 10.1161/STROKEAHA.113.002296. - DOI - PMC - PubMed