

Roles and regulation of autophagy and apoptosis in the remodelling of the lepidopteran midgut epithelium during metamorphosis
- PMID: 27609527
- PMCID: PMC5016986
- DOI: 10.1038/srep32939
Roles and regulation of autophagy and apoptosis in the remodelling of the lepidopteran midgut epithelium during metamorphosis
Abstract
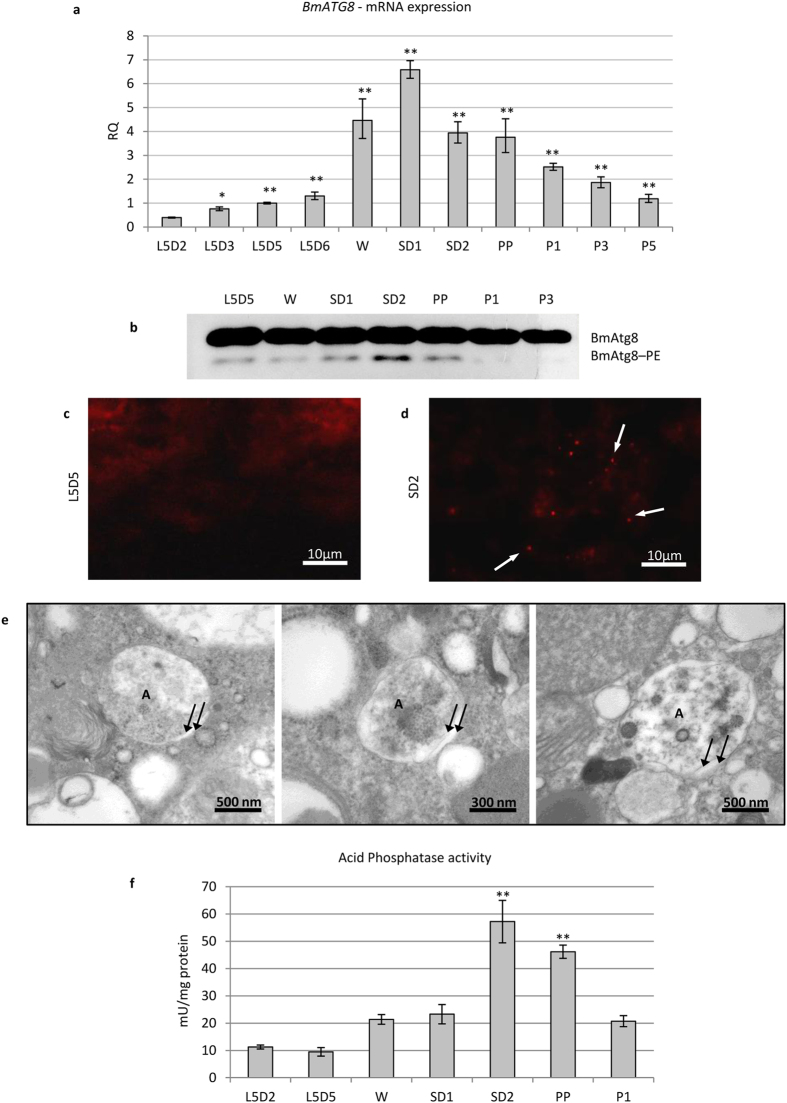
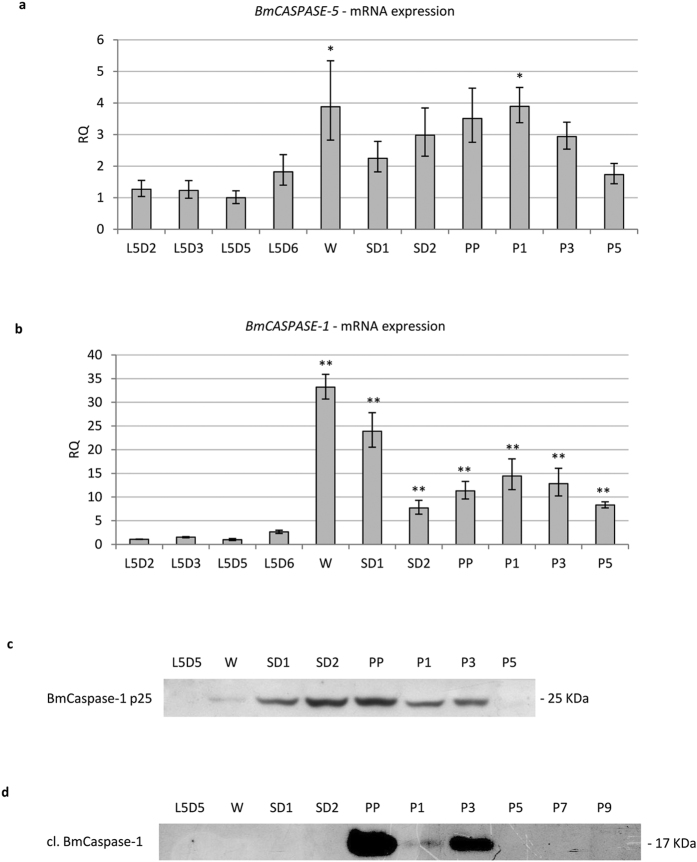
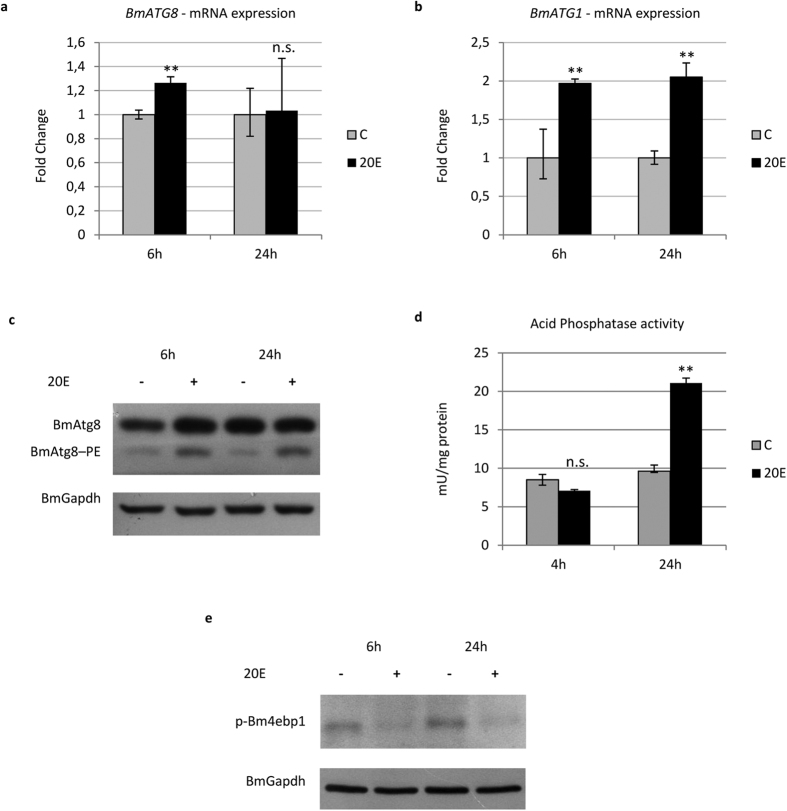
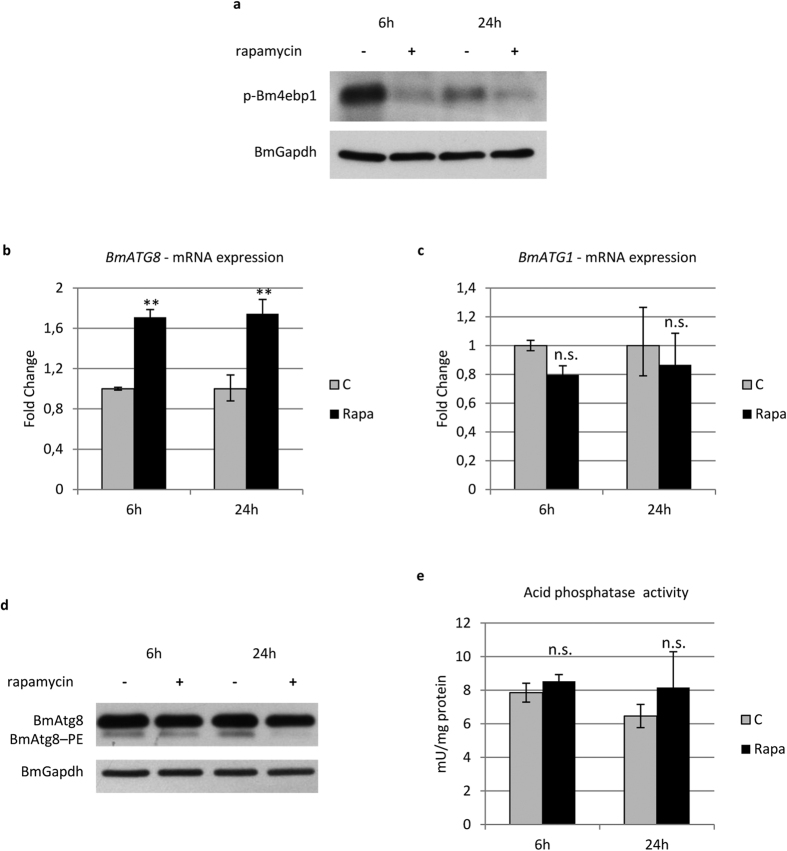
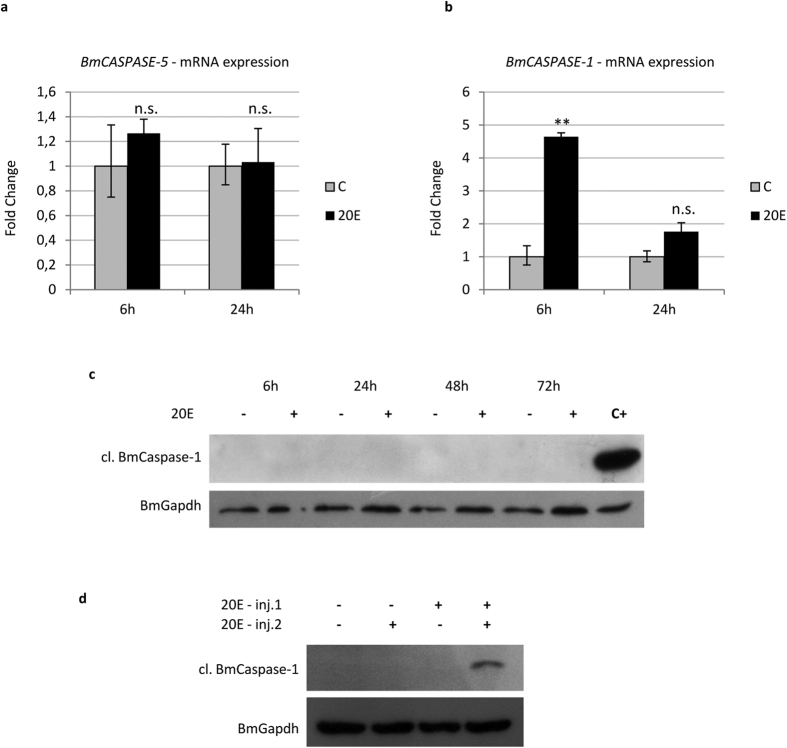
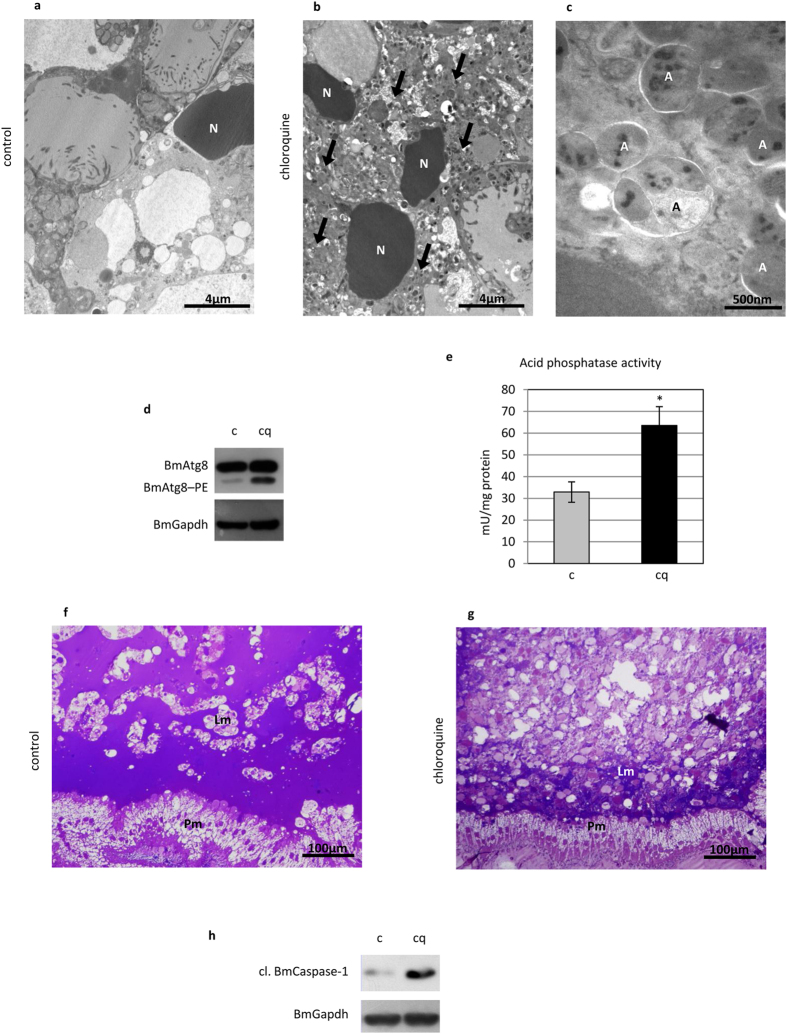
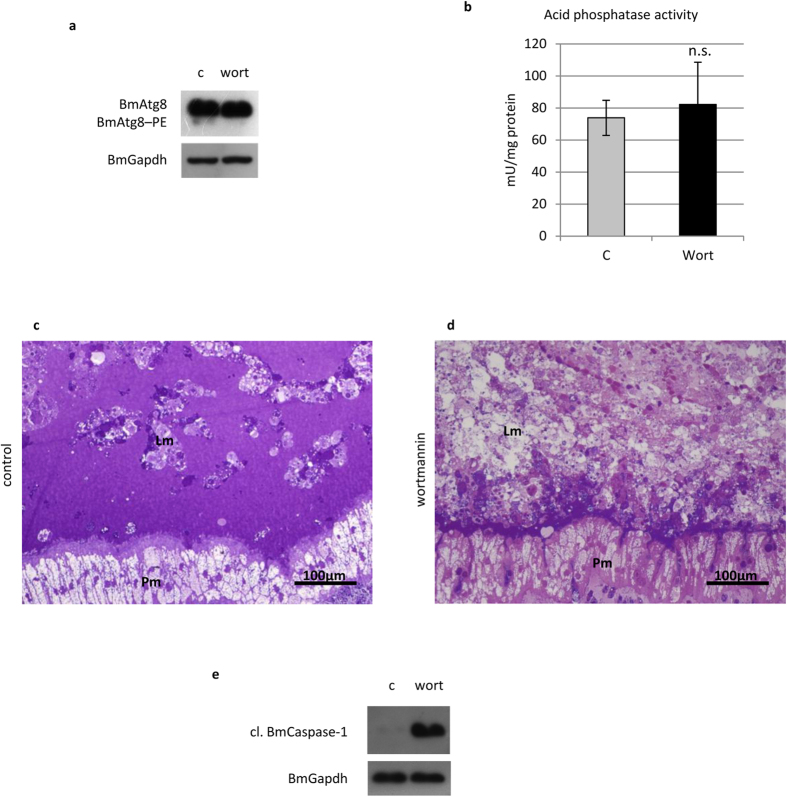
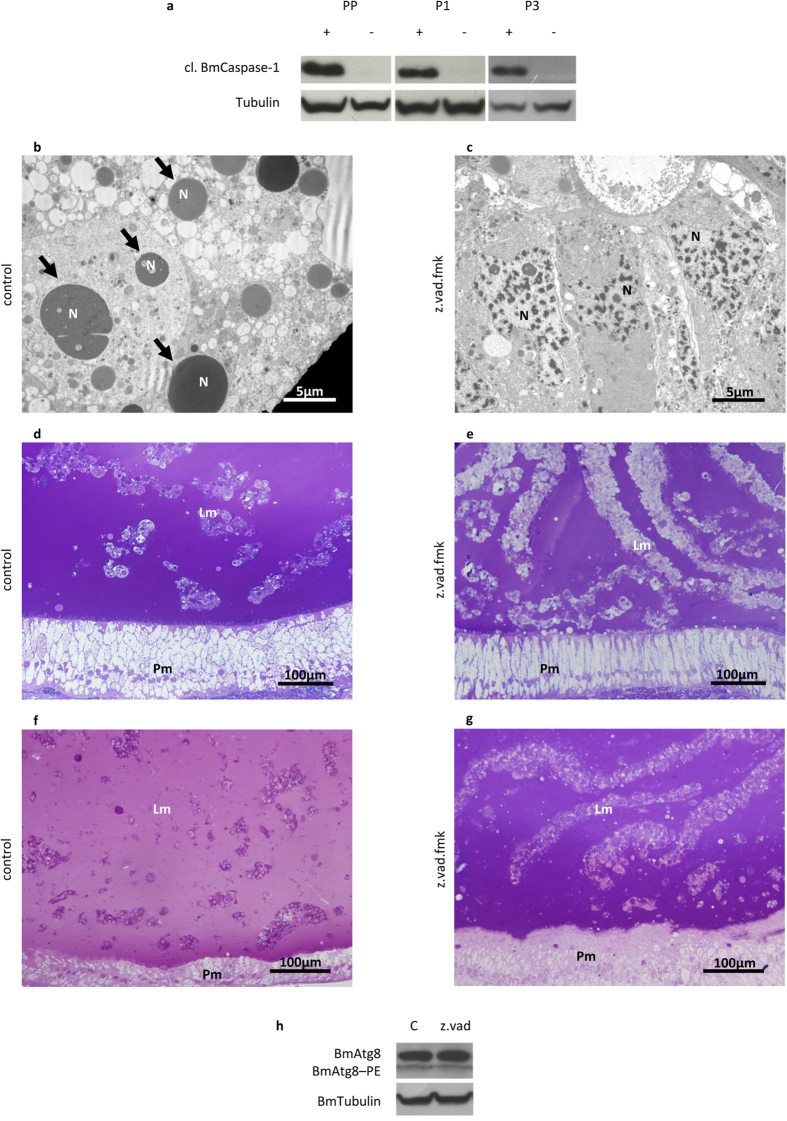
We previously showed that autophagy and apoptosis occur in the removal of the lepidopteran larval midgut during metamorphosis. However, their roles in this context and the molecular pathways underlying their activation and regulation were only hypothesized. The results of the present study better clarify the timing of the activation of these two processes: autophagic and apoptotic genes are transcribed at the beginning of metamorphosis, but apoptosis intervenes after autophagy. To investigate the mechanisms that promote the activation of autophagy and apoptosis, we designed a set of experiments based on injections of 20-hydroxyecdysone (20E). Our data demonstrate that autophagy is induced at the end of the last larval stage by the 20E commitment peak, while the onset of apoptosis occurs concomitantly with the 20E metamorphic peak. By impairing autophagic flux, the midgut epithelium degenerated faster, and higher caspase activity was observed compared to controls, whereas inhibiting caspase activation caused a severe delay in epithelial degeneration. Our data demonstrate that autophagy plays a pro-survival function in the silkworm midgut during metamorphosis, while apoptosis is the major process that drives the demise of the epithelium. The evidence collected in this study seems to exclude the occurrence of autophagic cell death in this setting.
Figures
Similar articles
-
Autophagy precedes apoptosis during the remodeling of silkworm larval midgut.Apoptosis. 2012 Mar;17(3):305-24. doi: 10.1007/s10495-011-0675-0. Apoptosis. 2012. PMID: 22127643
-
The Steroid Hormone 20-Hydroxyecdysone Regulates the Conjugation of Autophagy-Related Proteins 12 and 5 in a Concentration and Time-Dependent Manner to Promote Insect Midgut Programmed Cell Death.Front Endocrinol (Lausanne). 2018 Feb 7;9:28. doi: 10.3389/fendo.2018.00028. eCollection 2018. Front Endocrinol (Lausanne). 2018. PMID: 29467720 Free PMC article.
-
Role of autophagy in midgut stem cells of silkworm Bombyx mori, during larval-pupal metamorphosis.Arch Insect Biochem Physiol. 2021 Sep;108(1):e21832. doi: 10.1002/arch.21832. Epub 2021 Jul 11. Arch Insect Biochem Physiol. 2021. PMID: 34250644
-
Cell death during complete metamorphosis.Philos Trans R Soc Lond B Biol Sci. 2019 Oct 14;374(1783):20190065. doi: 10.1098/rstb.2019.0065. Epub 2019 Aug 26. Philos Trans R Soc Lond B Biol Sci. 2019. PMID: 31438818 Free PMC article. Review.
-
Autophagy-dependent cell death.Cell Death Differ. 2019 Mar;26(4):605-616. doi: 10.1038/s41418-018-0252-y. Epub 2018 Dec 19. Cell Death Differ. 2019. PMID: 30568239 Free PMC article. Review.
Cited by
-
Determination of Key Components in the Bombyx mori p53 Apoptosis Regulation Network Using Y2H-Seq.Insects. 2023 Apr 5;14(4):362. doi: 10.3390/insects14040362. Insects. 2023. PMID: 37103177 Free PMC article.
-
Octanoic Acid-An Insecticidal Metabolite of Conidiobolus coronatus (Entomopthorales) That Affects Two Majors Antifungal Protection Systems in Galleria mellonella (Lepidoptera): Cuticular Lipids and Hemocytes.Int J Mol Sci. 2022 May 6;23(9):5204. doi: 10.3390/ijms23095204. Int J Mol Sci. 2022. PMID: 35563592 Free PMC article.
-
De novo genome assembly of the tobacco hornworm moth (Manduca sexta).G3 (Bethesda). 2021 Jan 18;11(1):jkaa047. doi: 10.1093/g3journal/jkaa047. G3 (Bethesda). 2021. PMID: 33561252 Free PMC article.
-
The buzz in the field: the interaction between viruses, mosquitoes, and metabolism.Front Cell Infect Microbiol. 2023 Apr 26;13:1128577. doi: 10.3389/fcimb.2023.1128577. eCollection 2023. Front Cell Infect Microbiol. 2023. PMID: 37360524 Free PMC article. Review.
-
Cholesterol derivatives induce dephosphorylation of the histone deacetylases Rpd3/HDAC1 to upregulate autophagy.Autophagy. 2021 Feb;17(2):512-528. doi: 10.1080/15548627.2020.1725376. Epub 2020 Feb 12. Autophagy. 2021. PMID: 32013726 Free PMC article.
References
-
- Lockshin R. A. & Williams C. M. Programmed Cell Death–I. Cytology of degeneration in the intersegmental muscles of the pernyi silkmoth. J. Insect Physiol. 11, 123–133 (1965). - PubMed
-
- Lockshin R. A. & Williams C. M. Programmed cell death–V. Cytolytic enzymes in relation to the breakdown of the intersegmental muscles of silkmoths. J. Insect Physiol. 11, 831–844 (1965). - PubMed
-
- Muller F., Adori C. & Sass M. Autophagic and apoptotic features during programmed cell death in the fat body of the tobacco hornworm (Manduca sexta). Eur. J. Cell Biol. 83, 67–78 (2004). - PubMed
-
- Tettamanti G., Grimaldi A., Pennacchio F. & de Eguileor M. Lepidopteran larval midgut during prepupal instar: digestion or self-digestion? Autophagy 3, 630–631 (2007). - PubMed
-
- Tettamanti G. et al.. Programmed cell death and stem cell differentiation are responsible for midgut replacement in Heliothis virescens during prepupal instar. Cell Tissue Res. 330, 345–359 (2007). - PubMed
Publication types
MeSH terms
LinkOut - more resources
Full Text Sources
Other Literature Sources
