

Automated MRI Volumetric Analysis in Patients with Rasmussen Syndrome
- PMID: 27609620
- PMCID: PMC5161540
- DOI: 10.3174/ajnr.A4914
Automated MRI Volumetric Analysis in Patients with Rasmussen Syndrome
Abstract
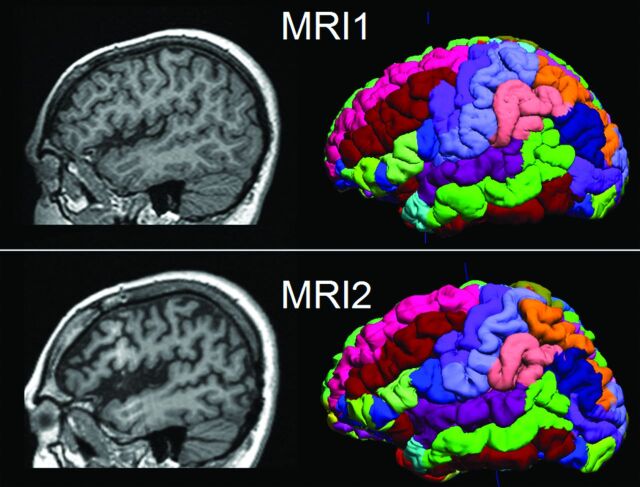
Background and purpose: Rasmussen syndrome, also known as Rasmussen encephalitis, is typically associated with volume loss of the affected hemisphere of the brain. Our aim was to apply automated quantitative volumetric MR imaging analyses to patients diagnosed with Rasmussen encephalitis, to determine the predictive value of lobar volumetric measures and to assess regional atrophy differences as well as monitor disease progression by using these measures.
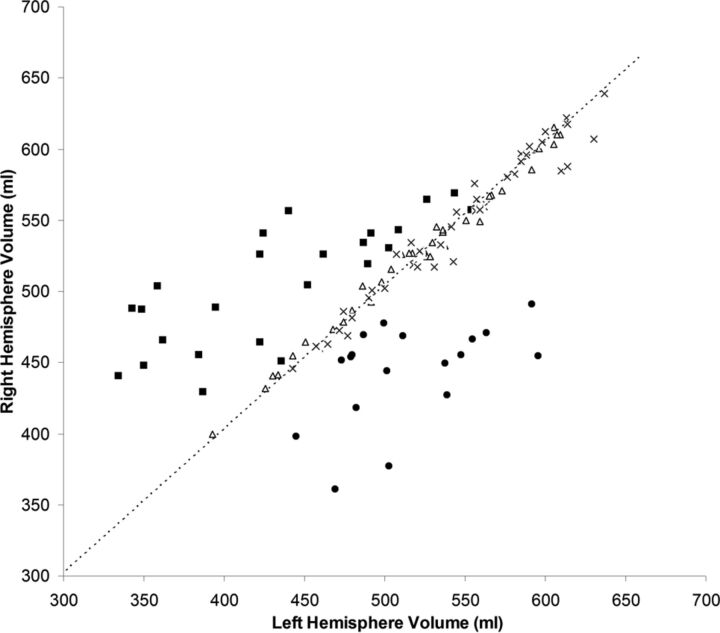
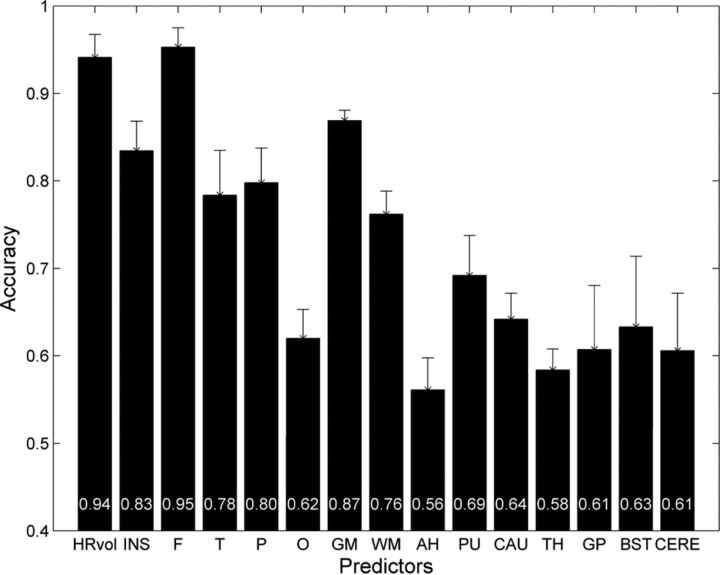
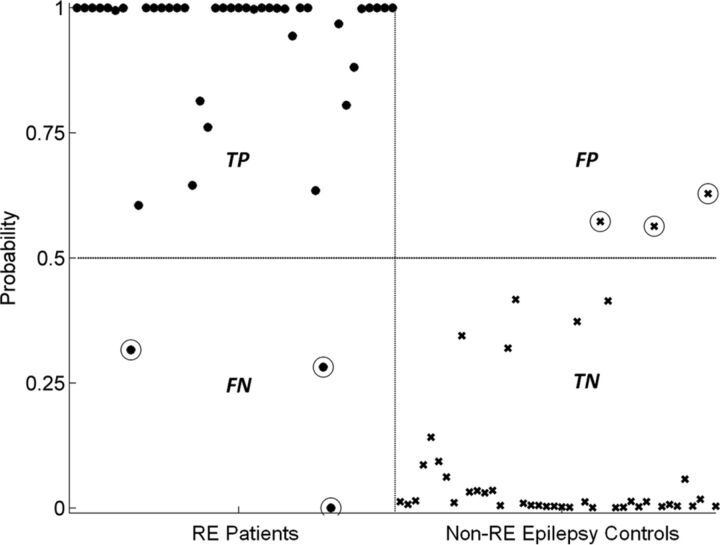
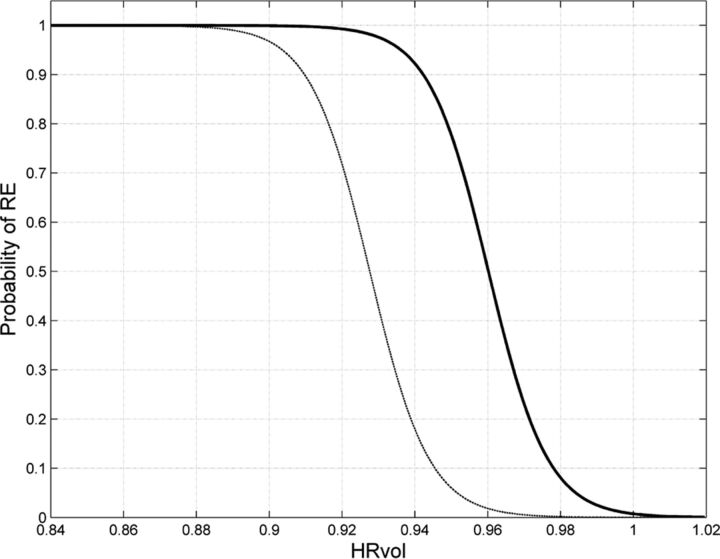
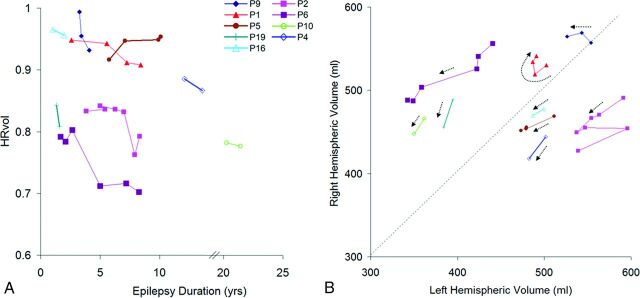
Materials and methods: Nineteen patients (42 scans) with diagnosed Rasmussen encephalitis were studied. We used 2 control groups: one with 42 age- and sex-matched healthy subjects and the other with 42 epileptic patients without Rasmussen encephalitis with the same disease duration as patients with Rasmussen encephalitis. Volumetric analysis was performed on T1-weighted images by using BrainSuite. Ratios of volumes from the affected hemisphere divided by those from the unaffected hemisphere were used as input to a logistic regression classifier, which was trained to discriminate patients from controls. Using the classifier, we compared the predictive accuracy of all the volumetric measures. These ratios were used to further assess regional atrophy differences and correlate with epilepsy duration.
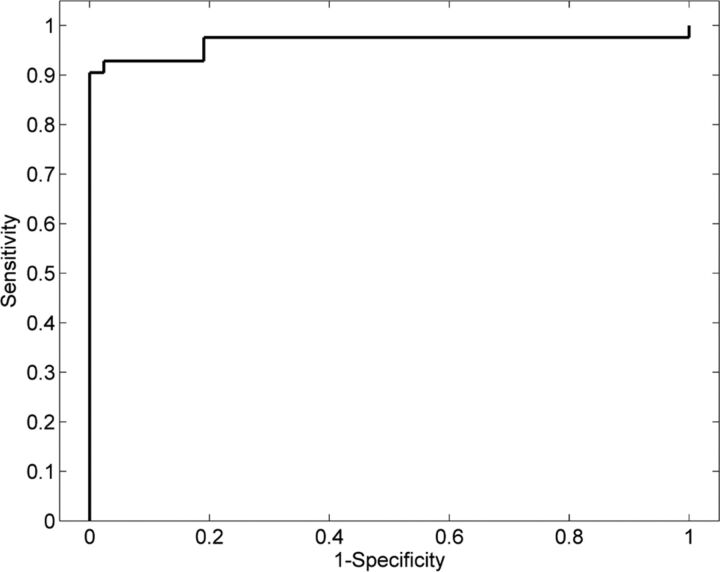
Results: Interhemispheric and frontal lobe ratios had the best prediction accuracy for separating patients with Rasmussen encephalitis from healthy controls and patient controls without Rasmussen encephalitis. The insula showed significantly more atrophy compared with all the other cortical regions. Patients with longitudinal scans showed progressive volume loss in the affected hemisphere. Atrophy of the frontal lobe and insula correlated significantly with epilepsy duration.
Conclusions: Automated quantitative volumetric analysis provides accurate separation of patients with Rasmussen encephalitis from healthy controls and epileptic patients without Rasmussen encephalitis, and thus may assist the diagnosis of Rasmussen encephalitis. Volumetric analysis could also be included as part of follow-up for patients with Rasmussen encephalitis to assess disease progression.
© 2016 by American Journal of Neuroradiology.
Figures
Similar articles
-
Automated 3D MRI volumetry reveals regional atrophy differences in Rasmussen encephalitis.Epilepsia. 2012 Apr;53(4):613-21. doi: 10.1111/j.1528-1167.2011.03396.x. Epub 2012 Feb 6. Epilepsia. 2012. PMID: 22309137
-
MRI volumetric analysis in rasmussen encephalitis: a longitudinal study.Epilepsia. 2003 Feb;44(2):247-51. doi: 10.1046/j.1528-1157.2003.16202.x. Epilepsia. 2003. PMID: 12558582
-
Morphometric MRI findings challenge the concept of the "unaffected" hemisphere in Rasmussen encephalitis.Epilepsia. 2019 May;60(5):e40-e46. doi: 10.1111/epi.14702. Epub 2019 Apr 8. Epilepsia. 2019. PMID: 30957874
-
Rethinking the Magnetic Resonance Imaging Findings in Early Rasmussen Encephalitis: A Case Report and Review of the Literature.Pediatr Neurol. 2016 Jun;59:85-9. doi: 10.1016/j.pediatrneurol.2015.12.004. Epub 2015 Dec 19. Pediatr Neurol. 2016. PMID: 27004940 Review.
-
Rasmussen encephalitis with dual pathology in a patient without seizures: case report and literature review.Childs Nerv Syst. 2015 Nov;31(11):2165-71. doi: 10.1007/s00381-015-2757-8. Epub 2015 Jun 2. Childs Nerv Syst. 2015. PMID: 26033376 Review.
Cited by
-
Rasmussen's encephalitis: structural, functional, and clinical correlates of contralesional epileptiform activity.J Neurol. 2024 Oct;271(10):6680-6691. doi: 10.1007/s00415-024-12607-7. Epub 2024 Aug 14. J Neurol. 2024. PMID: 39138652 Free PMC article.
-
Acute seizure risk in patients with encephalitis: development and validation of clinical prediction models from two independent prospective multicentre cohorts.BMJ Neurol Open. 2022 Sep 5;4(2):e000323. doi: 10.1136/bmjno-2022-000323. eCollection 2022. BMJ Neurol Open. 2022. PMID: 36110928 Free PMC article.
-
Globally altered microstructural properties and network topology in Rasmussen's encephalitis.Brain Commun. 2023 Nov 1;5(6):fcad290. doi: 10.1093/braincomms/fcad290. eCollection 2023. Brain Commun. 2023. PMID: 37953836 Free PMC article.
-
Diagnosis of early mild cognitive impairment using a multiobjective optimization algorithm based on T1-MRI data.Sci Rep. 2022 Jan 19;12(1):1020. doi: 10.1038/s41598-022-04943-3. Sci Rep. 2022. PMID: 35046444 Free PMC article.
-
A FastSurfer Database for Age-Specific Brain Volumes in Healthy Children: A Tool for Quantifying Localized and Global Brain Volume Alterations in Pediatric Patients.Brain Behav. 2025 Jul;15(7):e70689. doi: 10.1002/brb3.70689. Brain Behav. 2025. PMID: 40685764 Free PMC article.
References
MeSH terms
Grants and funding
LinkOut - more resources
Full Text Sources
Other Literature Sources
Medical