

Review
doi: 10.1158/1078-0432.CCR-16-0159.
Epub 2016 Sep 8.
Imaging Tumor Metabolism to Assess Disease Progression and Treatment Response
Affiliations
- PMID: 27609841
- PMCID: PMC5321522
- DOI: 10.1158/1078-0432.CCR-16-0159
Item in Clipboard
Review
Imaging Tumor Metabolism to Assess Disease Progression and Treatment Response
Clin Cancer Res.
.
Abstract
Changes in tumor metabolism may accompany disease progression and can occur following treatment, often before there are changes in tumor size. We focus here on imaging methods that can be used to image various aspects of tumor metabolism, with an emphasis on methods that can be used for tumor grading, assessing disease progression, and monitoring treatment response. Clin Cancer Res; 22(21); 5196-203. ©2016 AACR.
©2016 American Association for Cancer Research.
Conflict of interest statement
No potential conflicts of interest were disclosed.
Figures
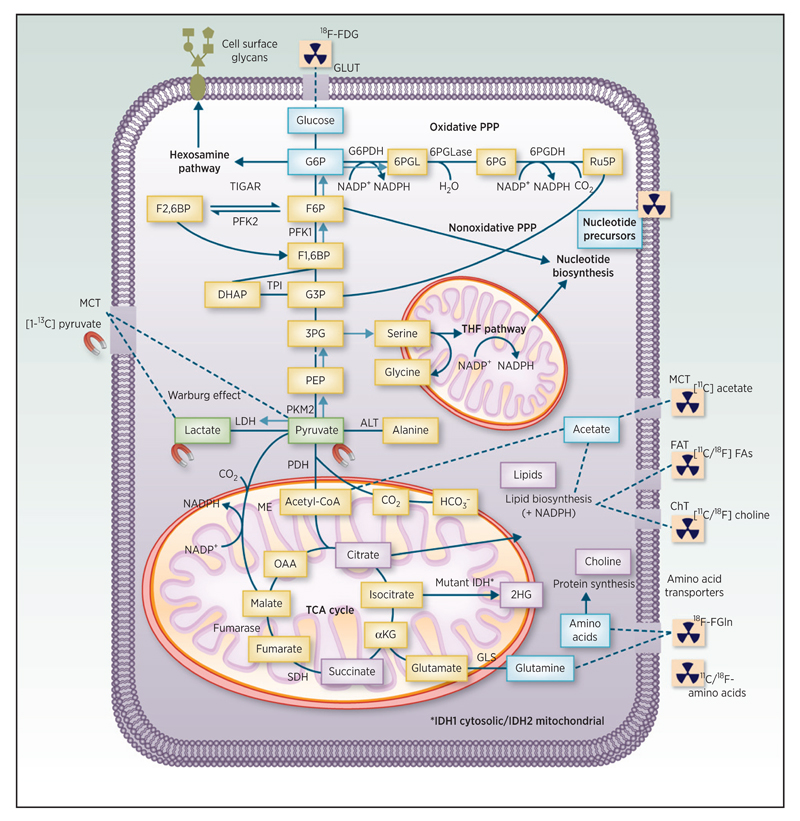
Clinical imaging of cancer metabolism. Many cancer cells metabolize glucose preferentially to lactate, even in the presence of oxygen (the Warburg effect). Glucose is taken up on the glucose transporters (GLUT), while pyruvate and lactate enter cells through the monocarboxylate transporters (MCT). The PPP is linked to glycolysis via glucose 6-phosphate (G6P), which is oxidized by glucose 6-phosphate dehydrogenase (G6PDH). Flux into the oxidative arm of the PPP is promoted by TIGAR. Serine and glycine can be produced from 3-phosphoglycerate (3PG), and both amino acids can fuel the THF pathway. Glutamine is deamidated by glutaminase (GLS), which can yield NADPH via NADP+-dependent malic enzyme (ME, EC 1.1.1.40) activity. NADPH generated from the oxidative PPP, ME flux, and the THF pathway is used for lipid biosynthesis and redox balance, whereas; intermediates from the nonoxidative PPP and the THF pathway are used for nucleic acid synthesis. Mutant isocitrate dehydrogenase (IDH) in the TCA cycle generates the “oncometabolite” 2-hydroxyglutarate (2HG). IDH1 in the cytosol is mutated in most grade II/III gliomas, whereas IDH2 in the mitochondria is less commonly mutated. The hexosamine pathway branches off from glycolysis at G6P and produces substrates for cell surface glycosylation. Imaging agents that are used clinically and explore some of the aforementioned metabolic features of tumors are shown in blue (PET tracers), green (hyperpolarized substrates), and purple (metabolites detectable by 1H-MRS). Abbreviations: 18F-FDG, 2-[18F]fluoro-2-deoxy-D-glucose; 18F-FGln, 18F-(2S,4R)4-fluoroglutamine; 6PG, 6-phosphogluconate; 6PGDH, 6-phosphogluconate dehydrogenase; 6PGL, 6-phosphogluconolactone; 6PGLase, 6-phosphogluconolactonase; αKG, α-ketoglutarate; ALT, alanine aminotransferase; ChT, choline transporter; DHAP, dihydroxyacetone phosphate; F1,6BP, fructose 1,6-bisphosphate; F2,6BP, fructose 2,6-bisphosphate; FA, fatty acid; G3P, glyceraldehyde 3-phosphate; LDH, lactate dehydrogenase; OAA, oxaloacetate; PEP, phosphoenolpyruvate; PFK1/2, phosphofructokinase 1/2; Ru5P, ribulose 5-phosphate; SDH, succinate dehydrogenase; TPI, triosephosphate isomerase.
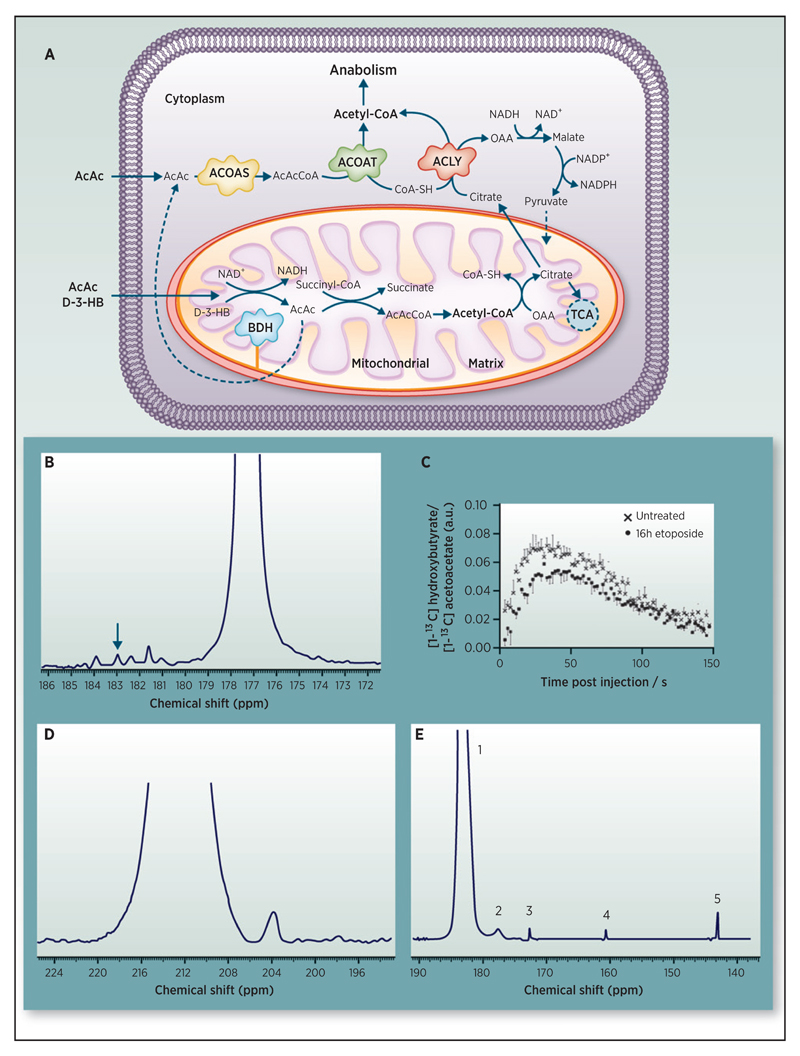
Assessing ketone body metabolism with hyperpolarized 13C-labeled cell substrates. A, metabolism of the ketone bodies acetoacetate and D-3-hydroxybutyrate. B, spectrum showing the resonances observed 30 seconds after injection of hyperpolarized [1,3-13C2]acetoacetate at a final concentration of 15 mmol/L, into an EL4 murine lymphoma cell suspension (108 cells). Unlabeled D-3-hydroxybutyrate was added in an equimolar amount. There are resonances from C1 [1,3-13C2]acetoacetate at 177.3 ppm and D-3-[1-13C]hydroxybutyrate at 183.0 ppm (indicated by the arrow). C, labeling of D-3-hydroxybutyrate decreased after the cells were treated with etoposide for 16 hours (h; unpublished data). D, injection of hyperpolarized [1,3-13C2]acetoacetate in vivo. The spectrum was obtained by summing the first 30 seconds of nonlocalized spectra, where the surface coil was placed directly over the heart/liver region (58). The peak at approximately 212 ppm is C3 [1,3-13C2]acetoacetate. The spectrum also shows a resonance at approximately 204 ppm, which is most likely from [1-13C]acetyl-CoA. E, representative spectrum obtained by summing the first 30 seconds of data acquired following administration of 0.2 mL of 60 mmol/L hyperpolarized DL-[1,3-13C2, 3-2H]-3-hydroxybutyric acid to a nontumor-bearing mouse via a tail vein catheter, where the surface coil was placed directly over the heart/liver region. The observed resonances correspond to: (i) C1 DL-3-[1,3-13C2, 3-2H1]hydroxybutyrate (183.0 ppm); (ii) [1-13C]acetoacetate (177.3 ppm); (iii) [1-13C]pyruvate (172.8 ppm); (iv) 13C bicarbonate (161.3 ppm); and (v) an unknown metabolite (144.9 ppm; ref. 53). AcAc, acetoacetate; BDH, D-3 hydroxybutyrate dehydrogenase; D-3-HB, D-3-hydroxybutyrate; OAA, oxaloacetate; AcAcCoA, acetoacetyl CoA; ACOAS, acetyl-CoA synthetase; ACOAT, acetyl-CoA thiolase; ACYL, ATP-citrate lyase.
References
-
- Hanahan D, Weinberg RA. Hallmarks of cancer: the next generation. Cell. 2011;144:646–74. - PubMed
Publication types
MeSH terms
Grants and funding
LinkOut - more resources
Full Text Sources
Other Literature Sources
