. 2016 Sep 9;353(6304):1123-9.
doi: 10.1126/science.aag0821.

Identification of an elaborate complex mediating postsynaptic inhibition

Affiliations

Identification of an elaborate complex mediating postsynaptic inhibition

Akiyoshi Uezu et al. Science. .

Abstract

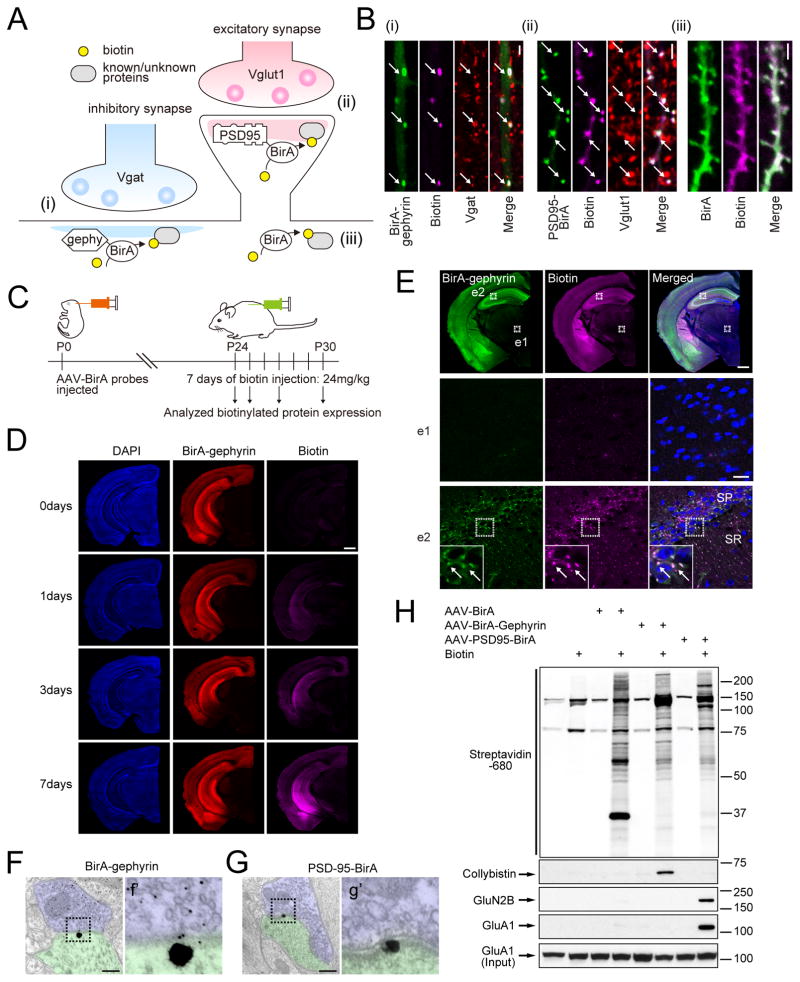
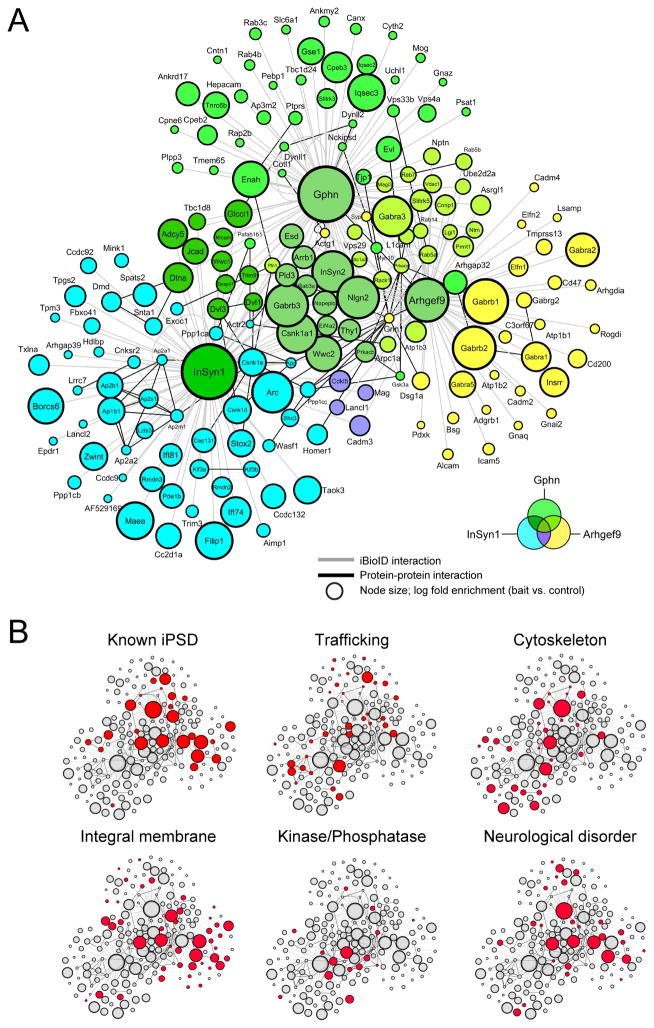
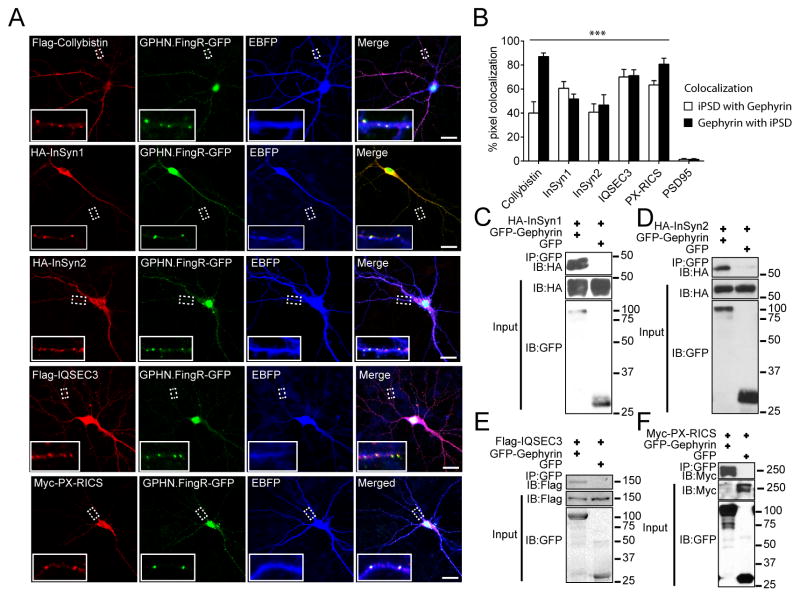
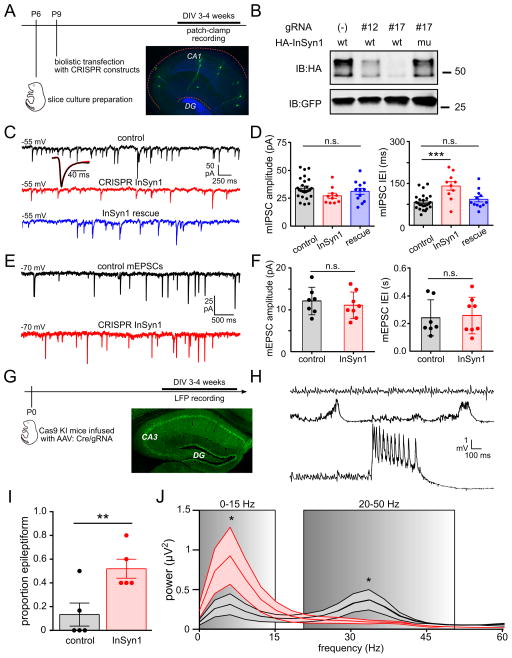
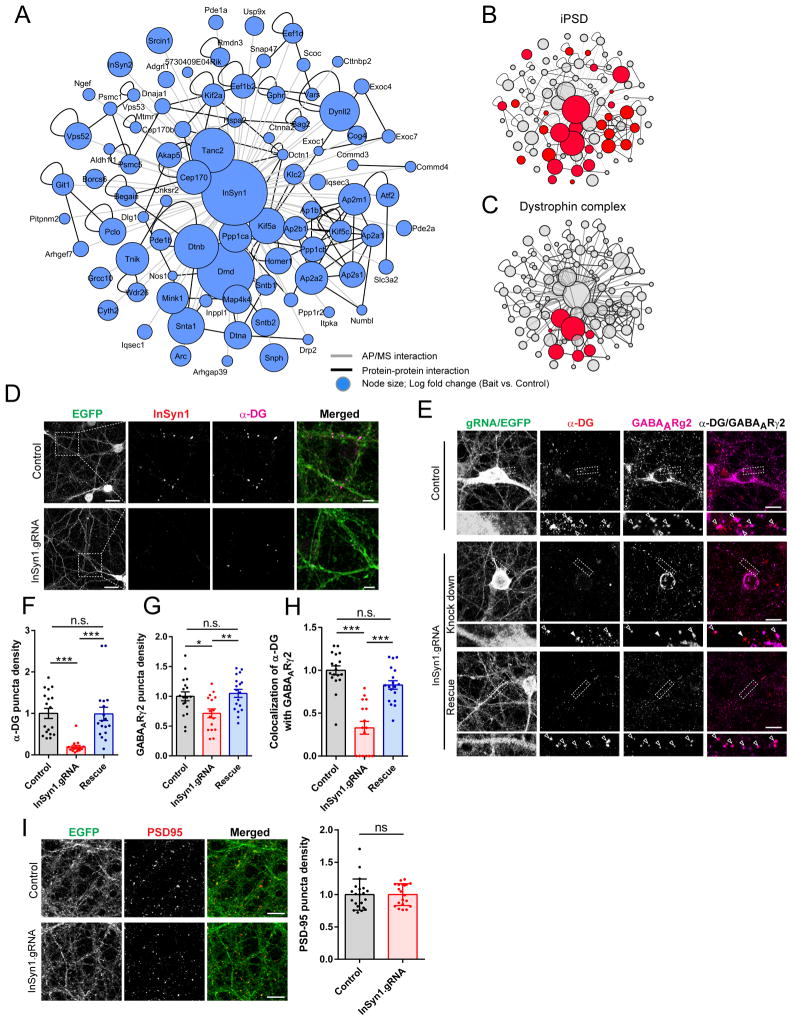
Inhibitory synapses dampen neuronal activity through postsynaptic hyperpolarization. The composition of the inhibitory postsynapse and the mechanistic basis of its regulation, however, remain poorly understood. We used an in vivo chemico-genetic proximity-labeling approach to discover inhibitory postsynaptic proteins. Quantitative mass spectrometry not only recapitulated known inhibitory postsynaptic proteins but also revealed a large network of new proteins, many of which are either implicated in neurodevelopmental disorders or are of unknown function. Clustered regularly interspaced short palindromic repeats (CRISPR) depletion of one of these previously uncharacterized proteins, InSyn1, led to decreased postsynaptic inhibitory sites, reduced the frequency of miniature inhibitory currents, and increased excitability in the hippocampus. Our findings uncover a rich and functionally diverse assemblage of previously unknown proteins that regulate postsynaptic inhibition and might contribute to developmental brain disorders.


Figures

Fig. 1
Fig. 1. Development of iBioID for synaptic proteomics
(A) Schematic of the iBioID approach for synapses. (B) Validation of BirA constructs in hippocampal slice using (i) BirA-gephyrin and (ii) PSD-95-BirA (white arrows point to colocalized puncta). (iii) BirA alone non-specifically labels proteins. Scale bar, 2 μm. (C) Outline of iBioID method in mice. (D) Successful biotinylation of proteins in vivo following i.p. biotin administration. Scale bar, 0.5 mm (E) Biotinylation is specific to regions expressing BirA-gephyrin (coronal section). Insets from thalamus (e1) and hippocampus (e2) and insets of e2 are shown. Scale bar top panel, 0.5 mm; e1 and e2, 20 μm. Electron micrographs verify enrichment of biotinylation at (F, f′) inhibitory or (G, g′) excitatory PSD substructures. Large gold beads, streptavidin labeling; small gold beads, immunolabel for GABA. Scale bar, 250 nm. (H) Specific purification of known PSD proteins for each BirA fusion protein.
Fig. 2
Fig. 2. Scale-free graph of the iPSD proteome
(A) InSyn1 (blue), gephyrin (green), and arhgef9 (yellow) BirA-dependent iBioID identifies a rich network of known and previously unknown proteins enriched at the iPSD. Node titles correspond to gene name; size represents fold-enrichment over negative control. Edges are shaded according to the types of interactions (grey, iBioID; black, protein-protein interactions previously reported). (B) Clustergram topology of iPSD proteins (red) in selected functional categories.
Fig. 3
Fig. 3. Validation of selected iPSD proteins
(A) Co-localization of iPSD proteins (left column) with endogenous gephyrin (right column) in hippocampal neurons. Scale bar, 10 μm. (B) Each iPSD protein significantly co-localizes with gephyrin in dendrites compared to PSD95 (n > 9 dendritic ROIs). (C–F) iPSD proteins co-immunoprecipitate with gephyrin when co-expressed in HEK293 cells. ***p<0.001 one-way ANOVA followed by Dunnett’s multiple comparisons test (B). Error bars ± SEM.
Fig. 4
Fig. 4. Abnormal synaptic inhibition follows loss of the iPSD protein InSyn1
(A) Experimental schematic for panels C–F. (B) Validation of InSyn1 gRNAs (#12 & #17) and rescue constructs by 293T co-transfection and immunoblotting. (C, D) GABAA-dependent miniature inhibitory postsynaptic currents (GABAA mIPSCs) recorded from CA1 pyramidal cells. Inset shows GABAA mIPSC waveform averages. InSyn1 depletion did not alter mIPSC kinetics (rise: control = 3.6 ± 0.6 ms, InSyn1 = 3.4 ± 0.6 ms, p = 0.51; decay: control = 9.7 ± 2.1 ms, InSyn1 = 10.3 ± 1.8 ms, p = 0.42). IEIs of InSyn1-depleted GABAA mIPSCs (red) are specifically increased compared to control (black) and rescue (blue) neurons. (E, F) AMPAR-dependent miniature EPSCs are not altered in InSyn1 depleted neurons. (G) Time-line schematic for local field potential (LFP) recordings in acute slices from Cas9 knock-in (KI) mice infected with AAV:Cre/Insyn1 gRNA. Image shows representative extent of AAV infection in hippocampus. (H) Representative LFP activities recorded in hippocampal area CA3 in the presence of 10 μM carbachol to model “awake state” gamma rhythm. Top trace: pure 30–40 Hz gamma oscillation; middle trace: 3–5 Hz spike-wave discharges; bottom trace: ictal-like burst – the latter two indicative of hyperexcitable or epileptiform activity. (I) InSyn1 gRNA expressing slices exhibit increased epileptiform activity. (J) Averaged power spectra showing signal energy in the InSyn1 gRNA expressing slices is increased in the 0–15 Hz frequency band and decreased in the 20–50 Hz frequency bands. *p<0.05, **p<0.01, ***p<0.001, n.s. = not statistically significant. Error bars ±SEM.
Fig. 5
Fig. 5. InSyn1 functionally associates with the dystrophin complex at the iPSD
(A) Network analysis of affinity purified InSyn1-GFP proteome from mouse brain. (B, C) Clustergram topologies of InSyn1 associated proteins in selected functional categories. (D) Co-localization of InSyn1 with α-dystroglycan (α-DG) is diminished after depleting InSyn1 with Cas9 conditional knock-in hippocampal neurons infected with AAV:Cre/Insyn1 gRNA. Scale bar, 10 μm. (E) InSyn1 is essential for GABAAR and α-DG cluster density. Cas9 KI hippocampal neurons were stained for GABAARγ2 and α-DG following infection with control AAV:Cre/(-)gRNA (top panel, Control); AAV:Cre/Insyn1 gRNA (middle panel, Knockdown), or AAV:Cre/Insyn1 gRNA, and transfected with InSyn1 gRNA resistant plasmid (bottom panels, Rescue). Insets show higher magnification regions with open (colocalized puncta) and closed (non-colocalized puncta) arrows. (F, H) Quantification of α-DG and GABAARγ2 puncta co-localization or density (n=16–18). *p<0.05, **p<0.01, ***p<0.001 one-way ANOVA followed by Tukey’s multiple comparisons test (F–H). Error bars ± SEM. Scale bar, 10 μm. (I) Loss of InSyn1 does not alter PSD-95 puncta density. Cas9 knock-in hippocampal neurons infected with AAV:Cre/Insyn1 gRNA were stained with PSD-95 and quantified (n = 18–20 neurons). n.s = not significant, two-tailed t-test (I).

References

    1. Gray EG. Axo-somatic and axo-dendritic synapses of the cerebral cortex: an electron microscope study. Journal of anatomy. 1959;93:420–433. - PMC - PubMed
    1. Malenka RC, Bear MF. LTP and LTD: an embarrassment of riches. Neuron. 2004;44:5–21. - PubMed
    1. Kennedy MB, Beale HC, Carlisle HJ, Washburn LR. Integration of biochemical signalling in spines. Nat Rev Neurosci. 2005;6:423–434. - PubMed
    1. Grant SG. Synaptopathies: diseases of the synaptome. Curr Opin Neurobiol. 2012;22:522–529. - PubMed
    1. Volk L, Chiu SL, Sharma K, Huganir RL. Glutamate synapses in human cognitive disorders. Annu Rev Neurosci. 2015;38:127–149. - PubMed

Publication types