. 2016 Sep 9;353(6304):1161-5.
doi: 10.1126/science.aaf5171.

Tissue of origin dictates branched-chain amino acid metabolism in mutant Kras-driven cancers

Affiliations

Tissue of origin dictates branched-chain amino acid metabolism in mutant Kras-driven cancers

Jared R Mayers et al. Science. .

Abstract

Tumor genetics guides patient selection for many new therapies, and cell culture studies have demonstrated that specific mutations can promote metabolic phenotypes. However, whether tissue context defines cancer dependence on specific metabolic pathways is unknown. Kras activation and Trp53 deletion in the pancreas or the lung result in pancreatic ductal adenocarinoma (PDAC) or non-small cell lung carcinoma (NSCLC), respectively, but despite the same initiating events, these tumors use branched-chain amino acids (BCAAs) differently. NSCLC tumors incorporate free BCAAs into tissue protein and use BCAAs as a nitrogen source, whereas PDAC tumors have decreased BCAA uptake. These differences are reflected in expression levels of BCAA catabolic enzymes in both mice and humans. Loss of Bcat1 and Bcat2, the enzymes responsible for BCAA use, impairs NSCLC tumor formation, but these enzymes are not required for PDAC tumor formation, arguing that tissue of origin is an important determinant of how cancers satisfy their metabolic requirements.


Figures

Fig. 1
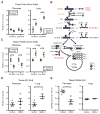
Fig. 1. Mice with NSCLC display increased BCAA uptake and metabolism
(A and C–E) Mice were fed 13C-BCAA containing diet for seven days. (A) Relative ion counts by LC-MS analysis of fully-labeled, free BCAAs in tumors from PDAC and NSCLC mice and normal tissues from their respective control mice. Data are presented as mean ± SEM. N = 4 control and N = 4 PDAC; N = 4 control and N = 4 NSCLC. (B) Diagram of the leucine catabolic pathway. Red labels indicate metabolites measured by mass spectrometry. Blue circles indicate 13C-labeled carbons. KIC = α-ketoisocaproate. (C) Relative ion counts by GC-MS analysis of fully-labeled BCAAs from protein acid hydrolysates of tumors from PDAC and NSCLC mice and normal tissues from their respective control mice. Data are presented as mean ± SEM. N = 4 control and N = 4 PDAC; N = 4 control and N = 4 NSCLC. (D) Relative ion counts by LC-MS analysis of fully-labeled KIC in tumors from PDAC and NSCLC mice and normal tissues from their respective control mice. Data are presented as mean ± SEM. N = 4 control and N = 4 PDAC; N = 4 control and N = 4 NSCLC. (E) Citrate M+2 labeling (%) from [U-13C]-leucine by GC-MS analysis in tumors from PDAC and NSCLC mice and normal tissues from their respective control mice. Data are presented as mean ± SEM. N = 4 control and N = 4 PDAC; N = 4 control and N = 4 NSCLC. Two-tailed t test was used for all comparisons between two groups. * P<0.05, ** P<0.01, *** P<0.001
Fig. 2
Fig. 2. BCAA-Derived Nitrogen Supports Non-Essential Amino Acid and DNA Synthesis in NSCLC tumors
(A) Diagram of leucine transamination by Branched-chain amino acid transferase (Bcat) and nitrogen (green circles) fate after transamination. (B–D) NSCLC mice were fed 15N-leucine containing diet for six days. (B) Relative ion counts by GC-MS analysis of M+1 labeled amino acids in plasma of control and NSCLC mice. Data are presented as mean ± SEM. N = 5 control and N = 6 NSCLC. (C) Relative ion counts by GC-MS analysis of M+1 labeled amino acids from protein acid hydrolysates of control mouse lung tissue and NSCLC mouse tumors. Data are presented as mean ± SEM. N = 6 control and N = 6 NSCLC. (D) M+1 labeling (%) from 15N-leucine of deoxynucleic acids from nucleic acid digest of control mouse lung tissue and NSCLC mouse tumors. Data are presented as mean ± SEM. N = 6 control and N = 6 NSCLC. Two-tailed t test was used for all comparisons between two groups. * P<0.05, ** P<0.01, *** P<0.001
Fig. 3
Fig. 3. Gene expression in both mouse and human tumors reflects tumor tissue-specific BCAA metabolism
(A) Relative Expression of BCAA metabolic pathway genes in normal lung and NSCLC tumors from KP mice. Data are presented as mean ± SEM. N = 6 control and N = 6 NSCLC. (B) Relative expression of BCAA metabolic pathway genes in normal pancreas and PDAC tumors from KP mice. Data are presented as mean ± SEM. N = 7 control and N = 5 PDAC. (C) Immunoblots of proteins involved in BCAA metabolism in representative normal lung and NSCLC tumors (left) and representative normal pancreas and PDAC tumors (right) from KP mice. (D) Quantification of (C). Data are presented as mean ± SEM. N = 6 control and N = 6 NSCLC; N = 4 control and N = 4 PDAC. (E) Comparison of BCAA metabolic pathway gene expression in human NSCLC and PDAC tumors relative to their adjacent paired normal tissues. Overall expression of BCAA metabolism genes is significantly decreased in PDAC (P<0.0001). Two-tailed t test was used for all comparisons between two groups unless otherwise stated. * P<0.05, ** P<0.01, *** P<0.001
Fig. 4
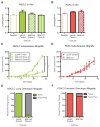
Fig. 4. Branched-chain amino acid transaminase (Bcat) activity is required for NSCLC tumor growth
(A) Doubling time of parental, control CRISPR-Cas9 vector infected (pLenti), and NSCLC Bcat null cell lines in vitro. Data are presented as mean ± SEM. N = 3 per group. Representative experiment from ≥ 2 repeats. (B) Doubling time of parental, control CRISPR-Cas9 vector infected and PDAC Bcat null cell lines in vitro. Data are presented as mean ± SEM. N = 3 per group. Representative experiment from ≥ 2 repeats. (C) Estimated tumor volume (mm3) of subcutaneous allograft of control infected and Bcat null syngenic NSCLC cell lines into C57BL/6J mice. Data are presented as mean ± SEM. N = 6 per group. Two-way repeated measures ANOVA used for comparison between groups. (D) Estimated tumor volume (mm3) of subcutaneous allograft of control infected and Bcat null syngenic PDAC cell lines into C57BL/6J mice. Data are presented as mean ± SEM. N = 5 pLenti control and N = 6 Bcat null. Two-way repeated measures ANOVA used for comparison between groups. (E) Lung orthotopic allograft of control infected and Bcat null syngenic NSCLC cell lines into C57BL/6J mice. N = 23 vector control and N = 13 Bcat null Clone A. (F) Pancreatic orthotopic allograft of control infected and Bcat null syngenic PDAC cell lines into C57BL/6J mice. N = 8 per group. * P<0.05, ** P<0.01, *** P<0.001.

Comment in

Similar articles

Cited by

References

    1. Garraway LA. Genomics-driven oncology: framework for an emerging paradigm. J Clin Oncol. 2013;31:1806–1814. - PubMed
    1. Vasan N, Boyer JL, Herbst RS. A RAS renaissance: emerging targeted therapies for KRAS-mutated non-small cell lung cancer. Clinical cancer research : an official journal of the American Association for Cancer Research. 2014;20:3921–3930. - PMC - PubMed
    1. Muller PA, Vousden KH. Mutant p53 in cancer: new functions and therapeutic opportunities. Cancer Cell. 2014;25:304–317. - PMC - PubMed
    1. Boroughs LK, DeBerardinis RJ. Metabolic pathways promoting cancer cell survival and growth. Nat Cell Biol. 2015;17:351–359. - PMC - PubMed
    1. White E. Exploiting the bad eating habits of Ras-driven cancers. Genes & Development. 2013;27:2065–2071. - PMC - PubMed

Publication types

MeSH terms