. 2016 Sep 8;166(6):1397-1410.e16.
doi: 10.1016/j.cell.2016.08.020.

Domestication and Divergence of Saccharomyces cerevisiae Beer Yeasts

Affiliations

Domestication and Divergence of Saccharomyces cerevisiae Beer Yeasts

Brigida Gallone et al. Cell. .

Abstract

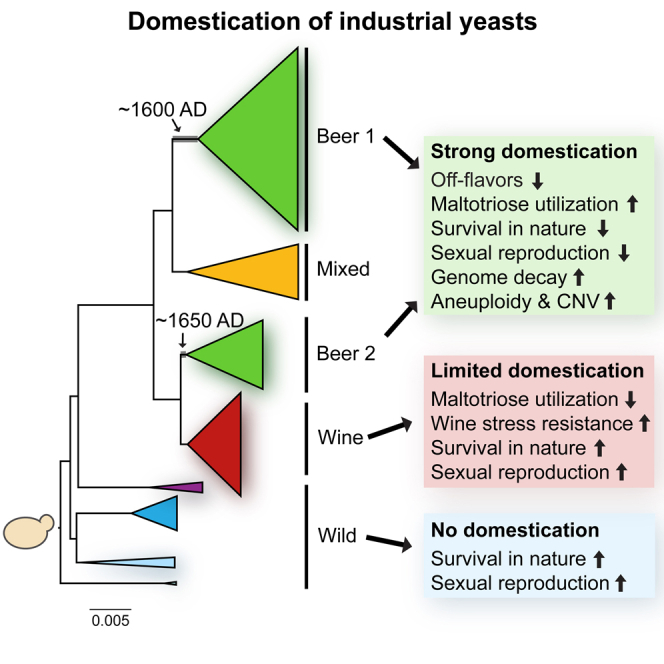
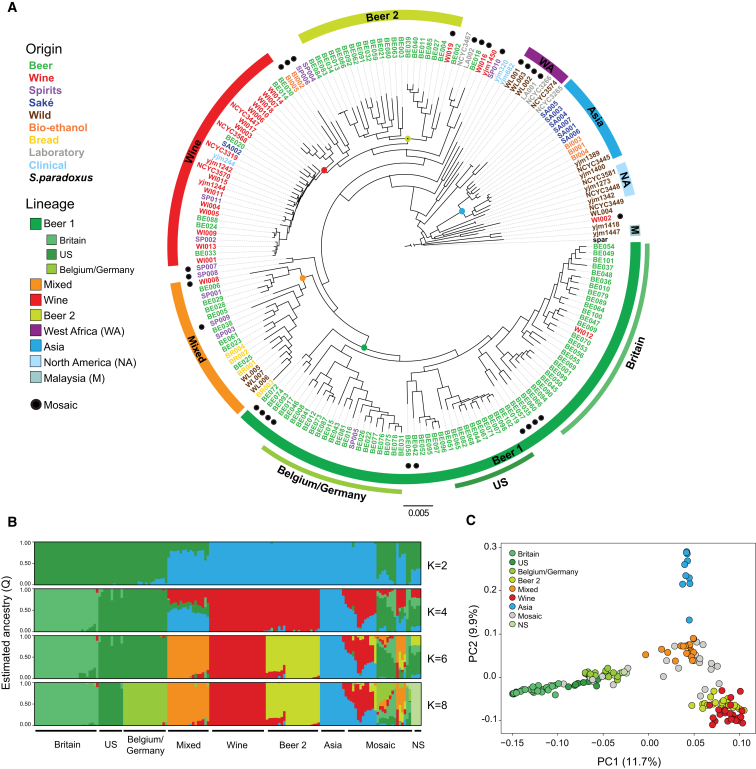
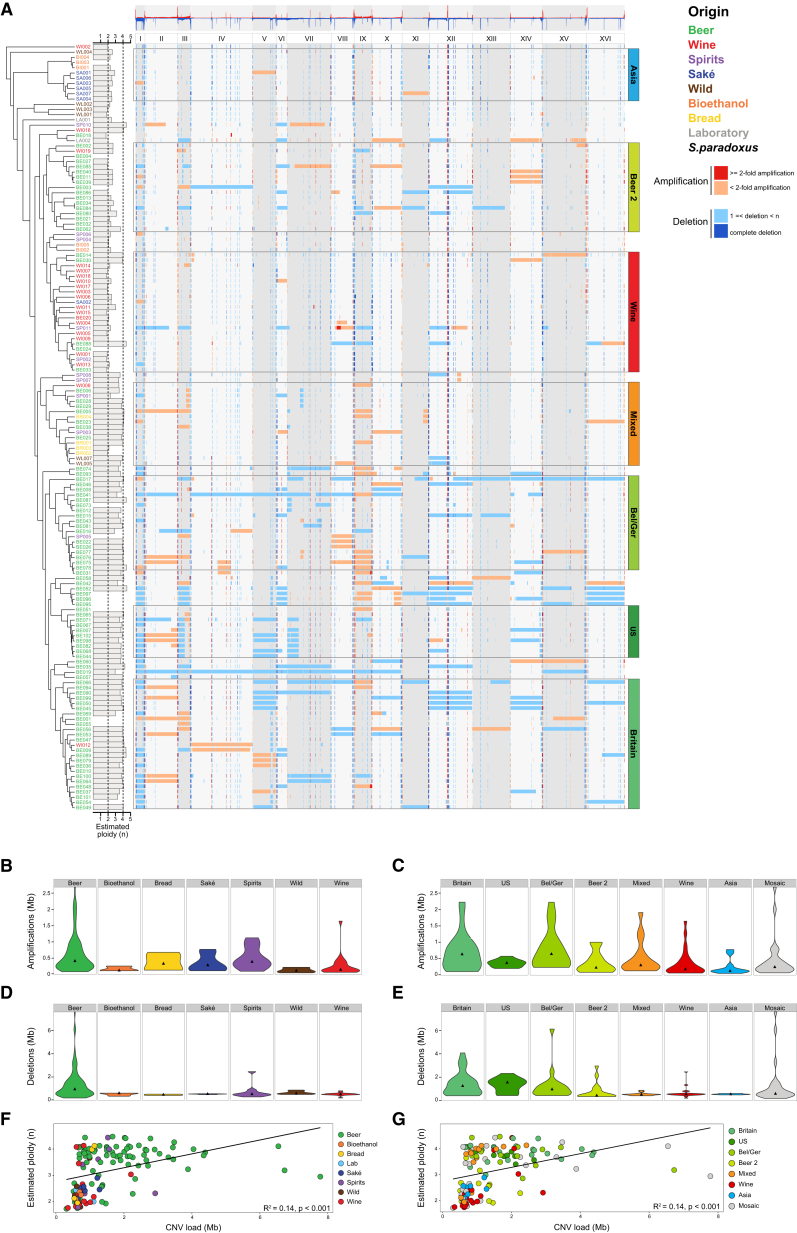
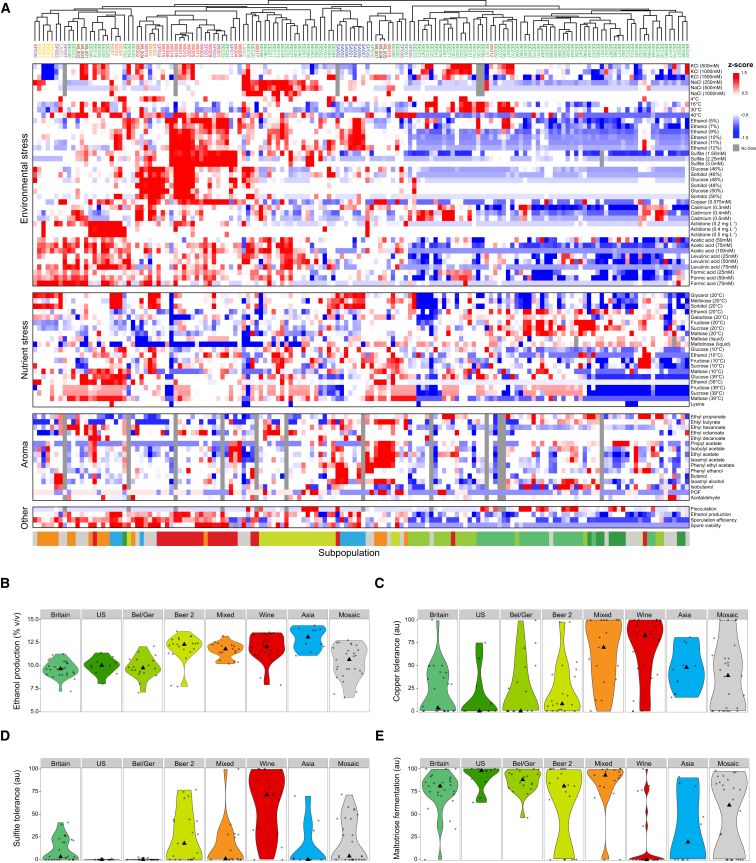
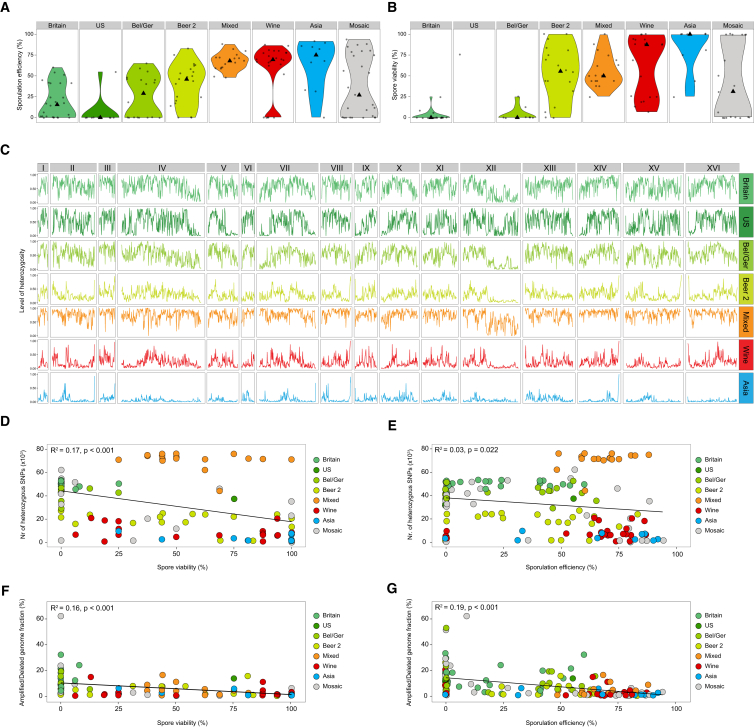
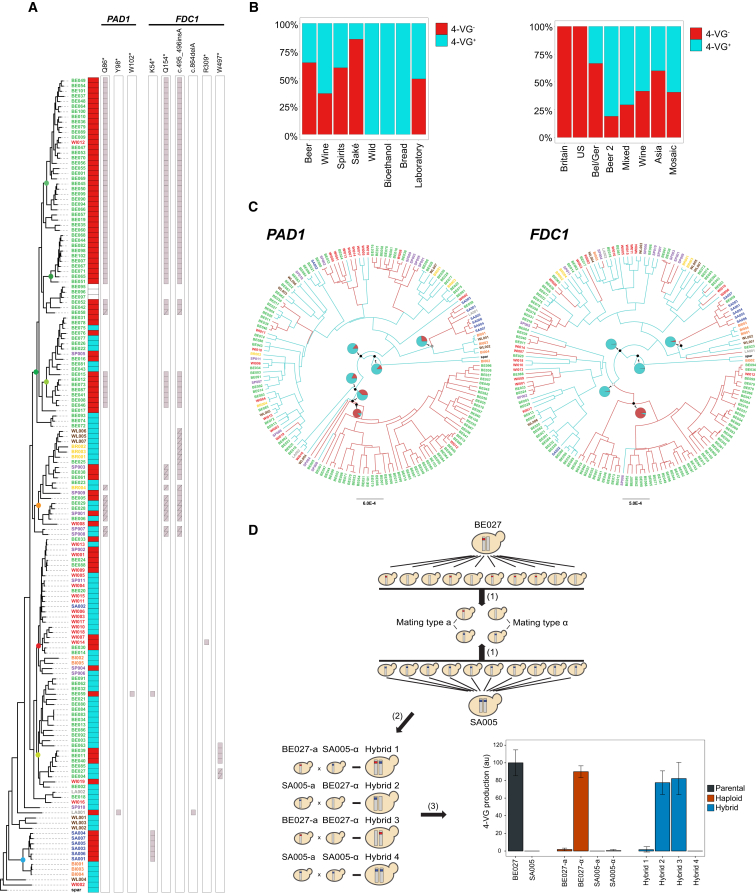
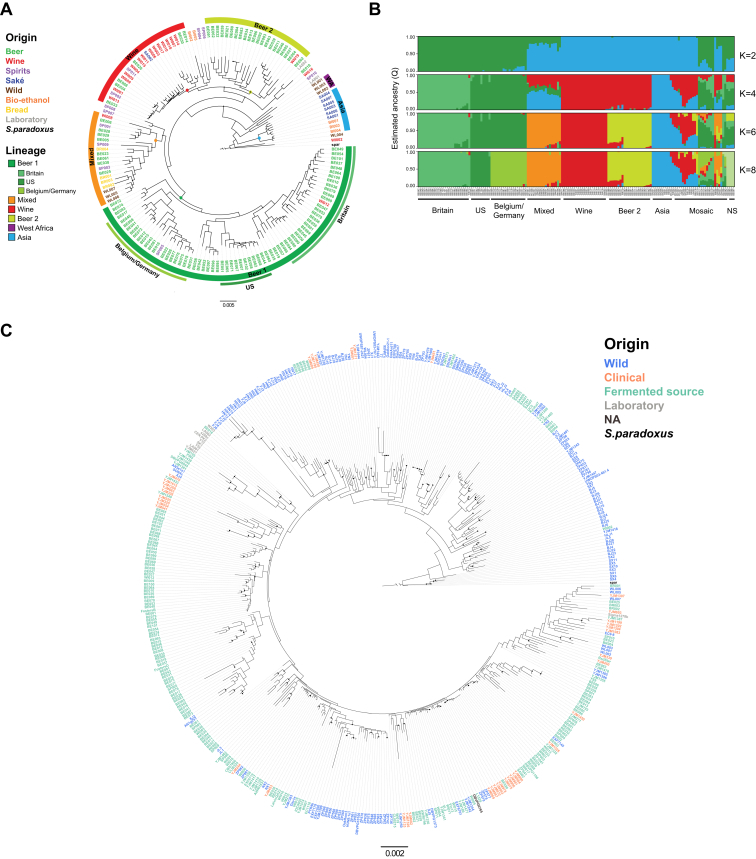
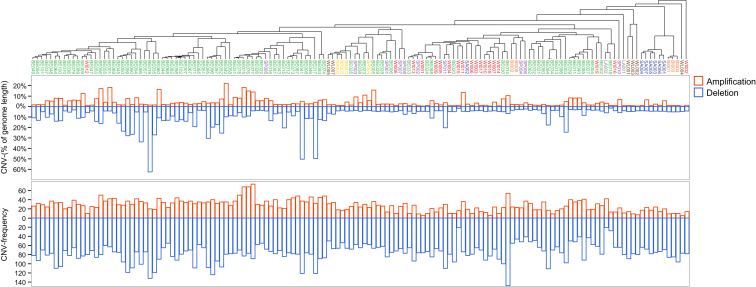
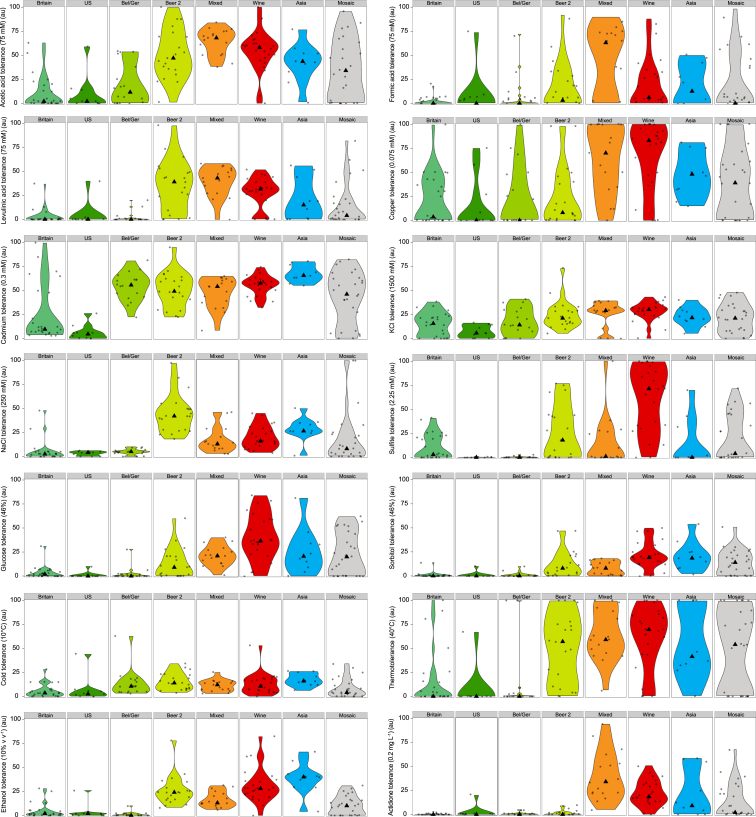
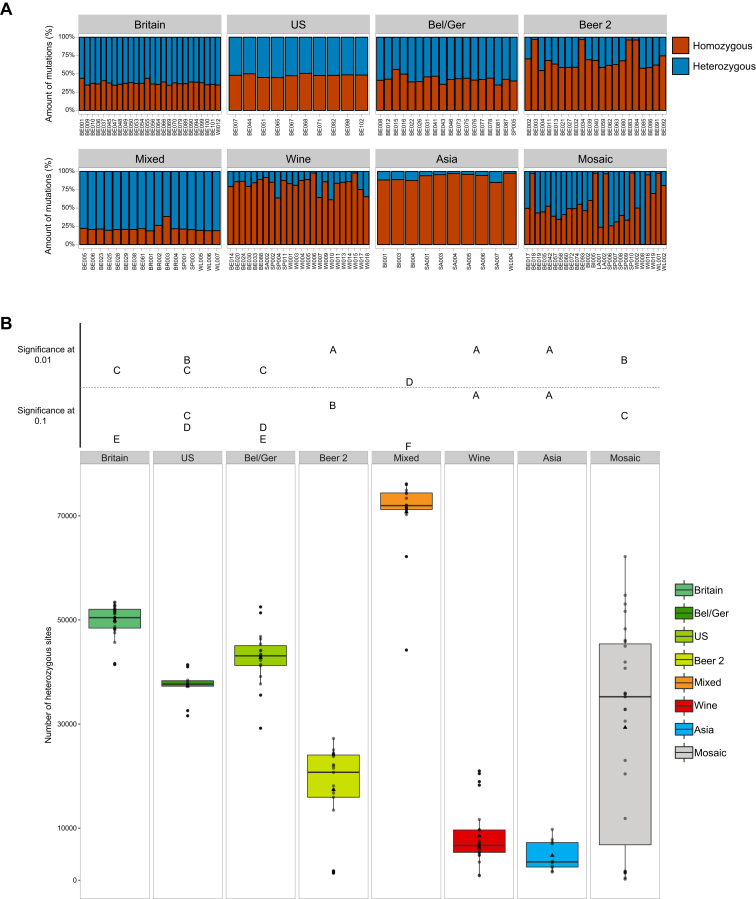
Whereas domestication of livestock, pets, and crops is well documented, it is still unclear to what extent microbes associated with the production of food have also undergone human selection and where the plethora of industrial strains originates from. Here, we present the genomes and phenomes of 157 industrial Saccharomyces cerevisiae yeasts. Our analyses reveal that today's industrial yeasts can be divided into five sublineages that are genetically and phenotypically separated from wild strains and originate from only a few ancestors through complex patterns of domestication and local divergence. Large-scale phenotyping and genome analysis further show strong industry-specific selection for stress tolerance, sugar utilization, and flavor production, while the sexual cycle and other phenotypes related to survival in nature show decay, particularly in beer yeasts. Together, these results shed light on the origins, evolutionary history, and phenotypic diversity of industrial yeasts and provide a resource for further selection of superior strains. PAPERCLIP.


Figures

Image 1
Graphical abstract
Figure 1
Figure 1
Phylogeny and Population Structure of Industrial S. cerevisiae Strains (A) Maximum likelihood phylogenetic tree of all S. cerevisiae strains sequenced in this project supplemented with a representative set of 24 previously sequenced strains (Liti et al., 2009, Strope et al., 2015) and using Saccharomyces paradoxus as an outgroup. Black dots on nodes indicate bootstrap support values <70%. Color codes indicate origin (names) and lineage (circular bands). The basal splits of the five industrial lineages are indicated with colored dots. Mosaic strains identified in this study are indicated with black dots next to the strain codes. Branch lengths reflect the average number of substitutions per site. Scale bar, 0.005 substitutions per site. (B) Population structure identified in the 157 surveyed strains. The vertical axis depicts the fractional representation of resolved populations (colors) within each strain (horizontal axis, strains listed in Figure S1C) for K = 2, 4, 6, and 8 assumed ancestral populations (where K = 8 maximizes the marginal likelihood and best explains the data structure). Mosaic strains (i.e., strains that possess <80% ancestry from a single population) are visualized as a separate group. (C) Principal component projection, using the same set of SNPs as in Figure 1B. Colors represent different populations. WA, West Africa; NA, North America; M, Malaysia; NS, not specified. See also Figure S1 and Tables S1, S2, and S8.
Figure 2
Figure 2
Ploidy and Copy-Number Variation in Industrial S. cerevisiae Strains (A) Genome-wide visualization of copy-number variation (CNV) profiles, with the aggregate profile across all strains depicted on the top. Estimates for the nominal ploidy (n) values of the strains are represented by a bar chart next to the strain codes. Heat map colors reflect amplification (red shades) or deletion (blue shades) of genomic fragments. A distinction is made between completely deleted fragments (dark blue) and fragments of which at least one copy is still present (light blue). Similarly, highly amplified fragments (copy number ≥2-fold the basal ploidy) are depicted in dark red, while low and moderately amplified fragments (copy number <2-fold the basal ploidy) are depicted in orange. For strains with no estimated ploidy available, colors are only indicative of the presence of amplifications (orange) or deletions (light blue). Roman numbers indicate chromosome number. Strains are clustered according to their genetic relatedness as determined in Figure S1A. Origin (name colors) and population (colored rectangles) are indicated on the figure. (B–E) Violin plots describing the density of amplifications and deletions across different industries and subpopulations. Triangles indicate the median within each group. (F and G) Correlations between levels of CNV load (Mb) and estimated ploidy (n), by industry and subpopulations. See also Figure S2 and Tables S3 and S4.
Figure 3
Figure 3
Trait Variation of Industrial S. cerevisiae Strains (A) Heat map representation of phenotypic diversity within industrial S. cerevisiae strains. Phenotypic values are calculated as Z scores (normalized values) and colored according to the scale on the right. Missing values are represented by gray shadings. Strains are hierarchically clustered based on phenotypic behavior. Strain names are colored according to geographical origin, as in Figure 1A. The corresponding subpopulation of each strain is indicated by the colored bar below the figure, according to the color code of Figure 1B. (B) Ethanol production (depicted as % v/v−1) of all strains from different subpopulations in fermentation medium containing 35% glucose. (C) Growth of all strains from different subpopulations on medium supplemented with 0.075 mM copper, relative to growth on medium without copper. (D) Growth of all strains from different subpopulations on medium supplemented with 2.25 mM sulfite, relative to growth on medium without sulfite. (E) Growth of all strains from different subpopulations in medium containing 1% w v−1 maltotriose as the sole carbon source, relative to growth on medium with 1% w/v−1 glucose. au, arbitrary units; Bel/Ger, Belgium/Germany. See also Figure S3 and Tables S5, S6, and S7.
Figure 4
Figure 4
The Reproductive Lifestyle of Industrial S. cerevisiae Strains (A) Violin plots depicting sporulation efficiency of all strains from different subpopulations. (B) Violin plots depicting spore viability of all sporulating strains from different subpopulations. (C) Visualization of the level of heterozygosity across the genome of the different subpopulations, calculated as the ratio of heterozygous/homozygous SNPs in 10 kb windows. (D–G) Scatter plots depicting the correlation between the number of heterozygous loci and spore viability (D) or sporulation efficiency (E), and the correlation between the fraction of the genome subjected to large (>20 kb) structural variation and spore viability (F) or sporulation efficiency (G). Dot colors indicate subpopulations similar to the color code of Figure 1B. See also Figure S4.
Figure 5
Figure 5
Production of 4-Vinyl Guaiacol by Industrial S. cerevisiae Strains (A) Distribution of loss-of-function SNPs and frame-shift mutations in FDC1 and PAD1 of industrial S. cerevisiae strains. Gray boxes indicate the presence of the loss-of-function mutation, diagonal bars indicate heterozygosity at this site. Strains are clustered according to the strain phylogeny and strain names are colored according to their origin. Basal splits of the five industrial lineages are indicated with colored dots (see Figure 1A). (B) Percentage of strains within each origin (left) and population (right) capable of producing 4-vinyl guaiacol (4-VG). Red, 4-VG; turquoise, 4-VG+. (C) Phylogenetic trees and ancestral trait reconstruction of PAD1 and FDC1 genes. Branches are colored according to the most probable state of their ancestral nodes, turquoise (4-VG+) or red (4-VG). Pie charts indicate probabilities of each state at specific nodes, turquoise (4-VG+) or red (4-VG); posterior probability for the same nodes is indicated by a dot: black dot, 90%–100%; gray, 70%; white, 42%. Branch lengths reflect the average numbers of substitutions per site (compare scale bars). (D) Development of new yeast variants with specific phenotypic features by marker-assisted breeding. Two parent strains (BE027 and SA005) were sporulated and, using genetic markers, segregants with the desired genotype were selected (1). Next, breeding between segregants from different parents (outbreeding) or the same parent (inbreeding) were performed (2). This breeding scheme yields hybrids with altered aromatic properties that can directly be applied in industrial fermentations (3). 4-VG production is shown relative to the production of BE027. Yeast genomes are represented by gray bars, loss-of-function mutations in FDC1 as red (W497) and blue (K54) boxes within the gray bars. Error bars represent one SD from the mean. See also Table S5.
Figure S1
Figure S1
Phylogeny and Population Structure of the Industrial S. cerevisiae Strains, Related to Figures 1A–1C (A) Phylogenetic tree of strains sequenced in this study, using Saccharomyces paradoxus as an outgroup. The tree was inferred from the concatenation matrix of 2,020 single copy orthologs. Black dots on nodes indicate bootstrap support values < 70%. Color codes indicate origin (names) and lineage (circular bands). The basal splits of the five industrial lineages are indicated with a colored dot. Branch lengths reflect the average number of substitutions per site (scale bar = 0.005 substitutions per site). (B) Population structure plot, with strain codes indicated. (C) Maximum likelihood phylogenetic tree inferred from a concatenated alignment of nine partial genes of 450 S. cerevisiae isolates, using S. paradoxus as an outgroup. Strains are colored according to origin. For a list of the included strains and corresponding references, see Table S2. Branch lengths reflect the average number of substitutions per site (scale bar = 0.002 substitutions per site). Dots indicate nodes with bootstrap support values > 50%. Font color codes indicate origin: wild (blue), clinical (orange), fermented source (green), laboratory (gray), not available (NA) (dark gray), S. paradoxus (black).
Figure S2
Figure S2
Copy-Number Variability across the Phylogenetic Tree, Related to Figure 2 Distribution of amplifications (red) and deletions (blue) in each strain, expressed in percentage of the genome affected (top) and in number of CNV events (bottom). The phylogenetic tree is described in Figure S1A.
Figure S3
Figure S3
Trait Variation in Industrial S. cerevisiae Strains, Related to Figure 3 Graphic representation (violin plots) of trait variation within and between the subpopulations for different environmental stressors. Triangles represent median values for each subpopulation. All values are depicted as relative growth compared to growth on medium without the stressor. Statistical analysis for each trait is given in Table S6. au = arbitrary units.
Figure S4
Figure S4
Heterozygosity of Industrial Yeasts, Related to Figure 4 (A) Percentage of total SNPs identified as heterozygous or homozygous in each strain. Boxes depict subpopulations and bar colors indicate the percentage of homozygous (red) and heterozygous (blue) SNPs. (B) Box plots depicting the total number of heterozygous sites per subpopulation. The mean number of heterozygous sites for each comparison group is indicated by a triangle and the median by a horizontal line. Groups sharing the same letter (top) are not significantly different at the 10% or 1% level.

References

    1. Almeida P., Barbosa R., Zalar P., Imanishi Y., Shimizu K., Turchetti B., Legras J.L., Serra M., Dequin S., Couloux A. A population genomics insight into the Mediterranean origins of wine yeast domestication. Mol. Ecol. 2015;24:5412–5427. - PubMed
    1. Baele G., Lemey P. Bayesian evolutionary model testing in the phylogenomics era: matching model complexity with computational efficiency. Bioinformatics. 2013;29:1970–1979. - PubMed
    1. Baele G., Lemey P., Bedford T., Rambaut A., Suchard M.A., Alekseyenko A.V. Improving the accuracy of demographic and molecular clock model comparison while accommodating phylogenetic uncertainty. Mol. Biol. Evol. 2012;29:2157–2167. - PMC - PubMed
    1. Bergström A., Simpson J.T., Salinas F., Barré B., Parts L., Zia A., Nguyen Ba A.N., Moses A.M., Louis E.J., Mustonen V. A high-definition view of functional genetic variation from natural yeast genomes. Mol. Biol. Evol. 2014;31:872–888. - PMC - PubMed
    1. Bokulich N.A., Thorngate J.H., Richardson P.M., Mills D.A. Microbial biogeography of wine grapes is conditioned by cultivar, vintage, and climate. Proc. Natl. Acad. Sci. USA. 2014;111:E139–E148. - PMC - PubMed

Publication types