. 2016 Sep 8;166(6):1539-1552.e16.
doi: 10.1016/j.cell.2016.08.027.

Lipid Biosynthesis Coordinates a Mitochondrial-to-Cytosolic Stress Response

Affiliations

Lipid Biosynthesis Coordinates a Mitochondrial-to-Cytosolic Stress Response

Hyun-Eui Kim et al. Cell. .

Abstract

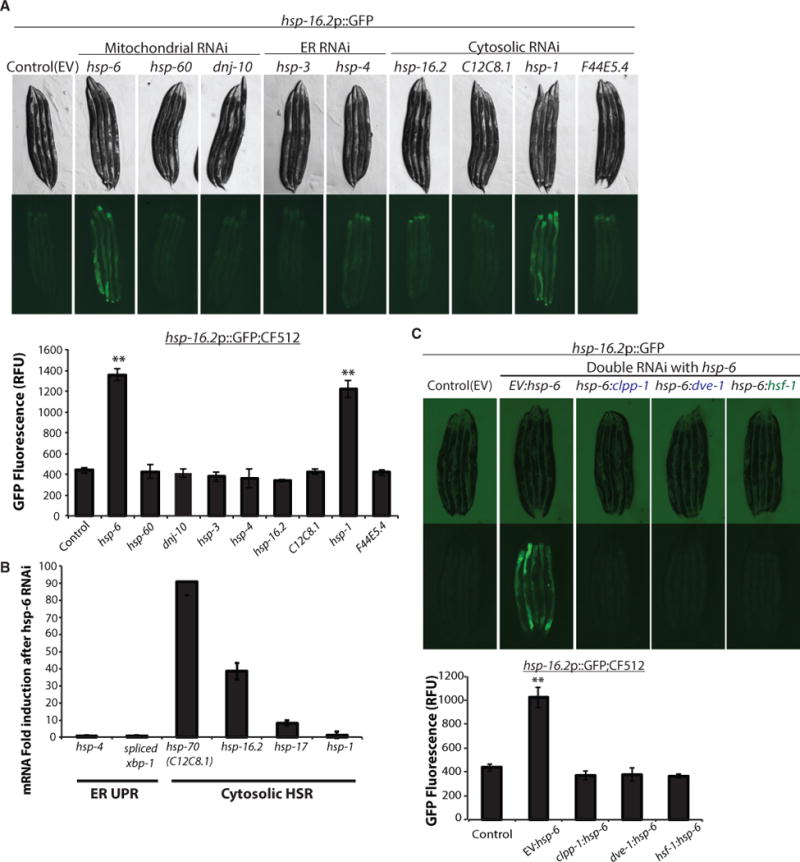
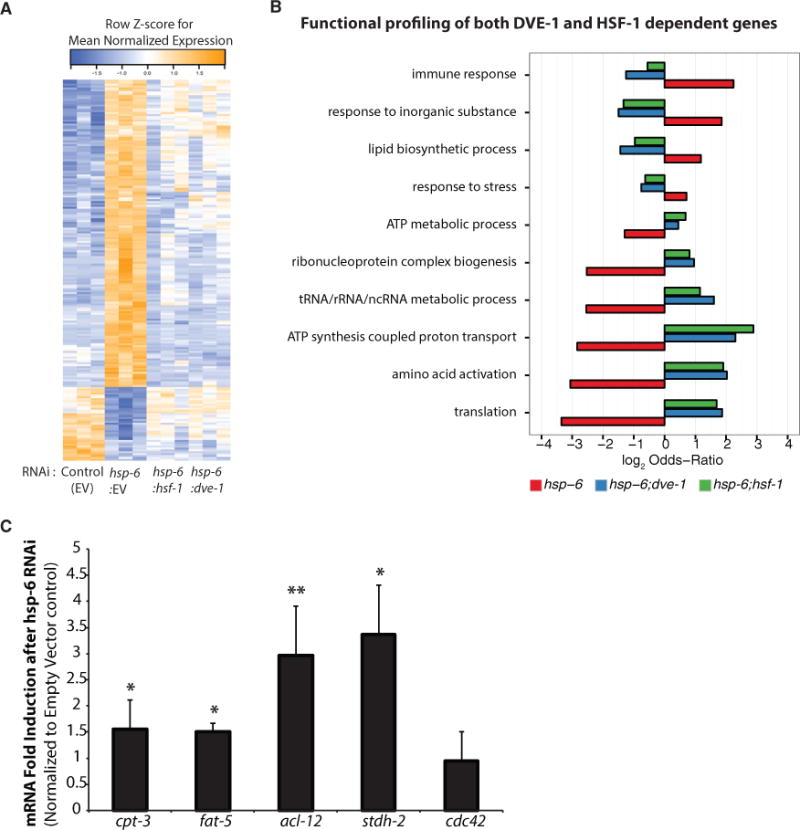
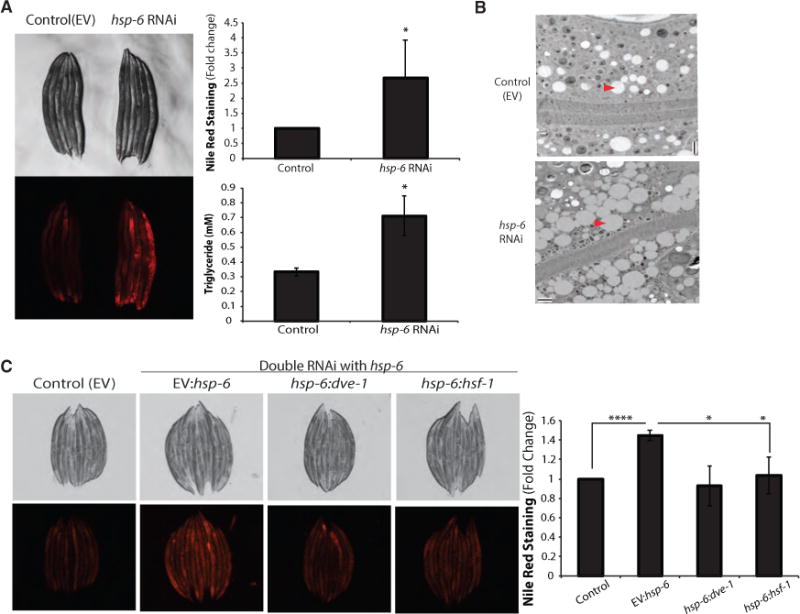
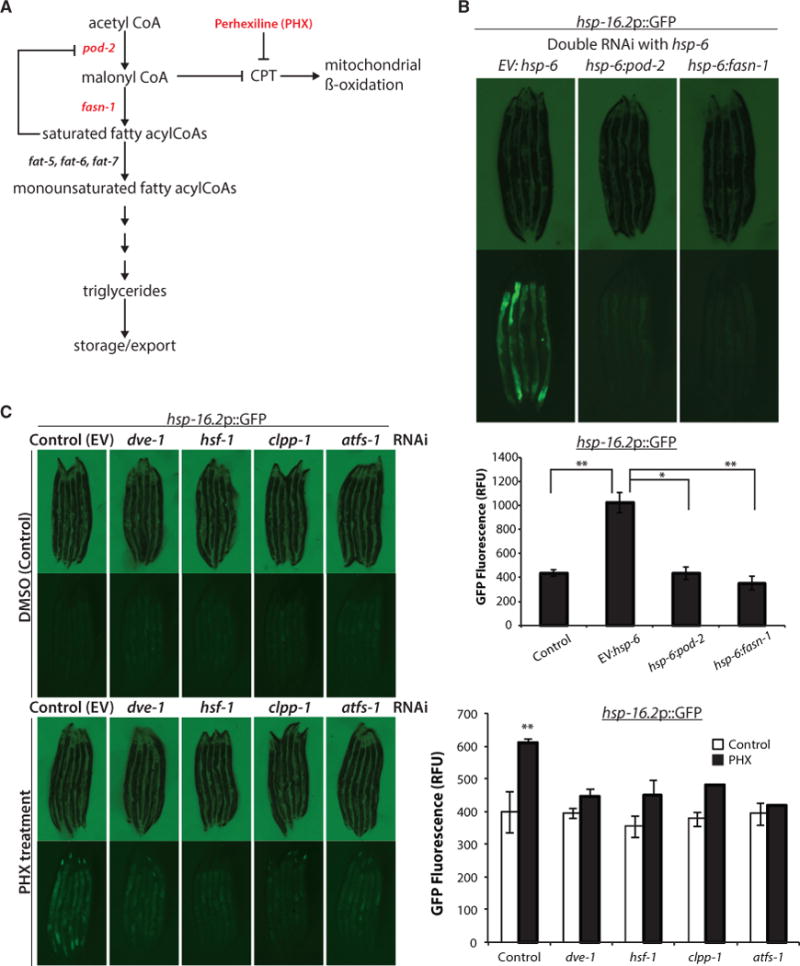
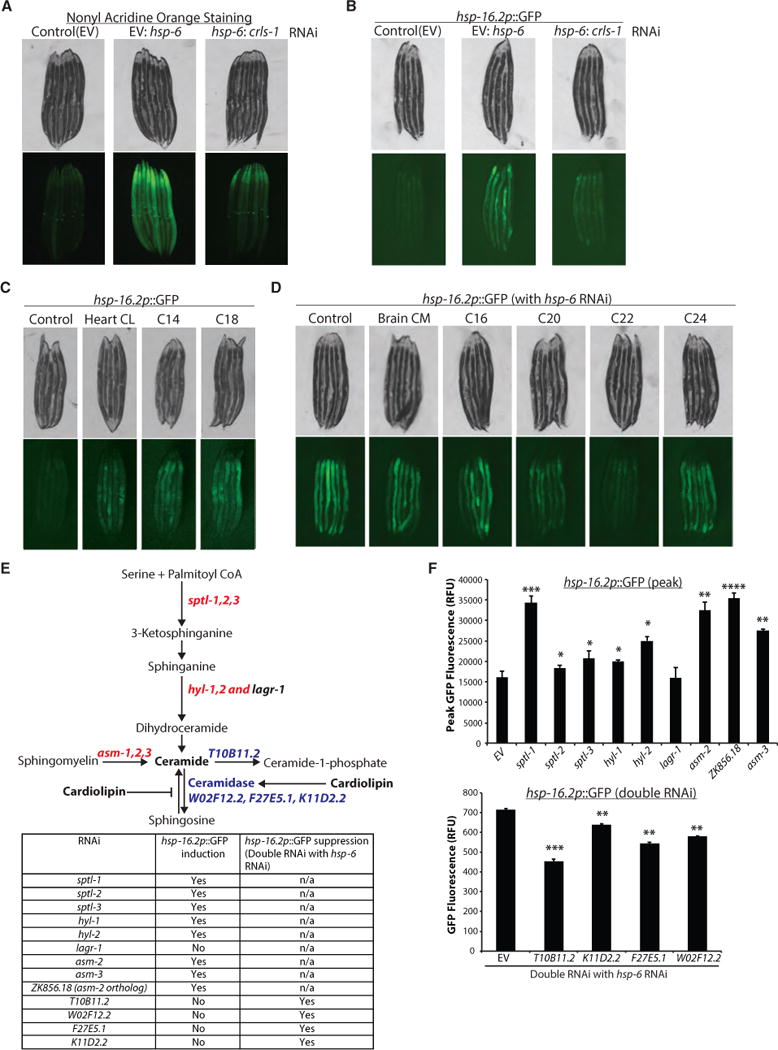
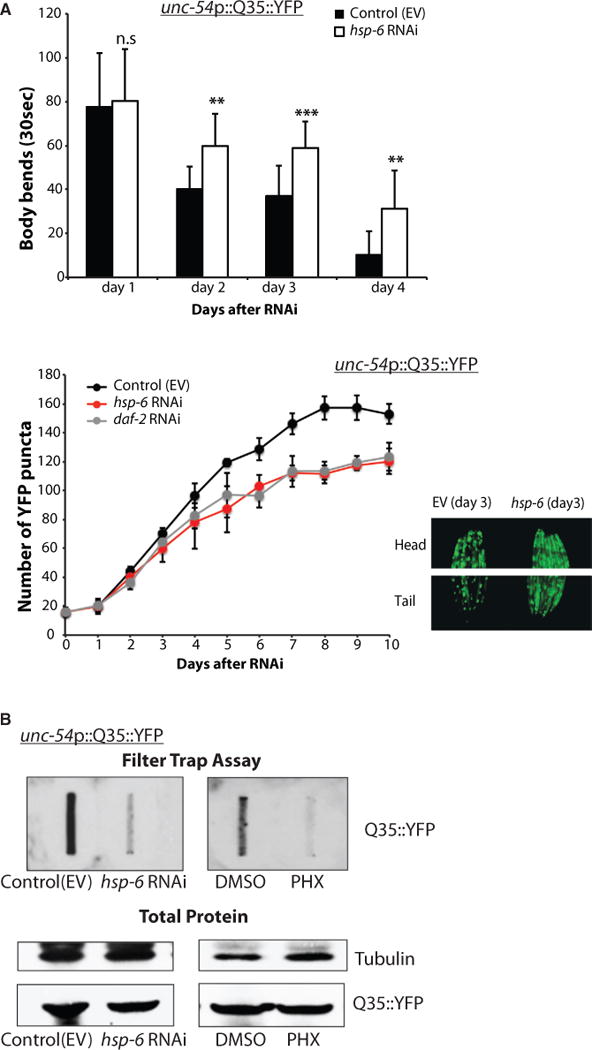
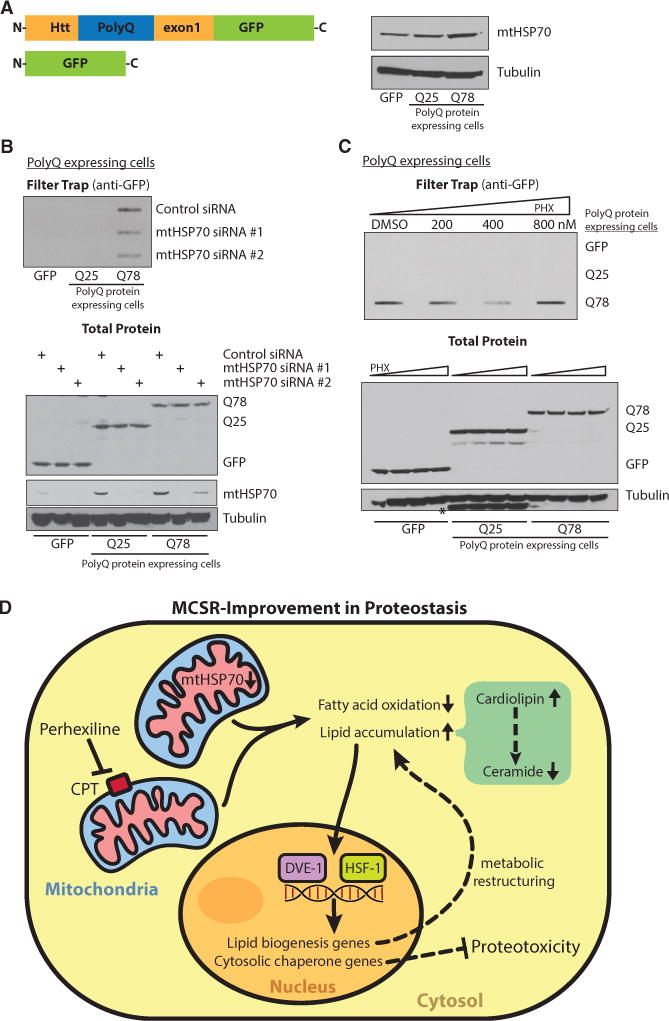
Defects in mitochondrial metabolism have been increasingly linked with age-onset protein-misfolding diseases such as Alzheimer's, Parkinson's, and Huntington's. In response to protein-folding stress, compartment-specific unfolded protein responses (UPRs) within the ER, mitochondria, and cytosol work in parallel to ensure cellular protein homeostasis. While perturbation of individual compartments can make other compartments more susceptible to protein stress, the cellular conditions that trigger cross-communication between the individual UPRs remain poorly understood. We have uncovered a conserved, robust mechanism linking mitochondrial protein homeostasis and the cytosolic folding environment through changes in lipid homeostasis. Metabolic restructuring caused by mitochondrial stress or small-molecule activators trigger changes in gene expression coordinated uniquely by both the mitochondrial and cytosolic UPRs, protecting the cell from disease-associated proteins. Our data suggest an intricate and unique system of communication between UPRs in response to metabolic changes that could unveil new targets for diseases of protein misfolding.


Figures

Figure 1
Figure 1. Knockdown of Mitochondrial HSP70, hsp-6, Induces Cytosolic Heat Shock Response via UPRmt
(A) hsp-6 and hsp-1 RNAi-induced cytosolic small heat shock protein expression. hsp-16.2p::GFP induction was measured by COPAS biosorter (bottom) (mean ± SD of three biological repeats; **p ≤ 0.01). EV, empty vector control RNAi. (B) qPCR of UPRER and cytosolic HSR genes after hsp-6 RNAi (mean ± SD of three biological repeats). (C) Cytosolic HSR induced by hsp-6 RNAi was dependent on both hsf-1 and UPRmt components. hsp-16.2p::GFP induction was measured by COPAS biosorter (bottom) (mean ± SD of three biological repeats; **p ≤ 0.001). See also Figure S1 and Table S1.
Figure 2
Figure 2. Microarray Analysis Suggests the DVE-1- and HSF-1-Dependent Gene Regulation of Fat Metabolism
(A) Heatmap of normalized gene expression for 187 genes differentially expressed in hsp-6 RNAi relative to empty vector (EV) control. (B) DVE-1- and HSF-1-dependent Gene Ontology (GO) biological process terms enriched in hsp-6 RNAi relative to EV. 30 GO terms were clustered to identify the 10 representative terms shown. (C) Expression of the lipid synthesis genes from microarray experiments was verified by qPCR after hsp-6 RNAi (mean ± SD of three biological repeats; *p ≤ 0.05, **p ≤ 0.01). See also Figure S2 and Table S2.
Figure 3
Figure 3. Mitochondrial HSP70, hsp-6, Knockdown Leads to an Increase in Fat Storage
(A) hsp-6 RNAi-treated worms showed increase in fat content. Nile red staining was quantified by COPAS biosorter (mean ± SD of three biological repeats). Triglyceride content was measured after hsp-6 RNAi (mean ± SD of three biological repeats; *p ≤ 0.05). (B) Electron microscopy showed increased number of lipid droplets in the intestine of hsp-6 RNAi-treated worms(scale bar represents 2 μm, longitudinal section). Arrowheads indicate the lipid droplets. (C) Nile red staining on fixed worms after double RNAi. Nile red staining was quantified by COPAS biosorter (mean ± SD of four biological repeats; *p ≤ 0.05, ****p ≤ 0.0001). Note that the Nile red staining intensities were RNAi-dose dependent (full hsp-6 RNAi in A versus half hsp-6 RNAi in C). See also Figure S3.
Figure 4
Figure 4. Reducing Fat Synthesis Blocks Cytosolic Response, and Inhibiting CPT Activity Induces Cytosolic Stress Response
(A) Diagram showing C. elegans genes involved in the fat storage pathway. pod-2, acyl-CoA carboxylase; fasn-1, fatty acid synthase; fat-5, fat-6, and fat-7, delta-9 fatty acid desaturase; CPT, carnitine palmitoyltransferase. (B) Knocking down two enzymes involved in fat synthesis inhibited cytosolic response. (Continued from Figure 1C; notethat the image of control worms are from Figure 1C.) hsp-16.2p::GFP reporter induction was measured by COPAS biosorter (bottom) (mean ± SD of three biological repeats; *p ≤ 0.05, **p ≤ 0.01). (C) CPT inhibitor PHX-treated hsp-16.2p::GFP;CF512 reporter worms showed elevated levels of GFP that were inhibited by hsf-1 and UPRmt components. GFP induction was measured by COPAS biosorter (right) (mean ± SD of three biological repeats; **p ≤ 0.01). See also Figure S4.
Figure 5
Figure 5. Cardiolipin Synthesis Is Required for MCSR Induction, and Inhibiting Ceramide Synthesis Resulted in MCSR Induction
(A) Nonyl acridine orange staining showed that hsp-6 RNAi induced cardiolipin accumulation, while cardiolipin synthase (crls-1) RNAi in addition to hsp-6 RNAi blocked cardiolipin accumulation in wild-type worms. (B) hsp-16.2p::GFP induction upon hsp-6 RNAi was inhibited by crls-1 RNAi. (C) Cardiolipin-fed hsp-16.2p::GFP reporter worms showed increased GFP signal. Control, 0.5% methanol; Heart CL, cardiolipin purified from the bovine heart; C14, C14:0 cardiolipin; C18, C18:1 cardiolipin. (D) Ceramide-fed hsp-16.2p::GFP reporter worms showed inhibition of MCSR upon hsp-6 RNAi. Control, 0.5% methanol; Brain CM, ceramide purified from the porcine brain; C16, C16 ceramide; C20, C20 ceramide; C22, C22 ceramide; C24, C24 ceramide. (E) Diagram of the ceramide synthesis pathway. RNAi of enzymes written in red induced hsp-16.2 reporter, and RNAi of enzymes written in blue reduced MCSR induction. List of enzymes that were knocked down and the RNAi result are summarized in the table. (F) Quantification of hsp-16.2p::GFP reporter induction and suppression (mean ± SD of three biological repeats; *p ≤ 0.05, **p ≤ 0.01, ***p ≤ 0.001, ****p ≤ 0.0001). hsp-16.2p::GFP reporter induction in the top panel shows the peak GFP signals from the individual worms, and the hsp-16.2p::GFP reporter suppression in the bottom panel shows the suppression of an hsp-6 RNAi-induced MCSR (double RNAi was applied at a one-to-one ratio). See also Figure S5 and Table S3.
Figure 6
Figure 6. Cytosolic Stress Response after Mitochondrial HSP70 Knockdown Improved Cytosolic Protein Homeostasis in polyQ-Expressing C. elegans
(A) (Top) AM140 worms expressing polyQ (Q35::YFP) in body wall muscle cells were tested for motility assay after RNAi treatment. Number of body bends was measured for 30 s in M9 buffer (mean ± SD of three biological repeats; **p ≤ 0.01, ****p ≤ 0.0001). (Bottom) The number of YFP puncta of AM140 worms is shown over time. The images of YFP puncta in the head and tail showed more aggregated YFP puncta in control worms and more soluble YFP signaling in hsp-6 RNAi- treated worms. (B) hsp-6 RNAi- or PHX-treated AM140 worms showed fewer aggregates via filter trap assay.
Figure 7
Figure 7. The MCSR Improved Cytosolic Protein Homeostasis in polyQ-Expressing Human Primary Fibroblasts
(A) PolyQ-expressing human primary fibroblasts were established and showed increased mtHSP70 expression with a longer polyQ tract by western blotting. (B) mtHSP70 siRNA-treated cells showed fewer aggregates via filter trap assay (upper panel). Lower panel shows even expression of different-polyQ-length proteins, knockdown level of mtHSP70 after siRNA transfection, and loading control. (C) PHX treated cells also showed less aggregates on filter trap at 400 nM (upper panel). Lower panel shows even expression of different-polyQ-length proteins and loading control. *Q25 bands from the previous probing. (D) Proposed mechanism of MCSR regulation; mtHSP70 reduction or CPT inhibitor PHX can serve as UPRmt inducers and shift the fat metabolism pathway to the fat storage pathway. Stressed mitochondria (shown in pink) would alter fatty acid metabolism. Changes in lipid balance may serve as a cytosolic signal to turn on the cytosolic response to improve cytosolic protein homeostasis. In this, cardiolipin serves as an activator of the MCSR by reducing the level of an MCSR inhibitor, ceramide. DVE-1 and HSF-1 seem to cooperate to induce the cytosolic response upon mitochondrial perturbation. See also Figure S6.

References

    1. Ashburner M, Ball CA, Blake JA, Botstein D, Butler H, Cherry JM, Davis AP, Dolinski K, Dwight SS, Eppig JT, et al. The Gene Ontology Consortium Gene ontology: tool for the unification of biology. Nat Genet. 2000;25:25–29. - PMC - PubMed
    1. Ashrafi K. Obesity and the regulation of fat metabolism. WormBook. 2007:1–20. - PMC - PubMed
    1. Baird NA, Douglas PM, Simic MS, Grant AR, Moresco JJ, Wolff SC, Yates JR, Manning G, Dillin A. HSF-1-mediated cytoskelet al integrity determines thermotolerance and life span. Science. 2014;346:360–363. - PMC - PubMed
    1. Becker T, Böttinger L, Pfanner N. Mitochondrial protein import: from transport pathways to an integrated network. Trends Biochem Sci. 2012;37:85–91. - PubMed
    1. Bellyei S, Szigeti A, Boronkai A, Pozsgai E, Gomori E, Melegh B, Janaky T, Bognar Z, Hocsak E, Sumegi B, Gallyas F., Jr Inhibition of cell death by a novel 16.2 kD heat shock protein predominantly via Hsp90 mediated lipid rafts stabilization and Akt activation pathway. Apoptosis. 2007;12:97–112. - PubMed

Publication types