

Genetic Regulation of Phenotypic Plasticity and Canalisation in Yeast Growth
- PMID: 27611930
- PMCID: PMC5017675
- DOI: 10.1371/journal.pone.0162326
Genetic Regulation of Phenotypic Plasticity and Canalisation in Yeast Growth
Abstract
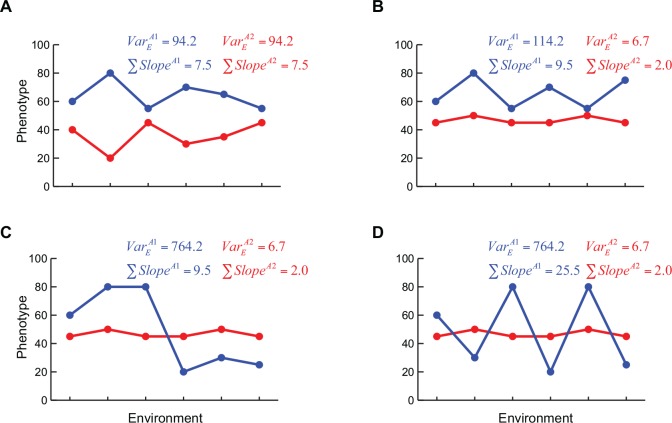
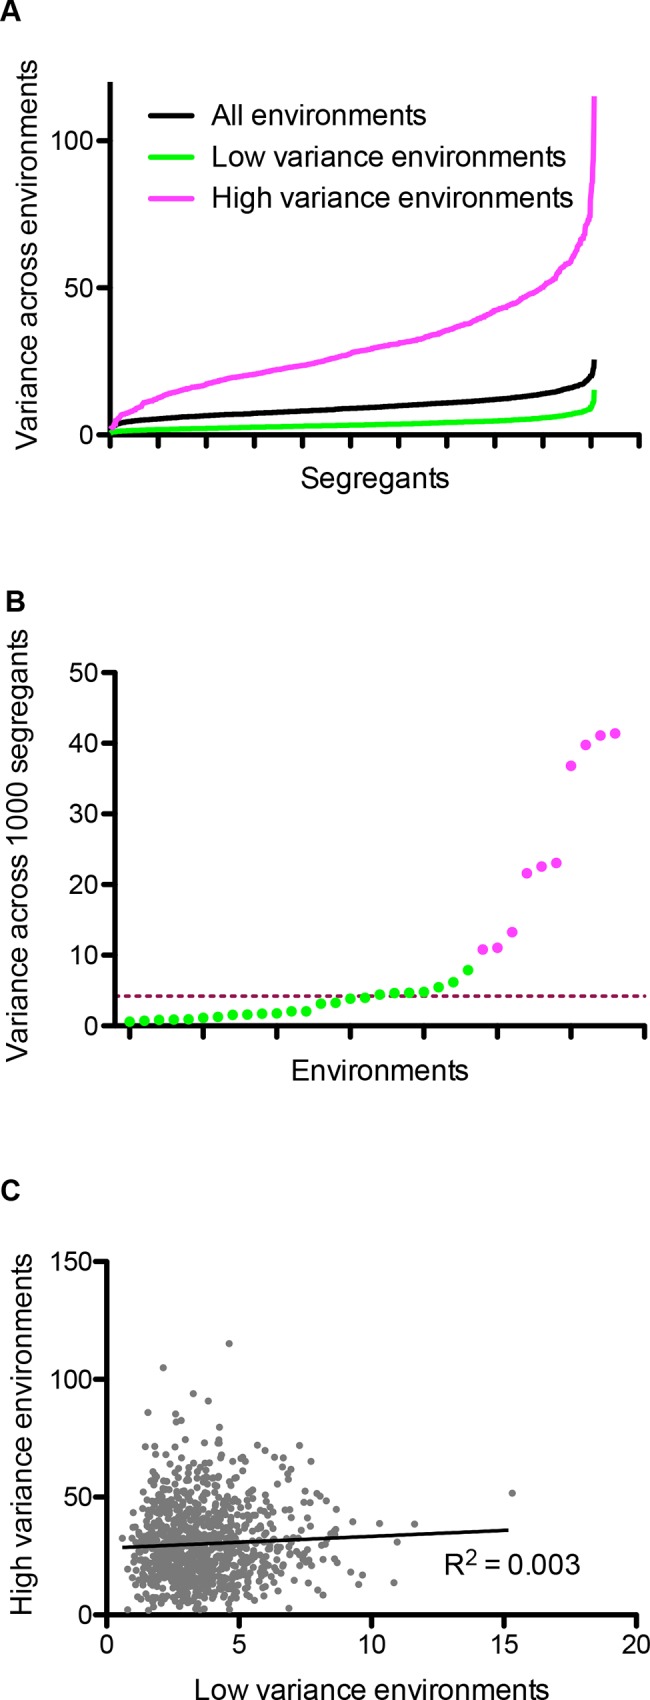
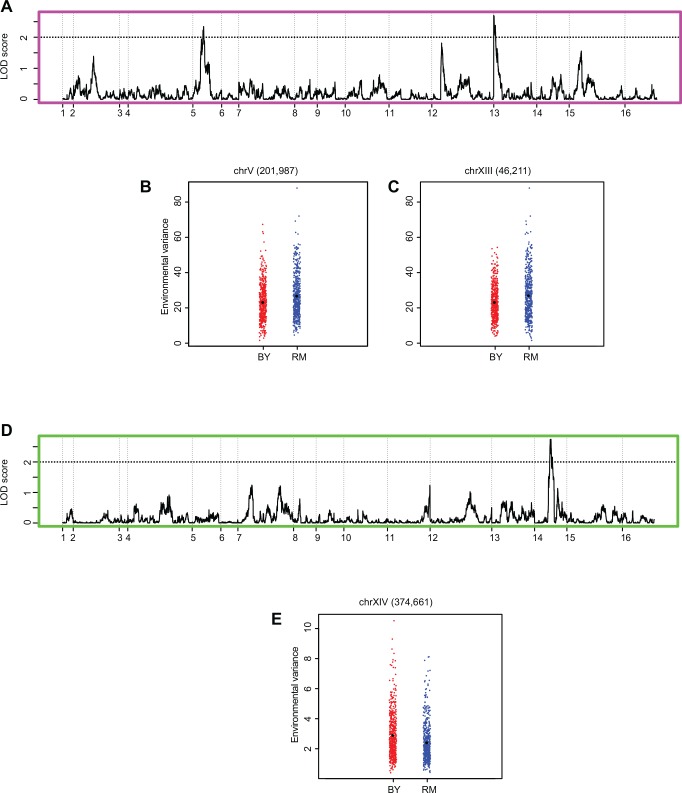
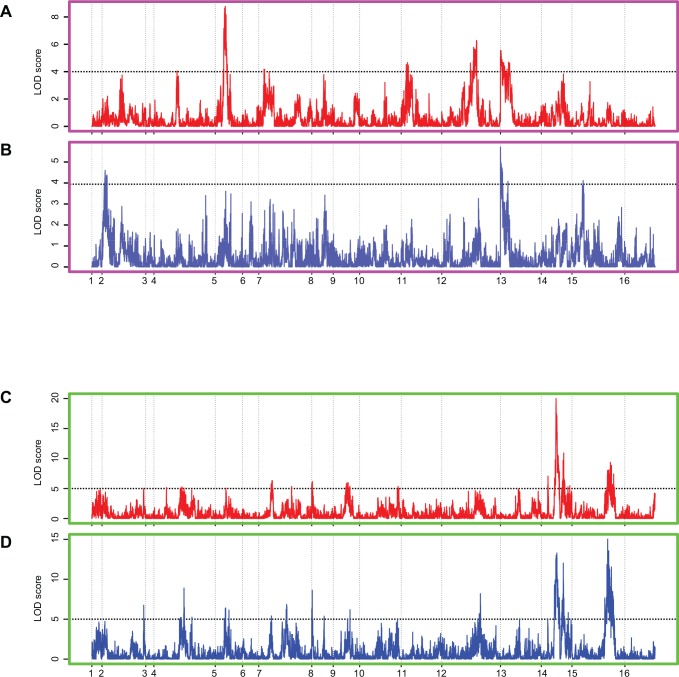
The ability of a genotype to show diverse phenotypes in different environments is called phenotypic plasticity. Phenotypic plasticity helps populations to evade extinctions in novel environments, facilitates adaptation and fuels evolution. However, most studies focus on understanding the genetic basis of phenotypic regulation in specific environments. As a result, while it's evolutionary relevance is well established, genetic mechanisms regulating phenotypic plasticity and their overlap with the environment specific regulators is not well understood. Saccharomyces cerevisiae is highly sensitive to the environment, which acts as not just external stimulus but also as signalling cue for this unicellular, sessile organism. We used a previously published dataset of a biparental yeast population grown in 34 diverse environments and mapped genetic loci regulating variation in phenotypic plasticity, plasticity QTL, and compared them with environment-specific QTL. Plasticity QTL is one whose one allele exhibits high plasticity whereas the other shows a relatively canalised behaviour. We mapped phenotypic plasticity using two parameters-environmental variance, an environmental order-independent parameter and reaction norm (slope), an environmental order-dependent parameter. Our results show a partial overlap between pleiotropic QTL and plasticity QTL such that while some plasticity QTL are also pleiotropic, others have a significant effect on phenotypic plasticity without being significant in any environment independently. Furthermore, while some plasticity QTL are revealed only in specific environmental orders, we identify large effect plasticity QTL, which are order-independent such that whatever the order of the environments, one allele is always plastic and the other is canalised. Finally, we show that the environments can be divided into two categories based on the phenotypic diversity of the population within them and the two categories have differential regulators of phenotypic plasticity. Our results highlight the importance of identifying genetic regulators of phenotypic plasticity to comprehensively understand the genotype-phenotype map.
Conflict of interest statement
The authors have declared that no competing interests exist.
Figures
Similar articles
-
Resolving the Complex Genetic Basis of Phenotypic Variation and Variability of Cellular Growth.Genetics. 2017 Jul;206(3):1645-1657. doi: 10.1534/genetics.116.195180. Epub 2017 May 11. Genetics. 2017. PMID: 28495957 Free PMC article.
-
Genetics of phenotypic plasticity: QTL analysis in barley, Hordeum vulgare.Heredity (Edinb). 2009 Feb;102(2):163-73. doi: 10.1038/hdy.2008.76. Epub 2008 Oct 22. Heredity (Edinb). 2009. PMID: 18941472
-
Yeast growth plasticity is regulated by environment-specific multi-QTL interactions.G3 (Bethesda). 2014 Jan 28;4(5):769-77. doi: 10.1534/g3.113.009142. G3 (Bethesda). 2014. PMID: 24474169 Free PMC article.
-
Genetic mapping of quantitative phenotypic traits in Saccharomyces cerevisiae.FEMS Yeast Res. 2012 Mar;12(2):215-27. doi: 10.1111/j.1567-1364.2011.00777.x. Epub 2012 Jan 24. FEMS Yeast Res. 2012. PMID: 22150948 Review.
-
It's not magic - Hsp90 and its effects on genetic and epigenetic variation.Semin Cell Dev Biol. 2019 Apr;88:21-35. doi: 10.1016/j.semcdb.2018.05.015. Epub 2018 Jun 6. Semin Cell Dev Biol. 2019. PMID: 29807130 Free PMC article. Review.
Cited by
-
Dissection of quantitative trait loci in the Lachancea waltii yeast species highlights major hotspots.G3 (Bethesda). 2021 Sep 6;11(9):jkab242. doi: 10.1093/g3journal/jkab242. G3 (Bethesda). 2021. PMID: 34544138 Free PMC article.
-
Molecular basis of phenotypic plasticity in a marine ciliate.ISME J. 2024 Jan 8;18(1):wrae136. doi: 10.1093/ismejo/wrae136. ISME J. 2024. PMID: 39018220 Free PMC article.
-
The Genomic Architecture of Interactions Between Natural Genetic Polymorphisms and Environments in Yeast Growth.Genetics. 2017 Feb;205(2):925-937. doi: 10.1534/genetics.116.195487. Epub 2016 Nov 30. Genetics. 2017. PMID: 27903611 Free PMC article.
-
Flor Yeasts Rewire the Central Carbon Metabolism During Wine Alcoholic Fermentation.Front Fungal Biol. 2021 Oct 18;2:733513. doi: 10.3389/ffunb.2021.733513. eCollection 2021. Front Fungal Biol. 2021. PMID: 37744152 Free PMC article.
-
Phenotypic Plasticity of Staphylococcus aureus in Liquid Medium Containing Vancomycin.Front Microbiol. 2019 Apr 16;10:809. doi: 10.3389/fmicb.2019.00809. eCollection 2019. Front Microbiol. 2019. PMID: 31057516 Free PMC article.
References
MeSH terms
LinkOut - more resources
Full Text Sources
Other Literature Sources
Molecular Biology Databases
Research Materials
