Meta-Analysis
. 2016 Oct:12:105-117.
doi: 10.1016/j.ebiom.2016.08.036. Epub 2016 Aug 25.

Meta-Analysis of the Luminal and Basal Subtypes of Bladder Cancer and the Identification of Signature Immunohistochemical Markers for Clinical Use

Affiliations
Meta-Analysis

Meta-Analysis of the Luminal and Basal Subtypes of Bladder Cancer and the Identification of Signature Immunohistochemical Markers for Clinical Use

Vipulkumar Dadhania et al. EBioMedicine. 2016 Oct.

Abstract

Background: It has been suggested that bladder cancer can be divided into two molecular subtypes referred to as luminal and basal with distinct clinical behaviors and sensitivities to chemotherapy. We aimed to validate these subtypes in several clinical cohorts and identify signature immunohistochemical markers that would permit simple and cost-effective classification of the disease in primary care centers.

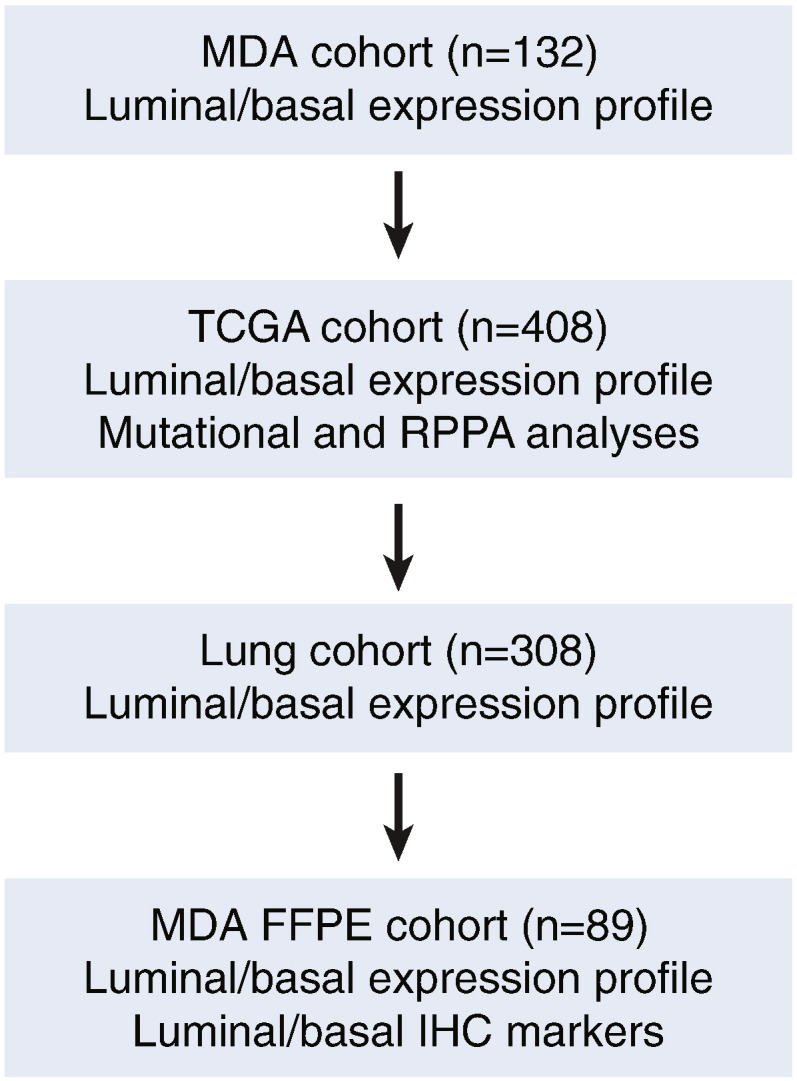
Methods: We analyzed genomic expression profiles of bladder cancer in three cohorts of fresh frozen tumor samples: MD Anderson (n=132), Lund (n=308), and The Cancer Genome Atlas (TCGA) (n=408) to validate the expression signatures of luminal and basal subtypes and relate them to clinical follow-up data. We also used an MD Anderson cohort of archival bladder tumor samples (n=89) and a parallel tissue microarray to identify immunohistochemical markers that permitted the molecular classification of bladder cancer.

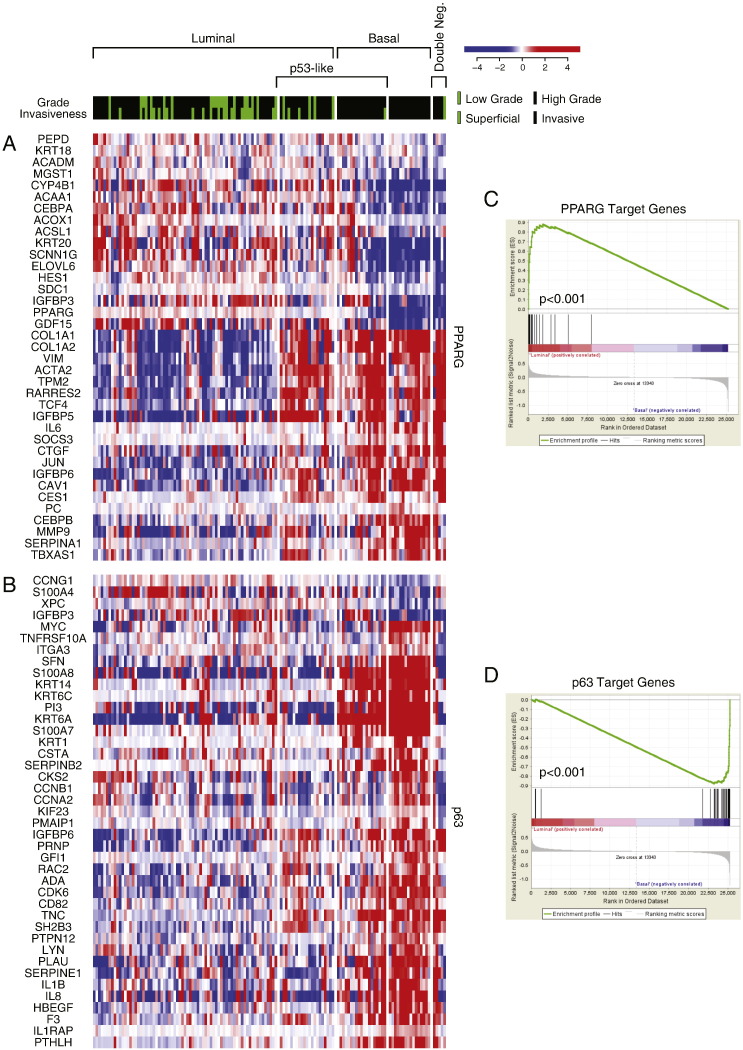
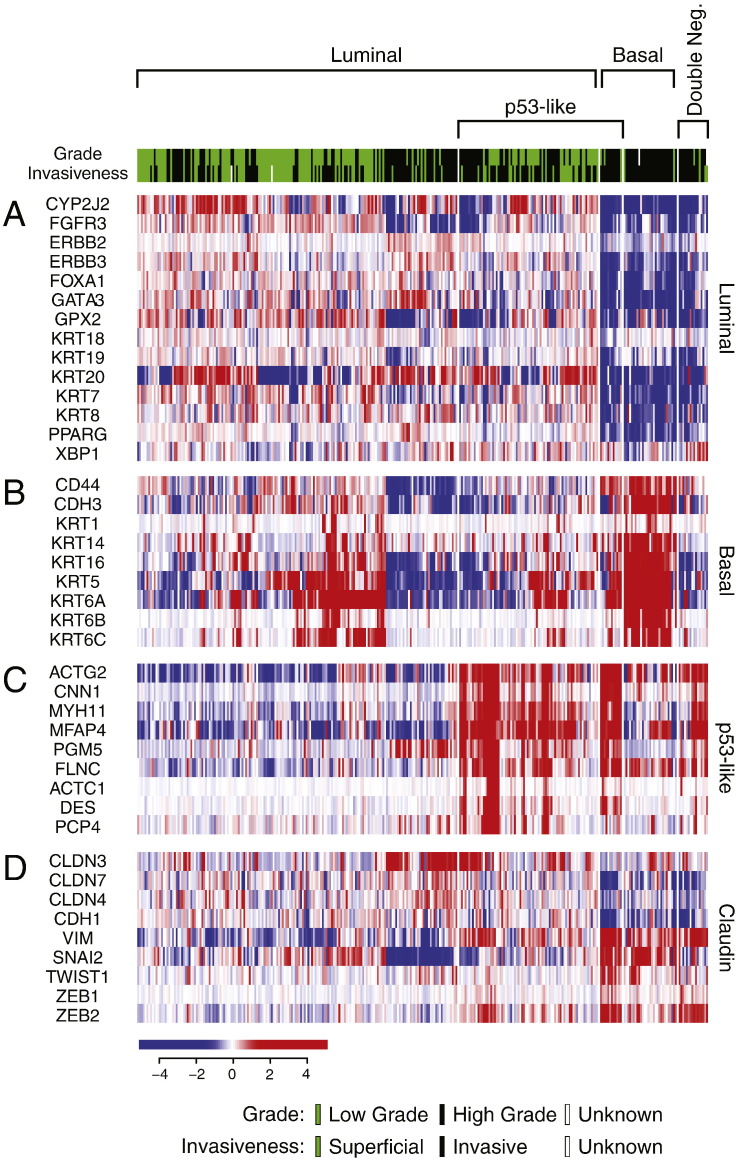
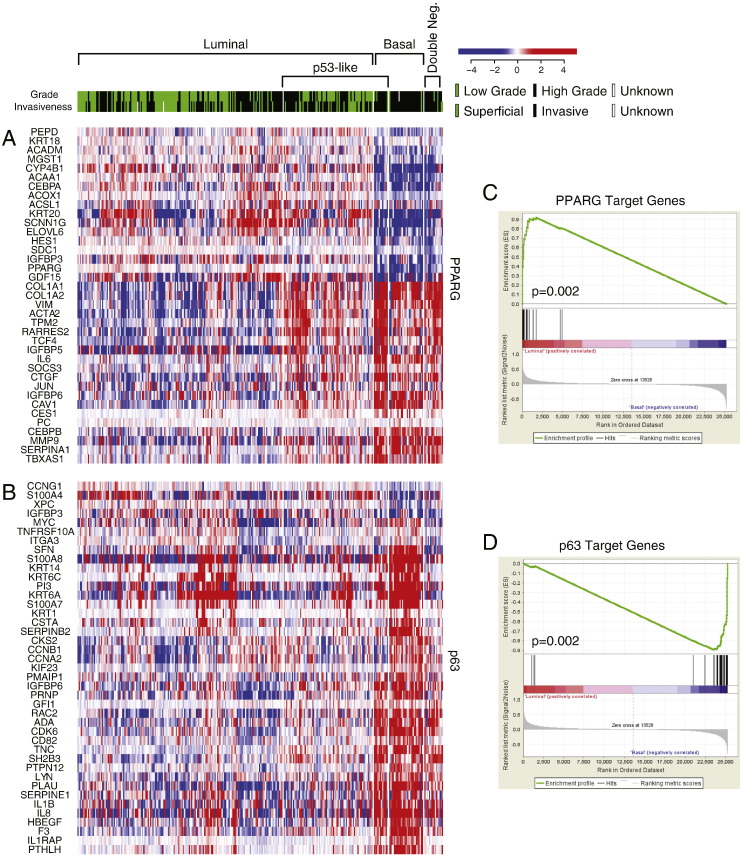
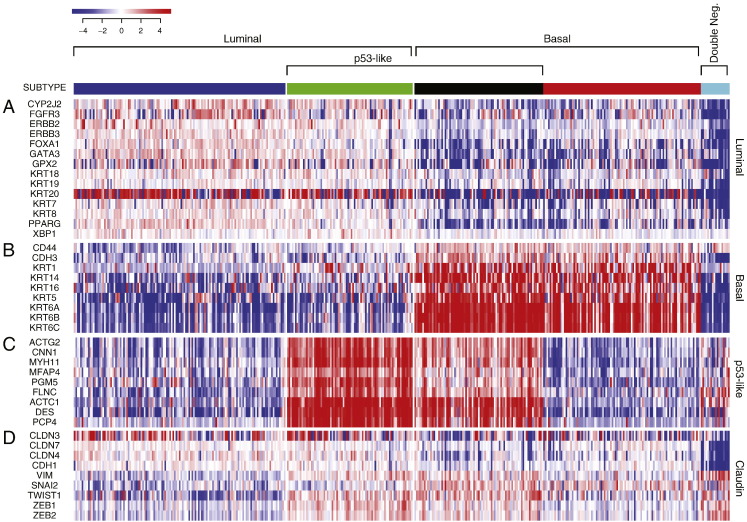
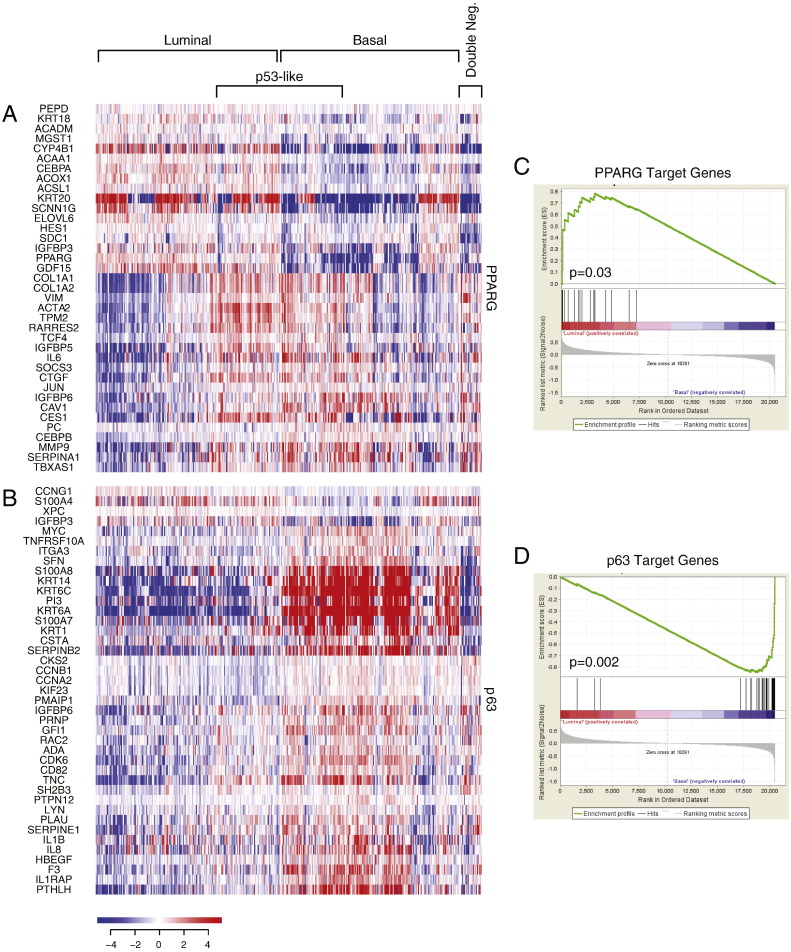
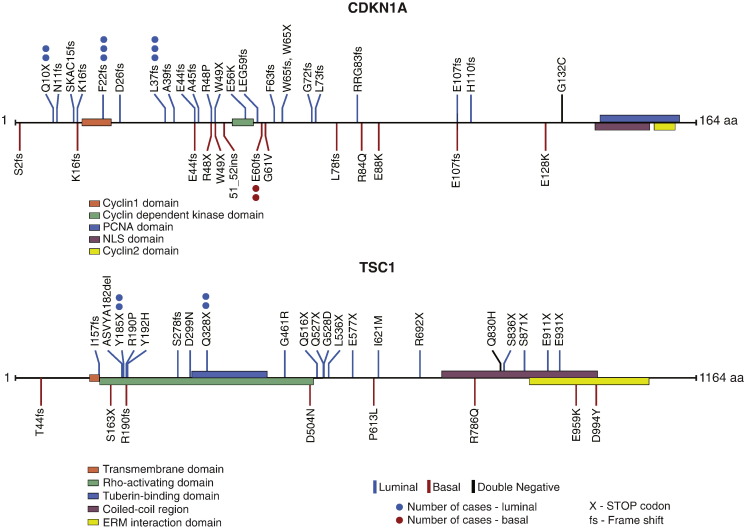
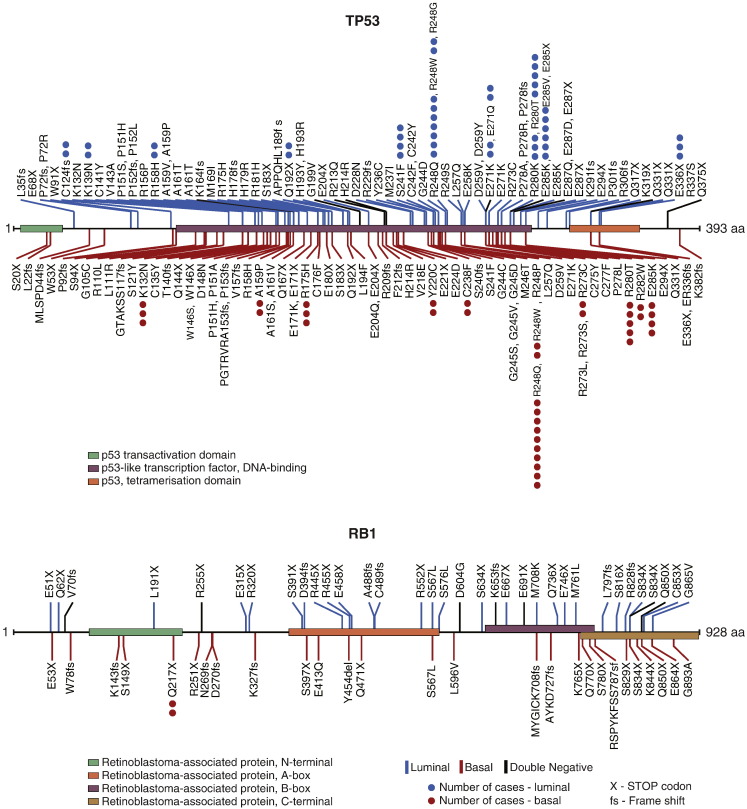
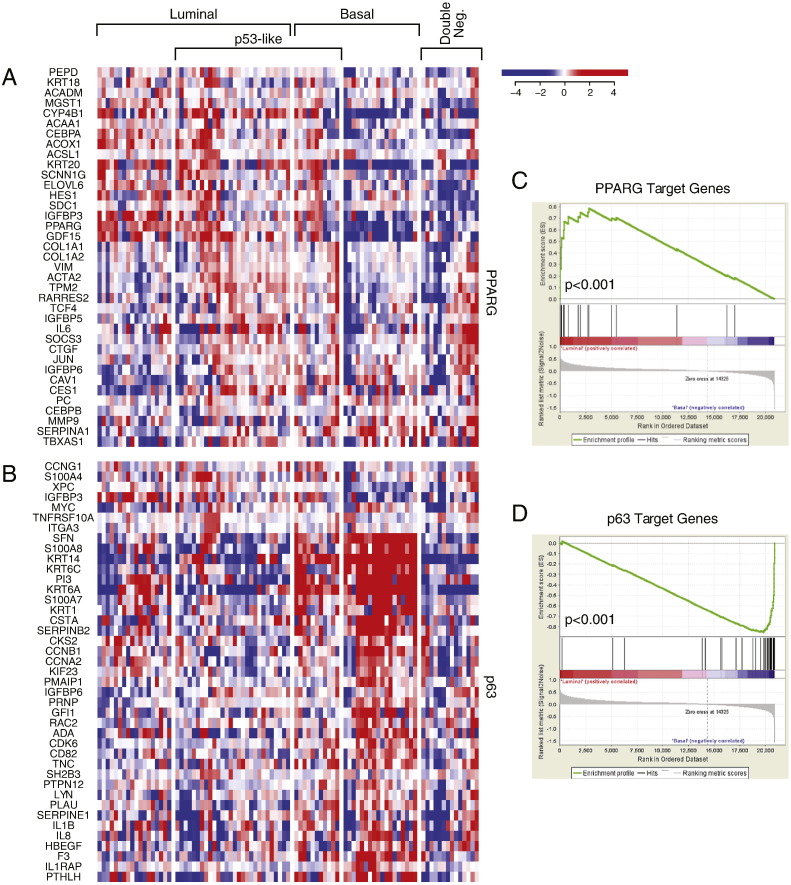
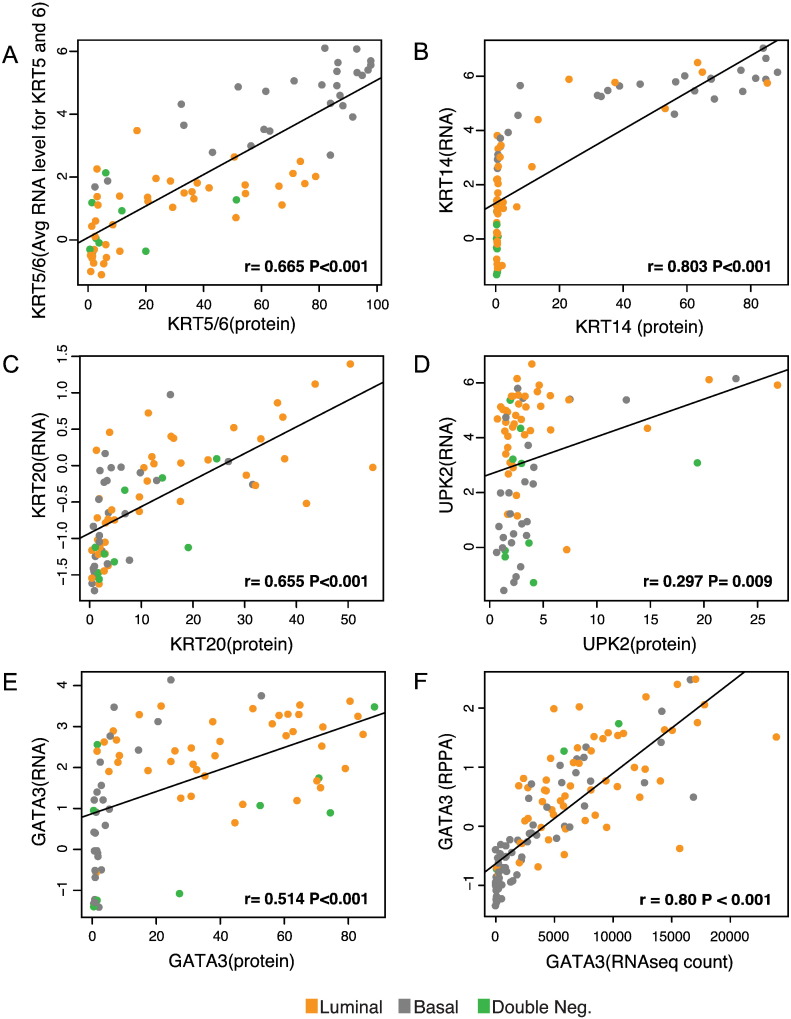
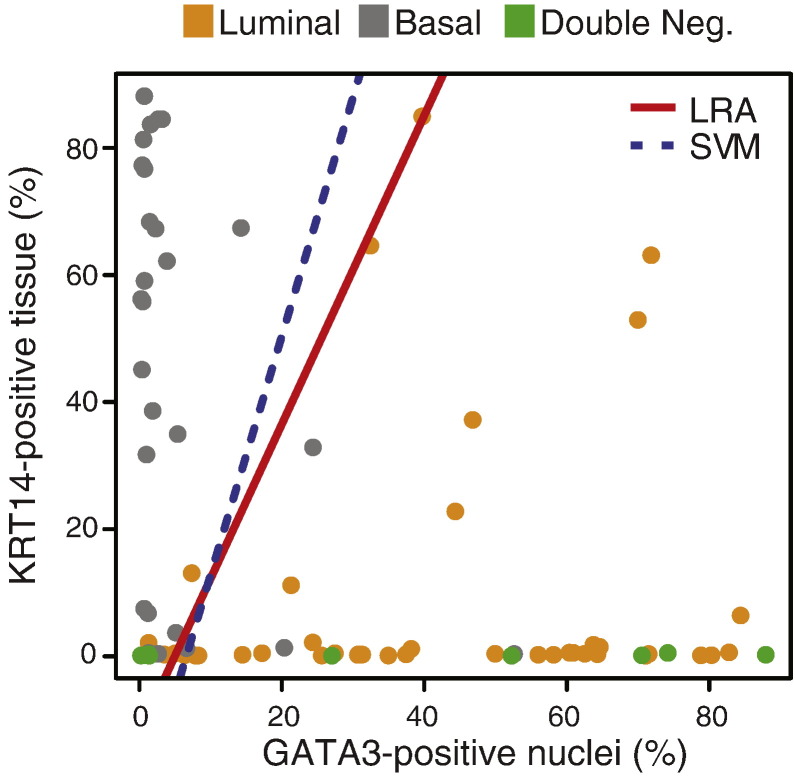
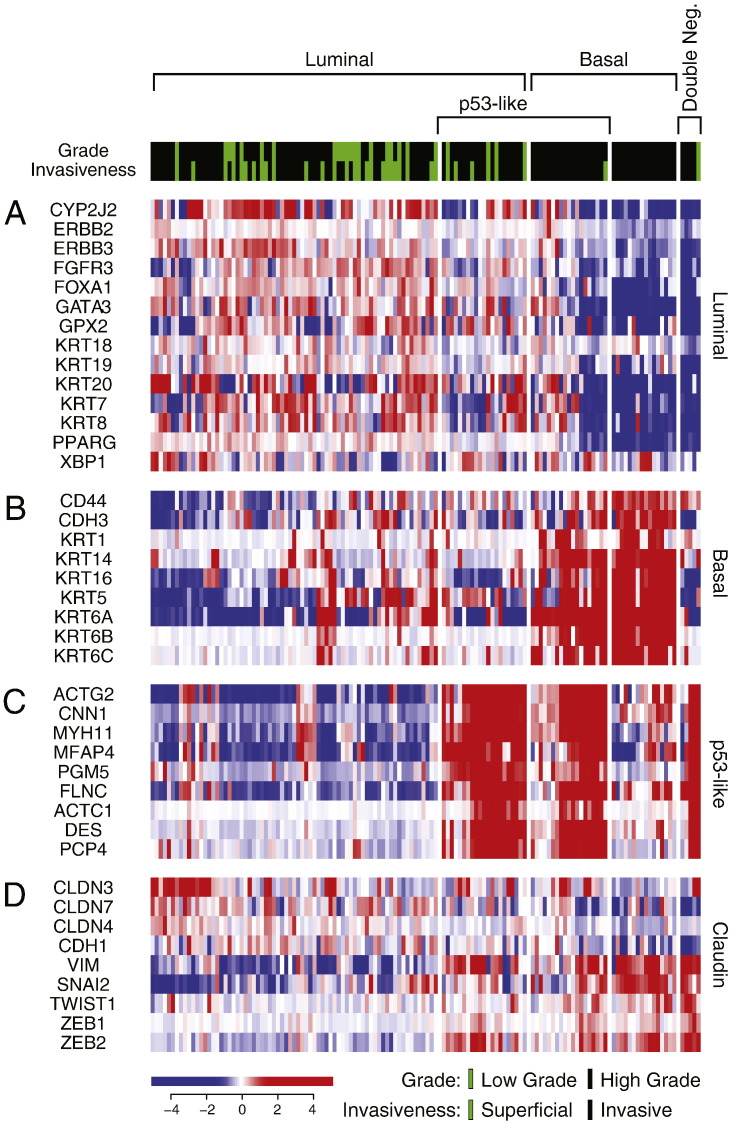
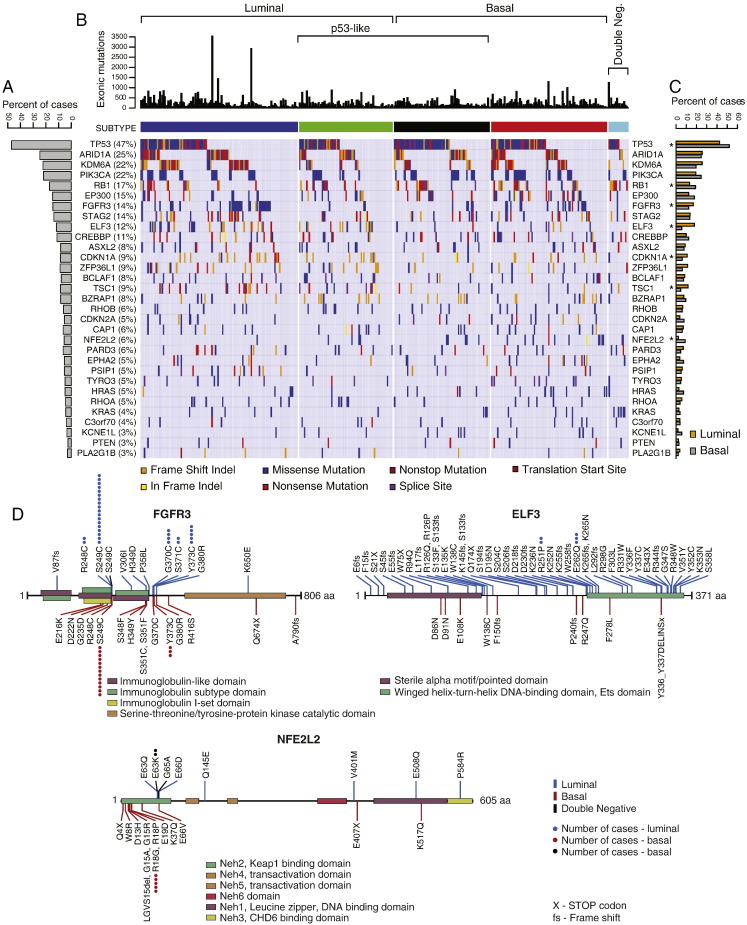
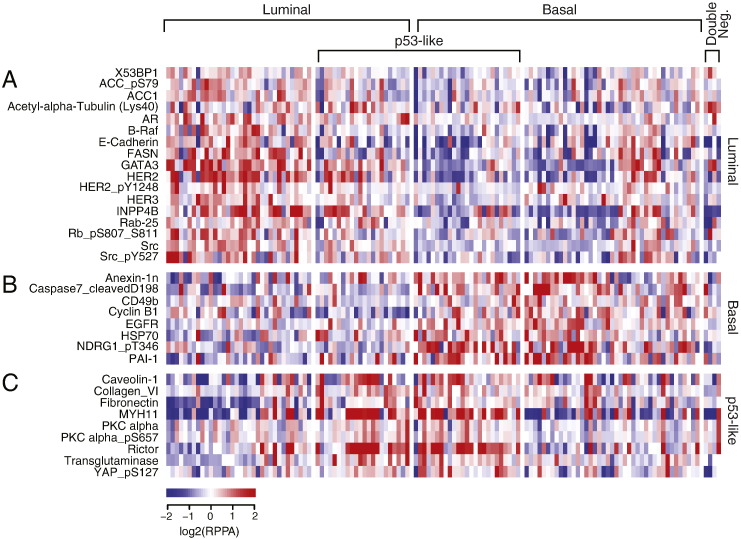
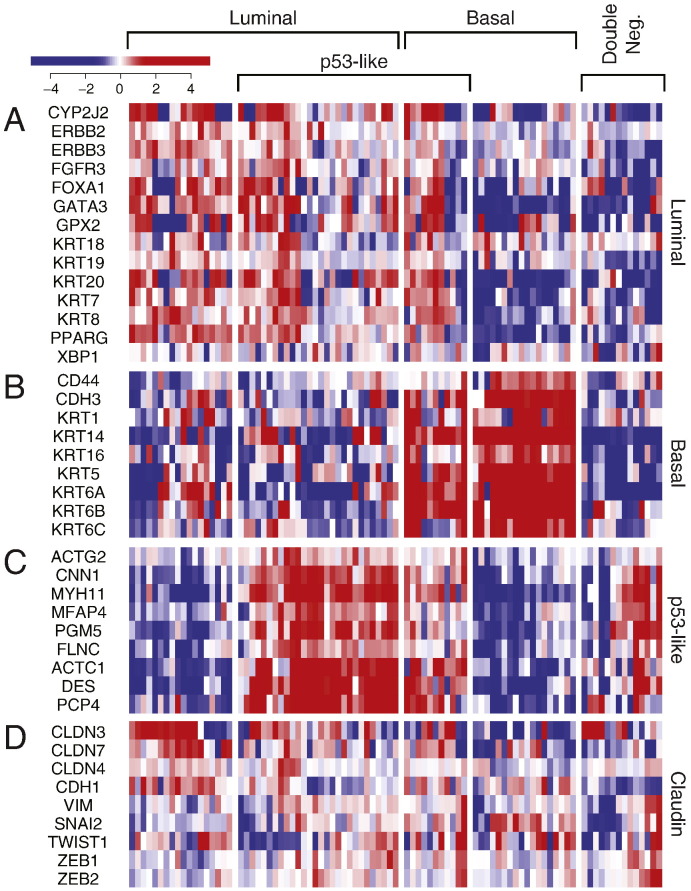
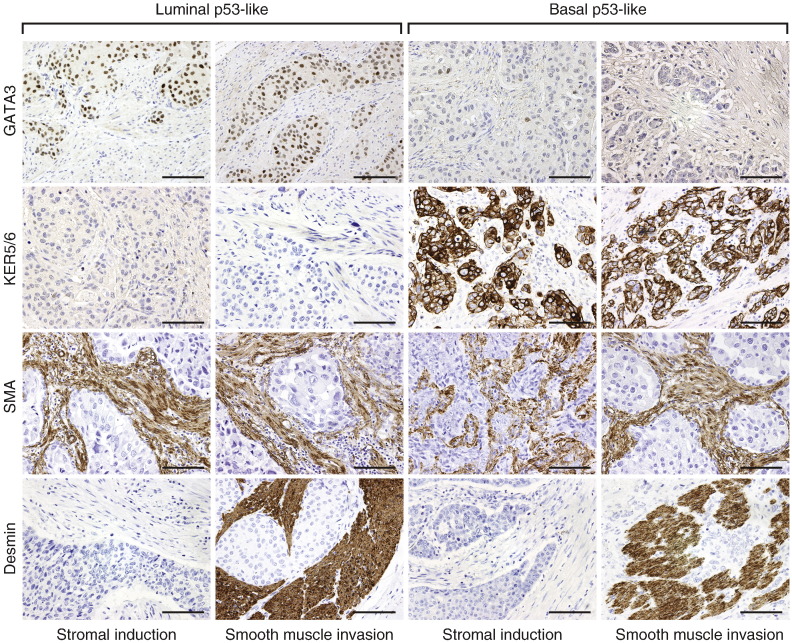
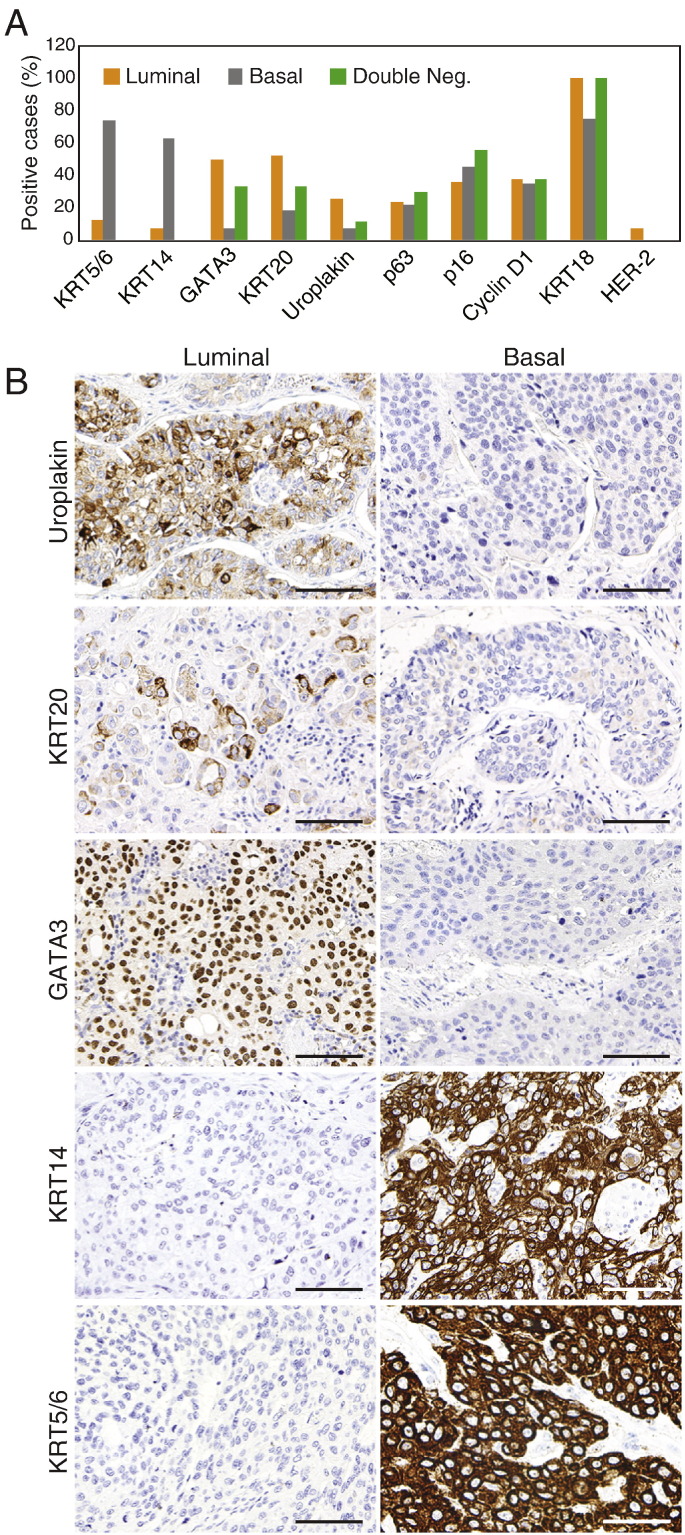
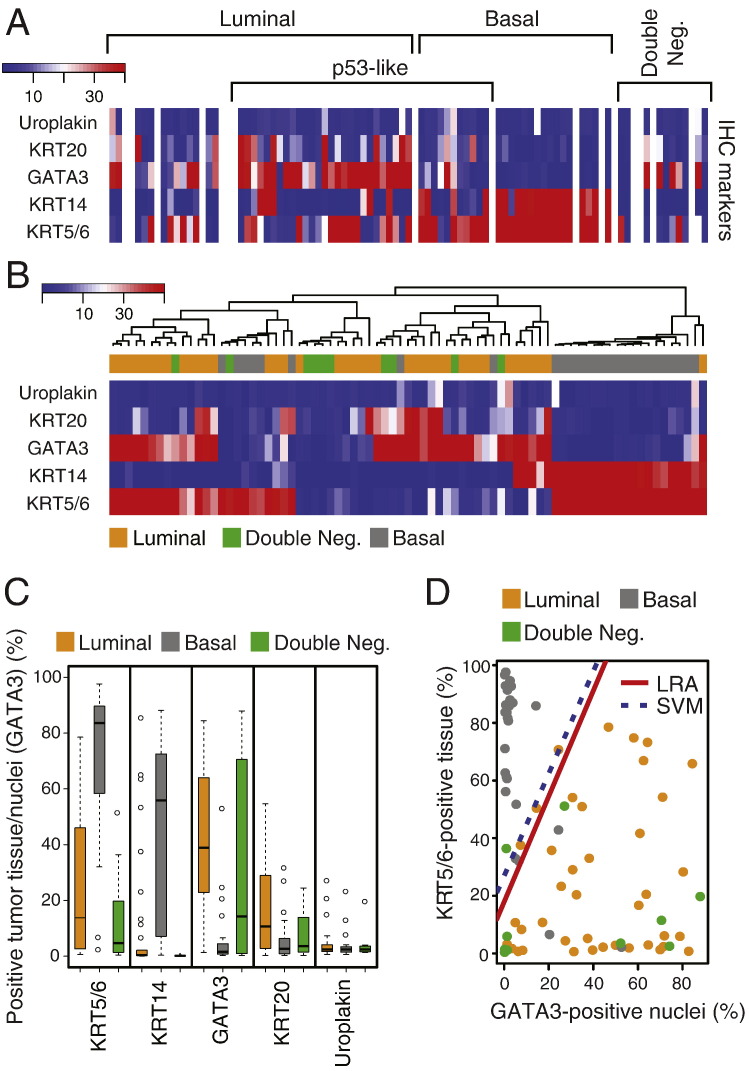
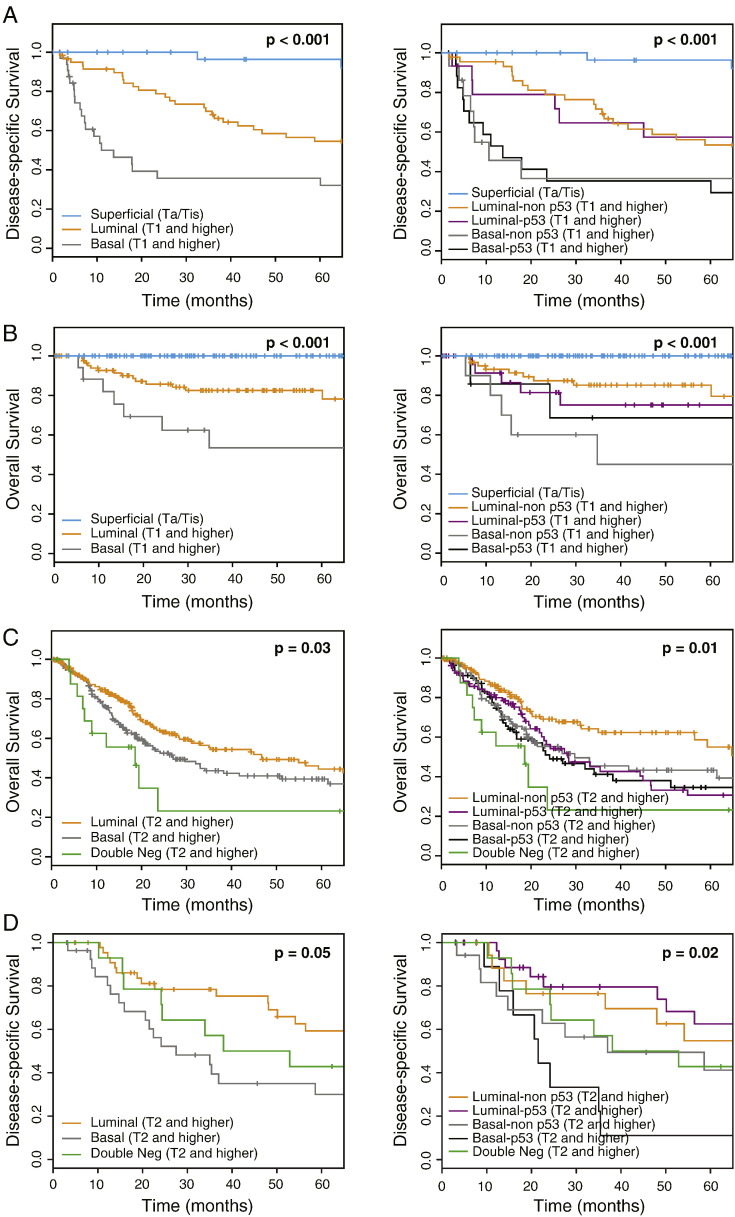
Findings: Bladder cancers could be assigned to two candidate intrinsic molecular subtypes referred to here as luminal and basal in all of the datasets analyzed. Luminal tumors were characterized by the expression signature similar to the intermediate/superficial layers of normal urothelium. They showed the upregulation of PPARγ target genes and the enrichment for FGFR3, ELF3, CDKN1A, and TSC1 mutations. In addition, luminal tumors were characterized by the overexpression of E-Cadherin, HER2/3, Rab-25, and Src. Basal tumors showed the expression signature similar to the basal layer of normal urothelium. They showed the upregulation of p63 target genes, the enrichment for TP53 and RB1 mutations, and overexpression of CD49, Cyclin B1, and EGFR. Survival analyses showed that the muscle-invasive basal bladder cancers were more aggressive when compared to luminal cancers. The immunohistochemical expressions of only two markers, luminal (GATA3) and basal (KRT5/6), were sufficient to identify the molecular subtypes of bladder cancer with over 90% accuracy.

Interpretation: The molecular subtypes of bladder cancer have distinct clinical behaviors and sensitivities to chemotherapy, and a simple two-marker immunohistochemical classifier can be used for prognostic and therapeutic stratification.

Funding: U.S. National Cancer Institute and National Institute of Health.

Keywords: Biomarker; Bladder cancer.


Figures

Fig. S1
Fig. S1
The expression pattern of signature transcriptional regulators in molecular subtypes of bladder cancer in fresh frozen bladder tumor samples of the MD Anderson cohort (n = 132). A. The expression pattern of signature PPARγ target genes. B. The expression pattern of signature p63 target genes. C. PPARγ expression signature in luminal and basal subtypes compared by gene set enrichment analysis (GSEA). D. p63 expression signature in luminal and basal subtypes compared by GSEA.
Fig. S2
Fig. S2
Whole-genome messenger RNA profiling of fresh frozen bladder tumor samples in the Lund cohort (n = 308). Unsupervised hierarchical clustering was performed with luminal, p53-like, basal, and claudin markers. A. The expression pattern of signature luminal markers. B. The expression pattern of signature basal markers. C. The expression pattern of signature p53 target genes. D. The expression pattern of signature claudin target genes.
Fig. S3
Fig. S3
The expression pattern of signature transcription regulators in molecular subtypes of bladder cancer in fresh frozen bladder tumor samples of the Lund cohort (n = 308). A. The expression pattern of PPARγ target genes. B. The expression pattern of p63 target genes. C. PPARγ expression signature in luminal and basal subtypes compared by gene set enrichment analysis (GSEA). D. p63 expression signature in luminal and basal subtypes compared by GSEA.
Fig. S4
Fig. S4
Whole-genome messenger RNA profiling and mutational analysis of fresh frozen bladder tumor samples in the TCGA cohort (n = 408). Unsupervised hierarchical clustering was performed with luminal, p53-like, basal, and claudin markers. A. Expression pattern of signature luminal markers. B. Expression pattern of signature basal markers. C. Expression pattern of signature p53 target genes. D. Expression pattern of signature claudin target genes.
Fig. S5.
Fig. S5
The expression pattern of signature transcription regulators in molecular subtypes of bladder cancer in fresh frozen bladder tumor samples of the TCGA cohort (n = 408). A. The expression pattern of PPARγ target genes. B. The expression pattern of p63 target genes. C. The PPARγ expression signature in luminal and basal subtypes compared by gene set enrichment analysis (GSEA). D. The p63 expression signature in luminal and basal subtypes compared by GSEA.
Fig. S6
Fig. S6
Mutation patterns of the CDKN1A and TSC1 genes in luminal and basal cancers.
Fig. S7
Fig. S7
Mutation patterns of the TP53 and RB1 genes in luminal and basal cancers.
Fig. S8
Fig. S8
The expression pattern of signature transcription regulators in molecular subtypes of bladder cancer in the formalin-fixed and paraffin-embedded MD Anderson cohort (n = 89). A. The expression pattern of PPARγ target genes. B. The expression pattern of p63 target genes. C. PPARγ expression signature in luminal and basal subtypes compared by gene set enrichment analysis (GSEA). D. p63 expression signature in luminal and basal subtypes compared by GSEA.
Fig. S9
Fig. S9
Correlation between mRNA expression levels and their encoded proteins detected by immunohistochemistry and RPPA. A–E. Correlation between mRNA expression level in cDNA microarray and their respective encoded protein detected by immunohistochemistry and quantitative image analysis in tissue microarrays for signature basal and luminal markers (MD Anderson FFPE cohort). F. Correlation between GATA3 mRNA quantitated by RNASeq and its protein quantitated by RPPA (TCGA cohort).
Fig. S10
Fig. S10
Logistic regression and support vector machine analyses using the immunohistochemical levels of two signature luminal (GATA3) and basal (KRT14) markers.
Fig. 1
Fig. 1
Organizational flow-chart of meta-analysis in four cohorts of bladder cancer samples.
Fig. 2
Fig. 2
Whole-genome messenger RNA profiling of fresh frozen bladder tumor samples in the MD Anderson cohort (n = 132). Unsupervised hierarchical clustering was performed with luminal, p53-like, basal, and claudin markers. A. Expression pattern of signature luminal markers. B. Expression pattern of signature basal markers. C. Expression pattern of signature p53 target genes. D. Expression pattern of signature claudin target genes.
Fig. 3
Fig. 3
The mutational landscape of molecular subtypes of bladder cancer of fresh frozen bladder tumor samples in the TCGA cohort (n = 408). A. The proportion of bladder cancer cases with statistically significant levels of mutations (MutSig, false discovery rate < 0.05). B. Mutation types in molecular subtypes of bladder cancer classified according to their expression profiles of luminal and basal markers. C. The proportion of mutations for individual genes in luminal and basal subtypes of bladder cancer. The genes which show statistically significant difference (p < 0.05) in molecular subtypes are indicated by an asterisk. D. Mutation patterns of the FGFR3, ELF3, and NFE2L2 genes in luminal and basal cancers.
Fig. 4
Fig. 4
RPPA heat map showing the expression level of proteins in the TCGA cohort (n = 127). A. Expression patterns of signature proteins in luminal subtypes. B. Expression patterns of signature proteins in basal subtypes. C. Expression patterns of signature proteins in p53-like subtypes.
Fig. 5
Fig. 5
Whole-genome messenger RNA profiling and semi-quantitative immunohistochemical analysis of signature basal and luminal markers in formalin-fixed and paraffin-embedded tumor samples (n = 89) and parallel tissue microarray (n = 76) in the MD Anderson cohort. A. Expression pattern of signature luminal markers. B. Expression pattern of signature basal markers. C. Expression signature of p53 target genes. D. Expression pattern of signature claudin target genes.
Fig. 6
Fig. 6
Immunohistochemical analysis of p53 target markers in molecular subtypes of bladder cancer. Note that in both luminal (GATA3 +; KRT5/6-) and basal (GATA3-; KRT5/6 +) subtypes, the p53-like tumors are showing the expression of SMA or desmin in the stromal component of the tumor while the tumor cells do not express these markers. Scale bars indicate 100 μM.
Fig. 7
Fig. 7
Immunohistochemical analysis of luminal and basal markers in molecular subtypes of bladder cancer. A. Summary of semi-quantitative scoring of immunohistochemical expression levels of signature luminal and basal markers in tissue microarrays. The proportion of positive cases with score 2 + or higher is shown. B. The immunohistochemical expression of signature luminal and basal markers in representative luminal and basal bladder cancers. Scale bars indicate 100 μ.
Fig. 8
Fig. 8
Quantitative image-based immunohistochemical analysis of selected luminal and basal markers in formalin-fixed and paraffin-embedded tumor samples (n = 76) in the MD Anderson cohort. A. Expression levels of selected luminal and basal markers in tissue microarray analyzed by quantitative image analysis. The cases were classified and clustered on the basis of cDNA microarray analysis as shown in Fig. 3A. B. Hierarchical clustering analysis using 20% of tumor tissue positivity and 20% of tumor nuclei positivity as cut-off expression levels of signature luminal and basal markers revealed by immunohistochemistry and analyzed by quantitative image analysis. C. Mean expression levels of signature luminal and basal markers revealed by immunohistochemistry and quantitated by image analysis. D. Logistic regression (LRA) and support vector machine (SVM) analyses using the immunohistochemical levels of two signature markers: luminal (GATA3) and basal (KRT5/6).
Fig. 9
Fig. 9
Survival analyses in four independent cohorts. A. Fresh frozen tumor samples in the MD Anderson cohort (n = 132). B. Fresh frozen tumor samples in the Lund cohort (n = 308). C. Fresh frozen tumor samples in the TCGA cohort (n = 408). D. Formalin-fixed and paraffin-embedded samples in the MD Anderson cohort (n = 89). Left panels in each cohort show the Kaplan-Meier plots of luminal, basal, and double-negative subtypes. Right panels in each cohort show the Kaplan-Meier plots of luminal and basal cancers divided into non-p53-like and p53-like subtypes. The superficial non-invasive tumors in the fresh frozen tumor samples of the MD Anderson and the Lund cohorts were analyzed as a separate group. The survival analyses for the double-negative group were not performed in the fresh frozen tumor samples of the MD Anderson and the Lund cohorts because of the insufficient number of cases for follow-up data.

References

    1. Aine M., Eriksson P., Liedberg F., Sjodahl G., Hoglund M. Biological determinants of bladder cancer gene expression subtypes. Sci. Rep. 2015;5:10957. - PMC - PubMed
    1. Cancer Genome Atlas Research N Comprehensive molecular characterization of urothelial bladder carcinoma. Nature. 2014;507(7492):315–322. - PMC - PubMed
    1. Cheng T., Roth B., Choi W., Black P.C., Dinney C., McConkey D.J. Fibroblast growth factor receptors-1 and -3 play distinct roles in the regulation of bladder cancer growth and metastasis: implications for therapeutic targeting. PLoS One. 2013;8(2) - PMC - PubMed
    1. Choi W., Czerniak B., Ochoa A. Intrinsic basal and luminal subtypes of muscle-invasive bladder cancer. Nat. Rev. Urol. 2014;11(7):400–410. - PubMed
    1. Choi W., Porten S., Kim S. Identification of distinct basal and luminal subtypes of muscle-invasive bladder cancer with different sensitivities to frontline chemotherapy. Cancer Cell. 2014;25(2):152–165. - PMC - PubMed

Publication types

MeSH terms

Substances