

Lipid profile status and other related factors in patients with Hyperphenylalaninaemia
- PMID: 27612877
- PMCID: PMC5016957
- DOI: 10.1186/s13023-016-0508-x
Lipid profile status and other related factors in patients with Hyperphenylalaninaemia
Abstract
Background: The mainstay of treating patients with phenylketonuria (PKU) is based on a Phe-restricted diet, restrictive in natural protein combined with Phe-free L-amino acid supplements and low protein foods. This PKU diet seems to reduce atherogenesis and confer protection against cardiovascular diseases but the results from the few published studies have been inconclusive. The aim of our study was to evaluate the relationship between the lipid profile and several treatment-related risk factors in patients with hyperphenylalaninaemia (HPA) in order to optimize their monitoring.
Methods: We conducted a cross-sectional multicentre study. A total of 141 patients with HPA were classified according to age, phenotype, type of treatment and dietary adherence. Annual median blood phenylalanine (Phe) levels, Phe tolerance, anthropometric measurements, blood pressure (BP) and biochemical parameters [(triglycerides, total cholesterol (TC), high-density lipoprotein cholesterol (HDL-C), low density lipoprotein-cholesterol (LDL-C), apolipoprotein A (ApoA), apolipoprotein B (ApoB), vitamin B12, total homocysteine (tHcy), Methionine (Met), high sensitivity C-Reactive Protein (hsCRP)] were collected for each patient.
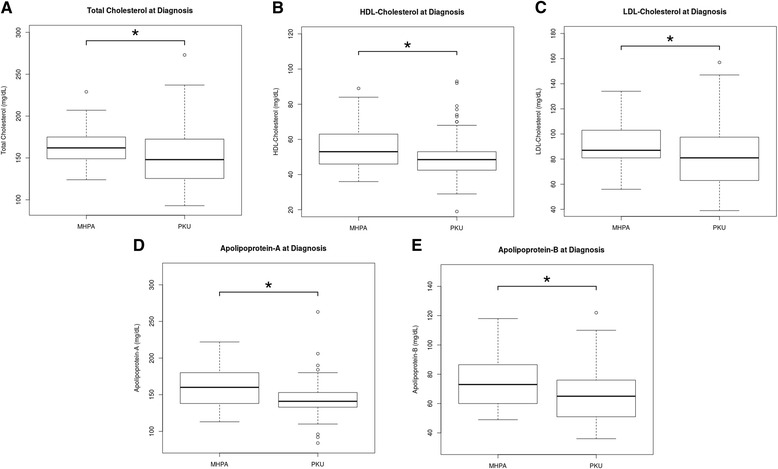
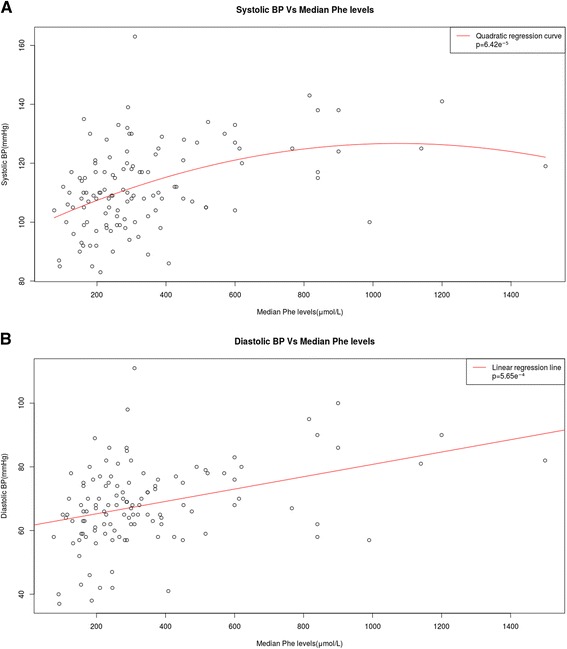
Results: Plasma TC levels were lower in patients with PKU than in the mild-HPA group (150 ± 31 vs. 164 ± 22 mg/dL), and there was a weak inverse correlation between plasma TC and Phe levels. HDL-C, LDL-C, ApoA and ApoB levels were lower in the PKU group than in mild-HPA. Patients with PKU had higher systolic BP than the mild-HPA group and there was found a quadratic correlation between median Phe levels and systolic BP (p = 6.42e(-5)) and a linear correlation between median Phe levels and diastolic BP (p = 5.65e(-4)). In overweight or obese PKU patients (24.11 %), biochemical parameters such as TC, triglycerides, LDL-C, tHcy, hsCRP and BP were higher. By contrast, HDL-C was lower in these patients.
Conclusion: Our data show a direct correlation between lipid profile parameters and good adherence to the diet in PKU patients. However, lipid profile in overweight or obese patients displayed an atherogenic profile, in addition to higher hsCRP concentrations and BP. Our study contributes to a better understanding of the relationship between phenotype and treatment in patients with HPA, which could be useful in improving follow-up strategies and clinical outcome.
Trial registration: Research Ethics Committee of Santiago-Lugo 2015/393. Registered 22 September 2015, retrospectively registered.
Keywords: Atherogenic profile; Blood pressure; Coronary heart disease; Homocysteine; Lipoprotein; Phenylketonuric dietary treatment.
Figures
 ) and phenylketonuria (
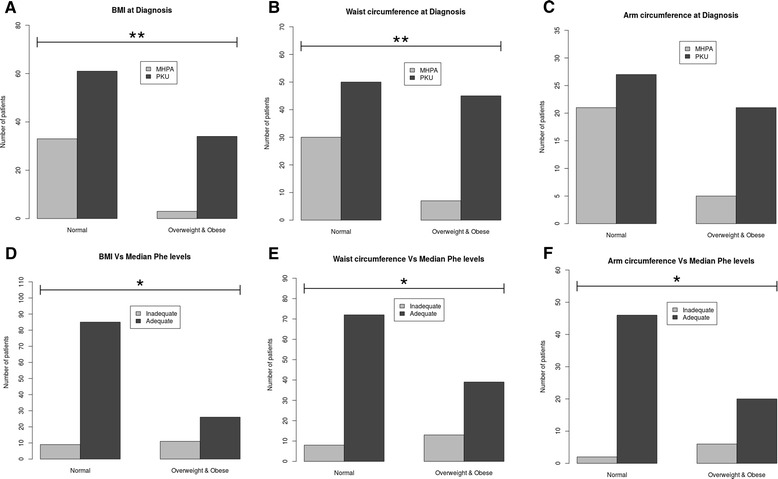
 ). d Body mass index Z-score, e) Waist circumference and f) Arm circumference in relation with median Phe levels (μmol/L) in patients with poor (
 ) and good (
 ) metabolic control. Statistical significance was observed: * p < 0.05 and ** p < 0.01, using the Fisher’s exact test and the Benjamini-Hochberg correction. PKU: phenylketonuria; MHPA: mild hyperphenylalaninaemia; BMI: body max index; Phe: phenylalanine
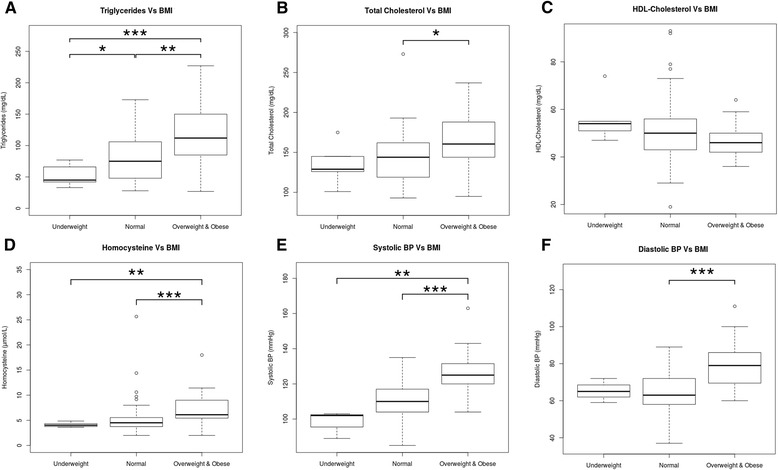
References
-
- Martínez-Pardo M, Marchante C, Dalmau J, Pérez M, Bellón C. Protocolo de diagnóstico, tratamiento y seguimiento de las hiperfenilalaninemias. An Esp Pediatr. 1998;114:3–18.
Publication types
MeSH terms
Substances
LinkOut - more resources
Full Text Sources
Other Literature Sources
Medical
Research Materials
Miscellaneous
