Review
. 2016 Oct;408(25):6885-911.
doi: 10.1007/s00216-016-9781-8. Epub 2016 Sep 9.

From single molecules to life: microscopy at the nanoscale

Affiliations
Review

From single molecules to life: microscopy at the nanoscale

Bartosz Turkowyd et al. Anal Bioanal Chem. 2016 Oct.

Abstract

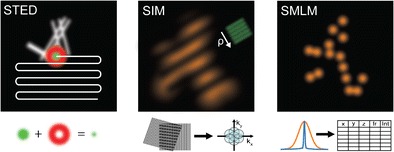
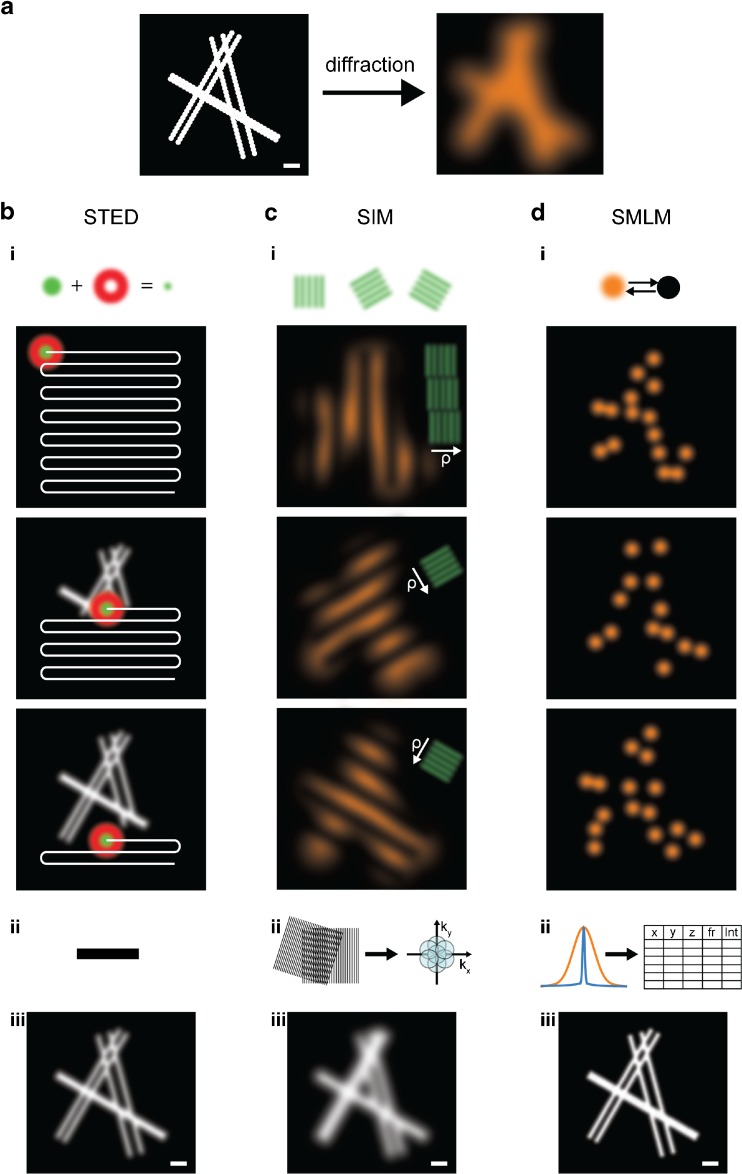
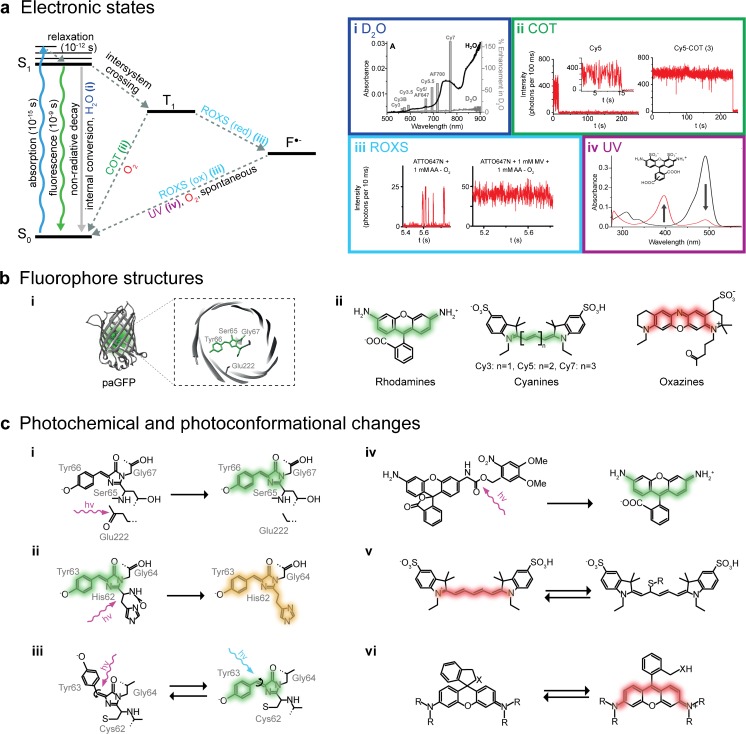
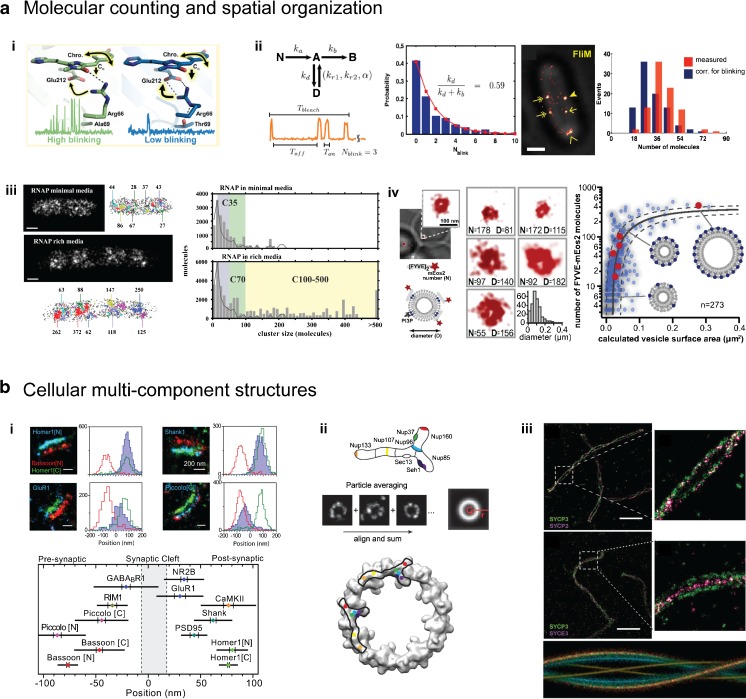
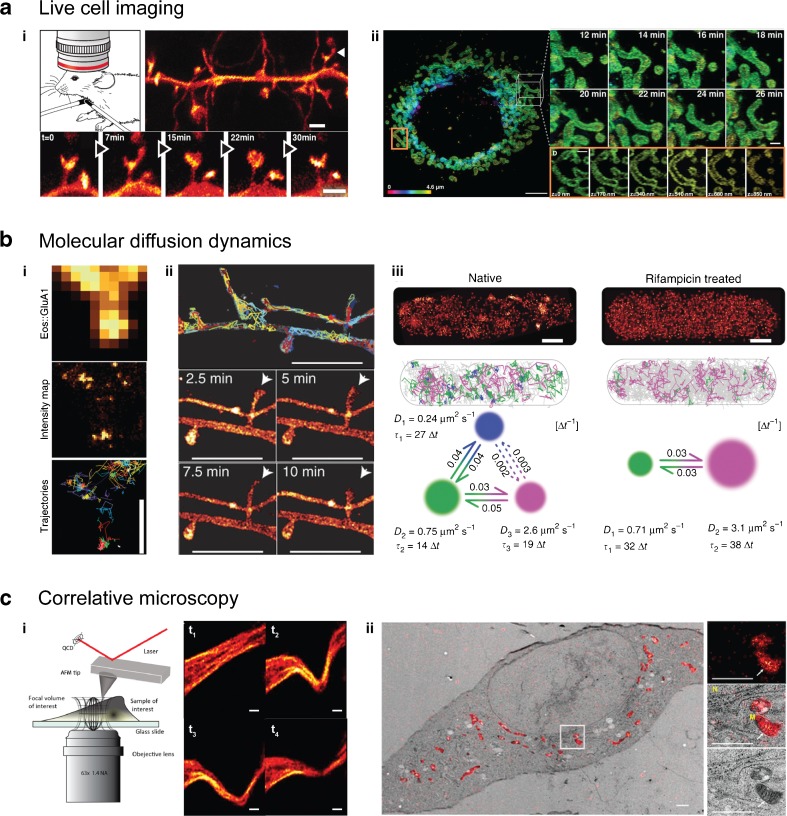
Super-resolution microscopy is the term commonly given to fluorescence microscopy techniques with resolutions that are not limited by the diffraction of light. Since their conception a little over a decade ago, these techniques have quickly become the method of choice for many biologists studying structures and processes of single cells at the nanoscale. In this review, we present the three main approaches used to tackle the diffraction barrier of ∼200 nm: stimulated-emission depletion (STED) microscopy, structured illumination microscopy (SIM), and single-molecule localization microscopy (SMLM). We first present a theoretical overview of the techniques and underlying physics, followed by a practical guide to all of the facets involved in designing a super-resolution experiment, including an approachable explanation of the photochemistry involved, labeling methods available, and sample preparation procedures. Finally, we highlight some of the most exciting recent applications of and developments in these techniques, and discuss the outlook for this field. Graphical Abstract Super-resolution microscopy techniques. Working principles of the common approaches stimulated-emission depletion (STED) microscopy, structured illumination microscopy (SIM), and single-molecule localization microscopy (SMLM).

Keywords: Live cell imaging; Photophysics and photochemistry of fluorophores; Quantitative cell biology; Super-resolution microscopy.


Conflict of interest statement

The authors declare that they have no conflict of interest.

Figures

Graphical Abstract
Graphical Abstract
Super-resolution microscopy techniques. Working principles of the common approaches stimulated-emission depletion (STED) microscopy, structured illumination microscopy (SIM), and single-molecule localization microscopy (SMLM).
Fig. 1a–b
Fig. 1a–b
Spatial and temporal scales in the life sciences and microscopy. a Selected characteristic submicrometer objects are separated on the basis of biological (above the axis, green) and technical (below the axis, blue) significance. The IgG antibody structure (15 nm) contains two other notable structures: the antigen-binding region, called the Fab fragment (10 nm, blue) and the single-variable domain (3 nm, red), from which so-called nanobodies from cameloids are derived. Structures are taken from the PDB [GFP 1KYS, IgG 1IGT, SNAP 3KZZ, DNA 4LEY] and PubChem [ATP CID 5957, Alexa Fluor 647 CID 102227060]. b Timescales of various important biological processes (above the axis, green) and physical events, as well as typical timescales associated with microscopy procedures (below the axis, blue)
Fig. 2a–d
Fig. 2a–d
Principles of super-resolution microscopy techniques. a Left: Scheme of six filaments decorated with fluorophores (represented by large icons for visibility) and grouped into three pairs at simulated distances of 50, 100, and 150 nm; scale 200 nm. Right: A typical image of this structure obtained by conventional fluorescence microscopy is limited by the diffraction of light. b i, top: For STED, the structure is scanned by a subdiffraction excitation spot obtained by combining an excitation laser (green) with a, by phase-modulation shaped, depletion laser (red). After scanning the entire structure (i, bottom), and without performing any further post-processing steps (ii), an image is reconstructed (iii). c In SIM, fluorophores are excited by a series of regularly spaced illumination patterns of known frequency, orientation, and phase which modulate the fluorophore emissions. This results in visible low-frequency Moiré patterns that are dependent on the structure imaged (i). By analyzing the images for their spatial frequencies, an enlarged frequency space is obtained (ii), and a subdiffraction image is reconstructed (iii). d In SMLM, the fluorescence is modulated by photoswitching between “off” and “on” states. Most of the fluorophores are forced to reside in a dark off state; only a small subset of spatially separated fluorophores in the on state is allowed to emit fluorescence at a given time. After sequentially imaging thousands of subsets of fluorophores (i), the nanometer-precise fluorophore positions can be extracted from the diffraction-limited individual emissions (ii), and an image is reconstructed (iii). The three super-resolved images labeled (iii) visualize typical resolutions obtained by the methods: on the order of 50 nm (STED), 100 nm (SIM), and 20 nm (SMLM); scale 200 nm
Fig. 3a–b
Fig. 3a–b
Photophysics and photochemistry of fluorophores. a Left: Jabłoński energy diagram representing energy states and transitions of a fluorophore. S 0 ground singlet state, S 1 excited singlet state, T 1 triplet state, F ●− radical state. Different compounds can affect brightness and photostability or shift the fluorophore into a radical state. (i) absorption spectra of H2O and D2O, and correlated enhancements of the fluorescence emissions of different fluorophores in D2O versus H2O for the visible range of light. Adapted from [72] with permission. (ii) Cyclooctatetraene (COT) quenches the triplet state by quickly transferring fluorophores back into the ground state and thus stabilizes the fluorescence. Adapted with permission from [73]. (iii) A reducing and oxidizing system (ROXS) accelerates the transition of a fluorophore from its triplet state back to the electronic ground state by performing fast sequential reducing and oxidizing steps. Adapted with permission from [74]. (iv) The radical states of some dyes (e.g., the Alexa Fluor 488 fluorophore, as shown in black here; red indicates the radical) possess an absorption peak in the UV range. By exciting the radicals with UV light to higher intermediate states, they can be quickly brought back down to their electronic ground state. Adapted with permission from [75]. b Different fluorophore structures: (i) Barrel structure of the photoactivatable green fluorescent protein (paGFP) and a close-up of its chromophore. (ii) Overview of organic dye classes. c Different photochemical and conformational changes that affect fluorescence: (i) photoactivation of paGFP [76], (ii) green-to-red photoconversion of mEos2 [77], (iii) reversible cis/trans-photoswitching of Dronpa [78], (iv) cleavage of a photocage from a rhodamine [79], (v) reversible fluorescence quenching of Cy5 by covalent binding of a thiol [80], and (vi) reversible cyclization of rhodamine HMSiR [81]
Fig. 4a–b
Fig. 4a–b
Quantitative super-resolution microscopy. a SMLM allows the stoichiometry of a molecule to be determined, with several over- or undercounting effects taken into account. (i) The photochemical properties of fluorescent proteins lead to specific blinking and bleaching behaviors. The high-blinking and fast-bleaching behaviors shown by mEos2 (left) and Dendra2 (right), respectively, are largely determined by the orientation of the single residue arginine 66. Reprinted with permission from [191]. (ii) Fluorophore blinking behavior can be corrected for using kinetic fluorophore schemes. In this strategy, the number of FliM proteins per flagellar motor is counted in vivo. Reprinted from [192]. (iii) Spatial organization of E. coli RNA polymerases under minimal as well as rich growth conditions. Reprinted with permission from [193]. (iv) Maturation of endocytic vesicles into late endosomes. Reprinted from [194]. (b) Structural super-resolution microscopy reveals the molecular architecture of cellular multicomponent complexes. (i) Mutual organization of various pre- and postsynaptic proteins in relation to the proteins Bassoon and Homer1. Reprinted with permission from [139]. (ii) Combining data from identical particles yields a high-resolution average. Systematic SMLM imaging of the Y-shaped subunit of the nuclear pore complex allows it to be aligned onto the electron density of the nuclear pore (bottom). Reprinted with permission from [104]. (iii) Aligning different pairs of synaptonemal proteins onto a helical template yields the three-dimensional model of the synaptonemal complex with isotropic resolution. Reprinted from [105]. Scale bars: a ii and a iii 500 nm; a iv 100 nm; b i 200 nm; b iii 2 μm
Fig. 5a–c
Fig. 5a–c
Advanced dynamic and correlative super-resolution microscopy approaches. a Live imaging has been successfully performed on living cells and mammals. (i) STED microscopy of the dynamics of dendritic spines (arrows) in the visual cortex of living, YFP-transgenic, anesthetized mouse. Reprinted with permission from [203]. (ii) Mitochondrial fusion and fission dynamics imaged over a period of several tens of minutes by nonlinear SIM in lattice light sheet configuration. Reprinted with permission from [13]. b Single-particle tracking schemes elucidate molecular diffusional dynamics. (i) High-density tracking of AMPA receptors reveals confined nanodomains in the postsynaptic regions. Reprinted with permission from [204]. (ii) In contrast, membrane-bound GPI demonstrates a more homogeneous diffusion. Reprinted with permission from [4]. (iii) Bayesian hidden Markov model assessment of Hfq protein dynamics in E. coli cells. When mRNA synthesis is inhibited, the fraction of Hfq-binding mRNA (state of slowest diffusion) disappears. Reprinted with permission from [205]. c Correlative microscopy allows diverse features of a sample to be measured. (i) STED microscopy combined with atomic force microscopy (AFM) visualizes the response of the cytoskeleton upon nanomanipulation by the AFM tip. Reprinted with permission from [206]. (ii) Correlative PALM and electron microscopy of the mitochondrially targeted fluorescent protein mEos4 verifies its intact photoconversion and fluorescence under heavy osmium tetroxide fixation. Reprinted by permission from [114]. Scales: a i 1 μm; a ii 5 μm (left) and 1 μm (right); b i 800 nm; b ii 2 μm; b iii 500 nm; c i 2 μm, c ii 1 μm

Similar articles

Cited by

References

    1. Liu Z, Lavis LD, Betzig E. Imaging live-cell dynamics and structure at the single-molecule level. Mol Cell. 2015;58(4):644–59. doi: 10.1016/j.molcel.2015.02.033. - DOI - PubMed
    1. Hell SW, Sahl SJ, Bates M, Zhuang XW, Heintzmann R, Booth MJ et al. The 2015 super-resolution microscopy roadmap. J Phys D Appl Phys. 2015;48(44). doi:10.1088/0022-3727/48/44/443001.
    1. Winter PW, Shroff H. Faster fluorescence microscopy: advances in high speed biological imaging. Curr Opin Chem Biol. 2014;20:46–53. doi: 10.1016/j.cbpa.2014.04.008. - DOI - PMC - PubMed
    1. Ries J, Kaplan C, Platonova E, Eghlidi H, Ewers H. A simple, versatile method for GFP-based super-resolution microscopy via nanobodies. Nat Methods. 2012;9(6):582–4. doi: 10.1038/nmeth.1991. - DOI - PubMed
    1. Vreja IC, Nikic I, Gottfert F, Bates M, Krohnert K, Outeiro TF, et al. Super-resolution microscopy of clickable amino acids reveals the effects of fluorescent protein tagging on protein assemblies. ACS Nano. 2015;9(11):11034–41. doi: 10.1021/acsnano.5b04434. - DOI - PubMed

Substances