. 2016 Sep 12:6:32969.
doi: 10.1038/srep32969.

Effect of X-ray irradiation on ancient DNA in sub-fossil bones - Guidelines for safe X-ray imaging

Affiliations

Effect of X-ray irradiation on ancient DNA in sub-fossil bones - Guidelines for safe X-ray imaging

Alexander Immel et al. Sci Rep. .

Abstract

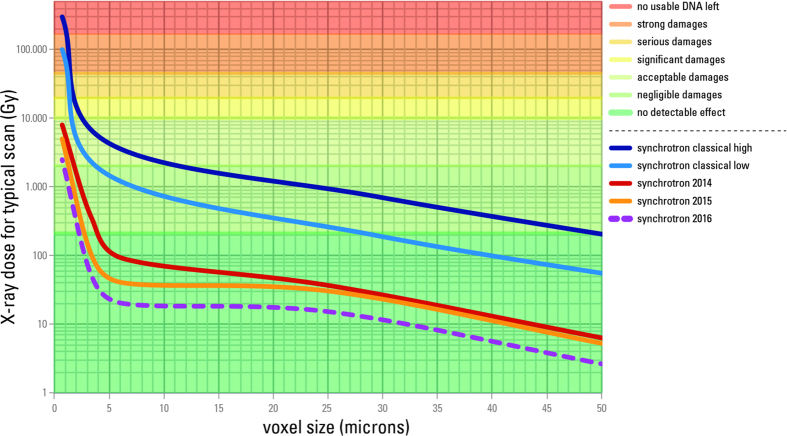
Sub-fossilised remains may still contain highly degraded ancient DNA (aDNA) useful for palaeogenetic investigations. Whether X-ray computed [micro-] tomography ([μ]CT) imaging of these fossils may further damage aDNA remains debated. Although the effect of X-ray on DNA in living organisms is well documented, its impact on aDNA molecules is unexplored. Here we investigate the effects of synchrotron X-ray irradiation on aDNA from Pleistocene bones. A clear correlation appears between decreasing aDNA quantities and accumulating X-ray dose-levels above 2000 Gray (Gy). We further find that strong X-ray irradiation reduces the amount of nucleotide misincorporations at the aDNA molecule ends. No representative effect can be detected for doses below 200 Gy. Dosimetry shows that conventional μCT usually does not reach the risky dose level, while classical synchrotron imaging can degrade aDNA significantly. Optimised synchrotron protocols and simple rules introduced here are sufficient to ensure that fossils can be scanned without impairing future aDNA studies.


Figures

Figure 1
Figure 1. aDNA quantitation of 11 ancient samples after exposure to a radiation dose of 170 kGy.
Each column represents a mean copy number obtained from aliquots of two independent DNA-libraries made for each sample. “scan”: scanned aliquot, “no scan”: non-scanned control, “EB”: extraction blank, “LB”: library blank. Copy numbers were normalised by the amount of extract included in each library and mean copy numbers were calculated from both libraries. Values and standard deviation are shown on a logarithmic scale.
Figure 2
Figure 2. qPCR-based DNA quantitation after irradiation from 0 to 93.72 kGy.
Normalised mean aDNA amounts are plotted against cumulative radiation dose received after 0 s (0 Gy), 2.2 s (~206 Gy), 10 s (~937 Gy), 21.5 s (~2.02 kGy), 46.4 s (~4.35 kGy), 100 s (~9.37 kGy), 215.4 s (~20.2 kGy), 464.2 s (~43.5 kGy) and 1000 s (~93.72 kGy). The non-scanned control is represented as a grey circle, the scans as blue circles. Values were normalised by the amount of extracted material and the corresponding non-scanned controls. Mean copy numbers were then obtained per exposure time group consisting of two aliquots from independent DNA-libraries.
Figure 3
Figure 3. aDNA fragment lengths determined after irradiation from 0 to 43.5 kGy.
Normalised mean fragment lengths are plotted against cumulative radiation dose received after 0 s (0 Gy), 2.2 s (~206 Gy), 10 s (~937 Gy), 21.5 s (~2.02 kGy), 46.4 s (~4.35 kGy), 100 s (~9.37 kGy), 215.4 s (~20.2 kGy) and 464.2 s (~43.5 kGy). The non-scanned control is represented as a grey circle, the scans as blue circles. (a) Mean fragment lengths are calculated for endogenous aDNA fragments only, as determined by mtDNA mapping. (b) Mean fragment lengths are calculated for total DNA including those fragments that did not map to the corresponding mitochondrial reference sequence. Values were normalised using the means of the corresponding non-scanned control aliquots, and averaged per exposure time group consisting of two aliquots from independent DNA-libraries.
Figure 4
Figure 4. X-ray-induced effects on aDNA nucleotide misincorporation patterns for the first 25 positions from both ends of the molecule.
(a) The misincorporation frequencies of the non-scanned controls are shown as a green line. Lower frequencies (red line) of C to T substitutions at the 5′ ends and G to A substitutions at the 3′ ends can be observed after irradiation at 43.5 kGy, since the fraction of aDNA fragments without terminal nucleotide misincorporations increases through exposure. (b) Normalised C to T substitution frequencies of the 1st position from 5′ end of endogenous DNA molecules are plotted against cumulative radiation dose received after 0 s (0 Gy), 2.2 s (~206 Gy), 10 s (~937 Gy), 21.5 s (~2.02 kGy), 46.4 s (~4.35 kGy), 100 s (~9.37 kGy), 215.4 s (~20.2 kGy) and 464.2 s (~43.5 kGy). The non-scanned control is represented as a grey circle, the scans as blue circles. Substitution frequencies were normalised by the corresponding non-scanned controls, and averaged per exposure time group consisting of two aliquots from independent DNA-libraries.
Figure 5
Figure 5. aDNA quantitation, fragment length and misincorporation pattern analyses after high quality imaging synchrotron scan.
(a) aDNA quantitation after exposure to 720 Gy during a real synchrotron μCT scan. “scan”: number of aDNA molecules after scanning the aliquot with 720 Gy, “no scan”: non-scanned control. Values were normalised by the amount of extracted material. (b) aDNA fragment lengths after exposure to 720 Gy (“scan”) and non-scanned controls (“no scan”). For each aliquot boxplots were generated from fragment lengths of the total DNA content including those fragments that did not map to the target organism’s (here: cave bear) mtDNA. P-values were obtained for each pair of scanned and non-scanned aliquots using Student’s t-test to assess significant differences in mean fragment lengths. The median fragment length is shown in the upper quartile and the computed λ-based average fragment length is shown in the lower quartile of the boxplot. (c) Boxplots were generated only from endogenous (mapped) aDNA molecule fragment lengths. The median fragment length is shown in the upper quartile and the computed λ-based average fragment length is shown in the lower quartile. Sample 21 was discarded because of a low number of mapped reads (<1000). (d) C to T substitution frequencies of the 1st position from the 5′ end of endogenous aDNA molecules mapped against cave bear mtDNA after X-ray exposure to 720 Gy. The values were normalised by their corresponding non-scanned controls.
Figure 6
Figure 6. Summary of effects of X-ray dose on aDNA quantity, molecule length and C to T misincorporation frequencies.
Coloured lines represent the evaluated risk for the interval between two dose levels. Shown are normalised values corresponding to each applied X-ray surface dose. Normalisation was done by the corresponding non-scanned aliquot. A lower value indicates a more deleterious effect. No effect for dose below 200 Gy could be detected.
Figure 7
Figure 7. Synchrotron X-ray dose and associated aDNA damages.
Typical water surface equivalent X-ray dose per scan and associated damages to aDNA depending on voxel size for synchrotron tomography configurations at the ESRF. Thanks to strong efforts to reduce dose since 2013, the average dose level was reduced by factor 30 in 2014, a factor 62 in 2015, and has reached a factor 125 in early 2016.
Figure 8
Figure 8. Conventional μCT X-ray dose and associated aDNA damages.
Typical water surface equivalent X-ray dose and associated degradation level of aDNA for conventional μCT experiments depending on source parameters, filters, voxel size and scan duration. Plain curves represent typical scanning settings at the MPI-EVA and the ESRF. The dashed curve for ESRF ID19-beamline is calculated based on dose measurements to show the effect of using no filter or thin filter. Only scans without filters, especially repetitions of such scans, can lead to substantial degradation of aDNA. The dose profile of ESRF current configurations is given for comparative purpose.

References

    1. Hublin J. J. et al.. Suggested guidelines for invasive sampling of hominid remains. J Hum Evol 55, 756–757 (2008). - PubMed
    1. Richards G. D., Jabbour R. S., Horton C. F., Ibarra C. L. & MacDowell A. A. Color changes in modern and fossil teeth induced by synchrotron microtomography. Am J Phys Anthropol 149, 172–180 (2012). - PubMed
    1. Tafforeau P. & Smith T. M. Nondestructive imaging of hominoid dental microstructure using phase contrast X-ray synchrotron microtomography. J Hum Evol 54, 272–278 (2008). - PubMed
    1. Grosovsky A. J., de Boer J. G., de Jong P. J., Drobetsky E. A. & Glickman B. W. Base substitutions, frameshifts, and small deletions constitute ionizing radiation-induced point mutations in mammalian cells. Proc Natl Acad Sci USA 85, 185–188 (1988). - PMC - PubMed
    1. Teoule R. Radiation-induced DNA damage and its repair. Int J Radiat Biol Relat Stud Phys Chem Med 51, 573–589 (1987). - PubMed

Publication types