Dynamics of surface evolution in semiconductor thin films grown from a chemical bath
- PMID: 27615367
- PMCID: PMC5018873
- DOI: 10.1038/srep33136
Dynamics of surface evolution in semiconductor thin films grown from a chemical bath
Abstract
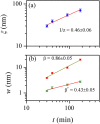
Dynamics of surface evolution in CdS thin films grown by chemical bath deposition technique has been studied from time sequence of atomic force micrographs. Detailed scaling analysis of surface fluctuation in real and Fourier space yielded characteristic exponents αloc = 0.78 ± 0.07, α = 2.20 ± 0.08, αs = 1.49 ± 0.22, β = 0.86 ± 0.05 and βloc = 0.43 ± 0.10, which are very different from those predicted by the local growth models and are not related to any known universality classes. The observed anomalous scaling pattern, characterized by power law scaling dependence of interface width on deposition time differently at local and global scale, with rapid roughening of the growth front has been discussed to arise as a consequence of a nonlocal effect in the form of diffusional instability.
Figures


References
-
- Barabási L. & Stanley H. E. Fractal Concepts in Surface Growth (Cambridge University Press, 1995).
-
- Meakin P. Fractals, Scaling and Growth Far From Equilibrium (Cambridge University Press, 1998).
-
- Krim J. & Palasantzas G. Experimental observations of self-affine scaling and kinetic roughening at sub-micron length scales. Int. J. Mod. Phys. B 9, 599–632 (1995).
-
- Munoz M. A. Multiplicative noise in non-equilibrium phase transitions: A tutorial In Advances in Condensed Matter and Statistical Physics , (eds Korutcheva E. & Cuerno R. ) 37–68 (Nova Science, 2004).
-
- Steudel S. et al.. Influence of the dielectric roughness on the performance of pentacene transistors. App. Phys. Lett. 85, 4400–4402 (2004).
Publication types
LinkOut - more resources
Full Text Sources
Other Literature Sources

