. 2017 Jan;65(1):50-61.
doi: 10.1002/glia.23050. Epub 2016 Sep 12.

Frequency of nuclear mutant huntingtin inclusion formation in neurons and glia is cell-type-specific

Affiliations

Frequency of nuclear mutant huntingtin inclusion formation in neurons and glia is cell-type-specific

Anne H P Jansen et al. Glia. 2017 Jan.

Abstract

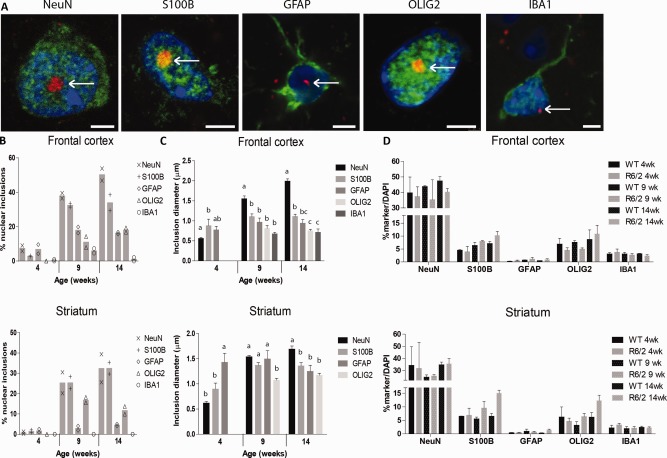
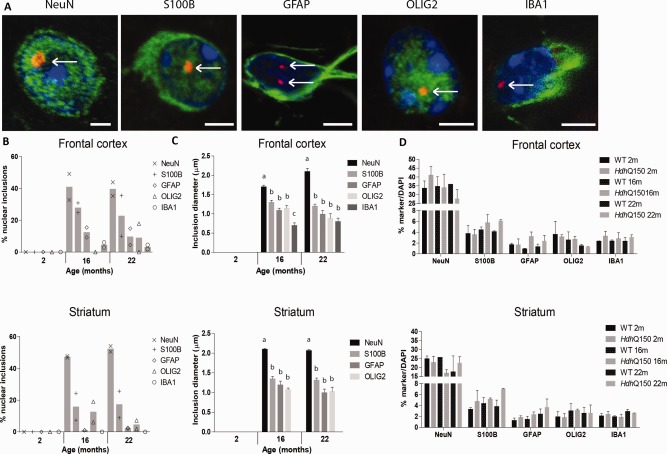
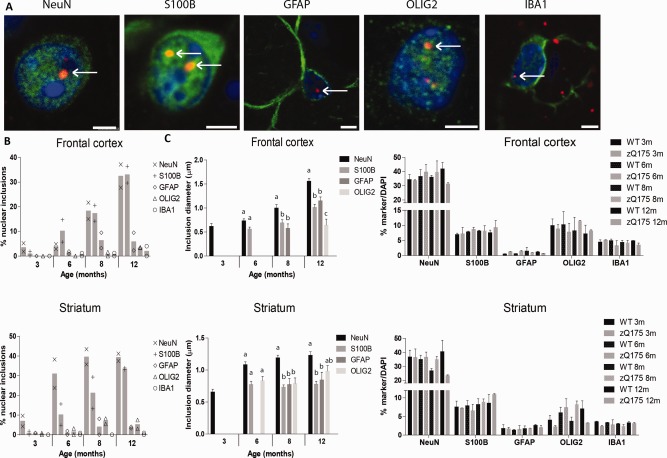
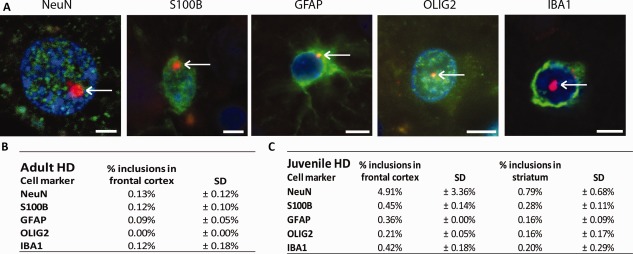
Huntington's disease (HD) is an autosomal dominant inherited neurodegenerative disorder that is caused by a CAG expansion in the Huntingtin (HTT) gene, leading to HTT inclusion formation in the brain. The mutant huntingtin protein (mHTT) is ubiquitously expressed and therefore nuclear inclusions could be present in all brain cells. The effects of nuclear inclusion formation have been mainly studied in neurons, while the effect on glia has been comparatively disregarded. Astrocytes, microglia, and oligodendrocytes are glial cells that are essential for normal brain function and are implicated in several neurological diseases. Here we examined the number of nuclear mHTT inclusions in both neurons and various types of glia in the two brain areas that are the most affected in HD, frontal cortex, and striatum. We compared nuclear mHTT inclusion body formation in three HD mouse models that express either full-length HTT or an N-terminal exon1 fragment of mHTT, and we observed nuclear inclusions in neurons, astrocytes, oligodendrocytes, and microglia. When studying the frequency of cells with nuclear inclusions in mice, we found that half of the population of neurons contained nuclear inclusions at the disease end stage, whereas the proportion of GFAP-positive astrocytes and oligodendrocytes having a nuclear inclusion was much lower, while microglia hardly showed any nuclear inclusions. Nuclear inclusions were also present in neurons and all studied glial cell types in human patient material. This is the first report to compare nuclear mHTT inclusions in glia and neurons in different HD mouse models and HD patient brains. GLIA 2016;65:50-61.

Keywords: Huntington's disease; astrocytes; inclusions; microglia; neurons; oligodendrocytes.


Figures

Figure 1
Figure 1
Nuclear mHTT inclusions in R6/2 striatum and cortex. (A) Exemplary images of mHTT inclusions (S829, red) were present in the nuclei (DAPI, blue) of neurons (NeuN, green, striatum), S100B‐positive glia (green, striatum), GFAP‐positive astrocytes (green, frontal cortex), oligodendrocytes (OLIG2, green, striatum), and microglia (IBA1, green, frontal cortex). Representative pictures of each cell, morphology similar in cortex and striatum. Scale bar is 3 µm. (B) The percentage of cells with a nuclear inclusion in the cortex and striatum. (C) The change in the diameter of nuclear inclusions with disease progression in the various cell types. Different letters represent significantly different groups as determined by one‐way ANOVA with Student–Newman–Keuls post hoc test. (D) The percentage of nuclei co‐staining for various cell type markers. Cell numbers were similar between wild‐type and R6/2 mice (N = 11,943–27,037). WT = wild‐type. [Color figure can be viewed at wileyonlinelibrary.com]
Figure 2
Figure 2
Nuclear mHTT inclusions in the homozygous HdhQ150 mouse striatum and cortex. (A) Exemplary images of mHTT inclusions (S829, red) were present in nuclei (DAPI, blue) of neurons (NeuN, green, striatum), S100B‐positive glia (green, striatum), GFAP‐positive astrocytes (green, striatum), oligodendrocytes (OLIG2, green, striatum), and microglia (IBA1, green, frontal cortex). Representative pictures of each cell, morphology similar in cortex and striatum. Scale bar is 3 µm. (B) The percentage of cells with a nuclear inclusion in the cortex and striatum. (C) The change in diameter of nuclear inclusions with disease progression in the various cell types. Different letters represent significantly different groups as determined by one‐way ANOVA with Student–Newman–Keuls post hoc test. (D) The percentage of nuclei co‐staining for various cell type markers. Quantification of total cell numbers showed an increase in S100B‐postive glia and GFAP‐positive astrocytes in HdhQ150 brains as compared with wild‐type (minimum N = 10,005–20,879). WT = wild‐type. [Color figure can be viewed at wileyonlinelibrary.com]
Figure 3
Figure 3
Nuclear mHTT inclusions in the zQ175 model. (A) Exemplary images of HTT inclusions (S829, red) were present in the nuclei (DAPI, blue) of neurons (NeuN, green, frontal cortex), S100B‐positive glia (green, striatum), GFAP‐positive astrocytes (green, frontal cortex), oligodendrocytes (OLIG2, green, striatum), and microglia (IBA1, green, frontal cortex). Representative pictures of each cell, morphology similar in cortex and striatum. Scale bar is 3 µm. (B) The percentage of cells with a nuclear inclusion in the cortex and striatum. (C) The change in diameter of nuclear inclusions with disease progression in the various cell types. Different letters represent significantly different groups as determined by one‐way ANOVA with Student–Newman–Keuls post hoc test. (D) The percentage of nuclei co‐staining for various cell type markers. Quantification of cell numbers in wild‐type mice and zQ175 mice (minimum N = 9,629–17,518). WT = wild‐type. [Color figure can be viewed at wileyonlinelibrary.com]
Figure 4
Figure 4
Nuclear mHTT inclusions in Huntington's disease postmortem human brain. (A) Exemplary images of nuclear mHTT inclusions (S829, red) were present in the nuclei (DAPI, blue) of neurons (NeuN, green, frontal cortex), S100B‐positive glia (green, frontal cortex), GFAP‐positive astrocytes (green, striatum, frontal cortex), and microglia (IBA1, green, frontal cortex) oligodendrocytes (OLIG2, green, frontal cortex). Representative pictures of each cell, morphology similar in cortex and striatum. Scale bar is 3 µm. (B) The proportion of the various cell types that contain a nuclear inclusion in the frontal cortex of adult‐onset patients. (C) The proportion of the various cell types that contain a nuclear inclusion in the frontal cortex and striatum of juvenile‐onset patients. [Color figure can be viewed at wileyonlinelibrary.com]

References

    1. André W, Sandt C, Dumas P, Djian P, Hoffner G. 2013. Structure of inclusions of Huntington's disease brain revealed by synchrotron infrared microspectroscopy: Polymorphism and relevance to cytotoxicity. Anal Chem 85:3765–3773. - PubMed
    1. Arrasate M, Mitra S, Schweitzer ES, Segal MR, Finkbeiner S. 2004. Inclusion body formation reduces levels of mutant huntingtin and the risk of neuronal death. Nature 431:805–810. - PubMed
    1. Bradford J, Shin J, Roberts M, Wang C, Sheng G, Li S, Li X. 2010. Mutant huntingtin in glial cells exacerbates neurological symptoms of Huntington disease mice. J Biol Chem 285:10653–10661. - PMC - PubMed
    1. Carty N, Berson N, Tillack K, Thiede C, Scholz D, Kottig K, Sedaghat Y, Gabrysiak C, Yohrling G, von der Kammer H, Ebneth A, Mack V, Munoz‐Sanjuan I, Kwak S. 2015. Characterization of HTT inclusion size, location, and timing in the zQ175 mouse model of Huntington's disease: an in vivo high‐content imaging study. PLoS One 10:e0123527. - PMC - PubMed
    1. Chou SY, Weng JY, Lai HL, Liao F, Sun SH, Tu PH, Dickson DW, Chern Y. 2008. Expanded‐polyglutamine huntingtin protein suppresses the secretion and production of a chemokine (CCL5/RANTES) by astrocytes. J Neurosci 28:3277–3290. - PMC - PubMed

Publication types