. 2016 Sep 12:6:32702.
doi: 10.1038/srep32702.

Phase correlation imaging of unlabeled cell dynamics

Affiliations

Phase correlation imaging of unlabeled cell dynamics

Lihong Ma et al. Sci Rep. .

Abstract

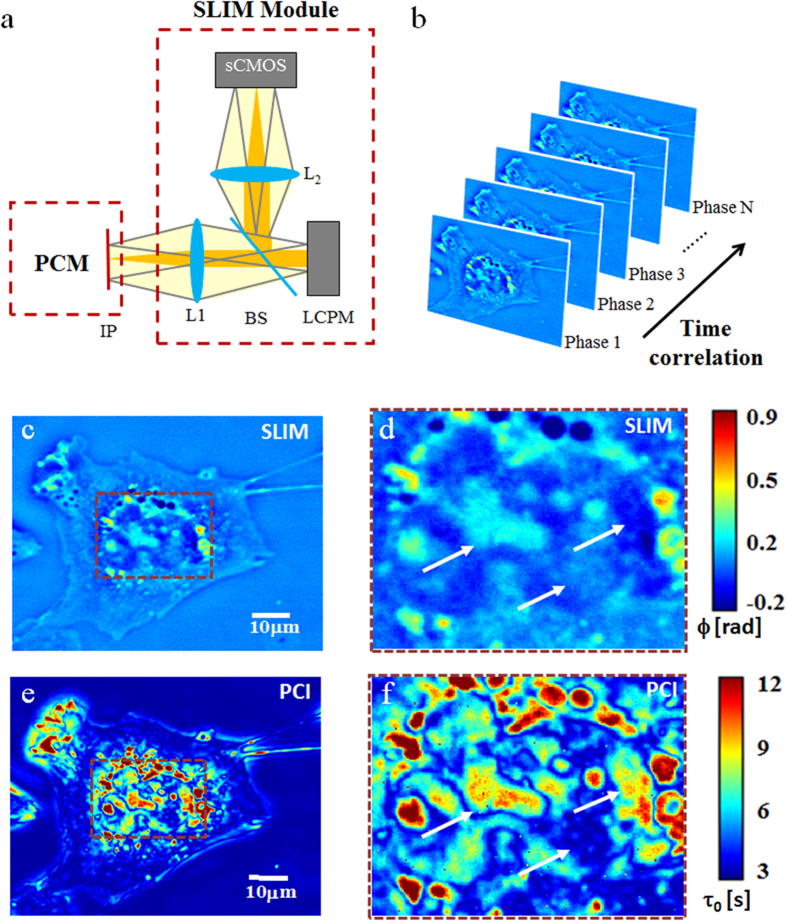
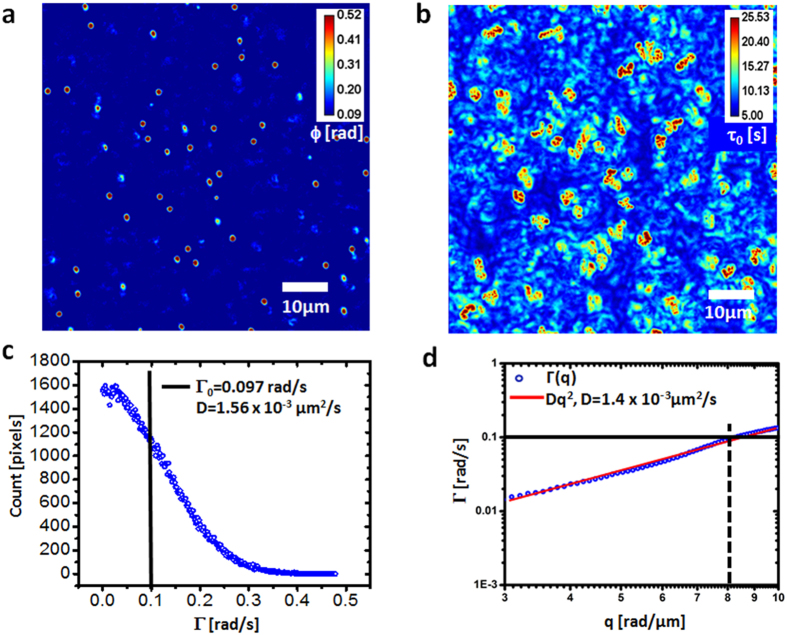
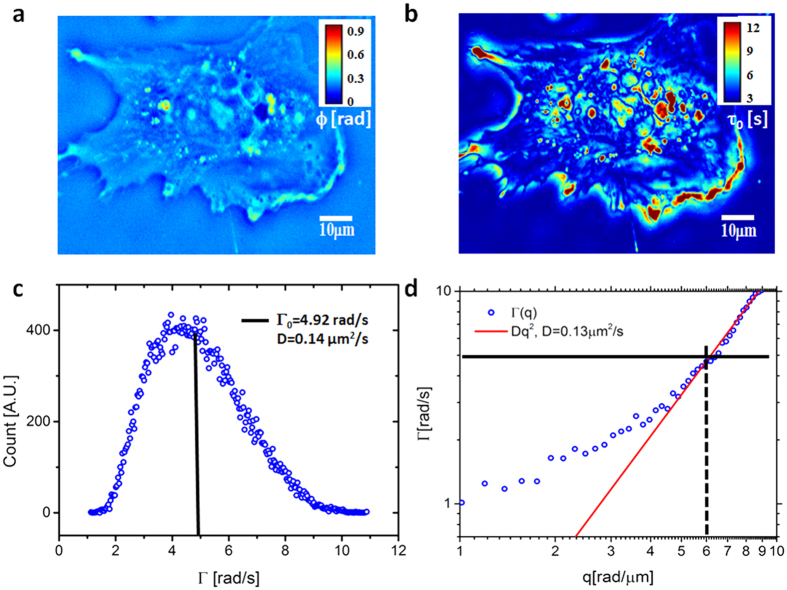
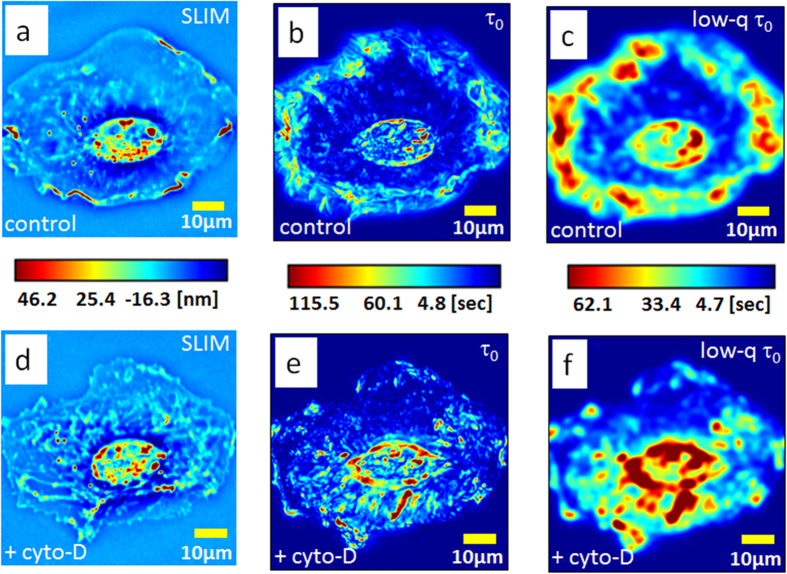
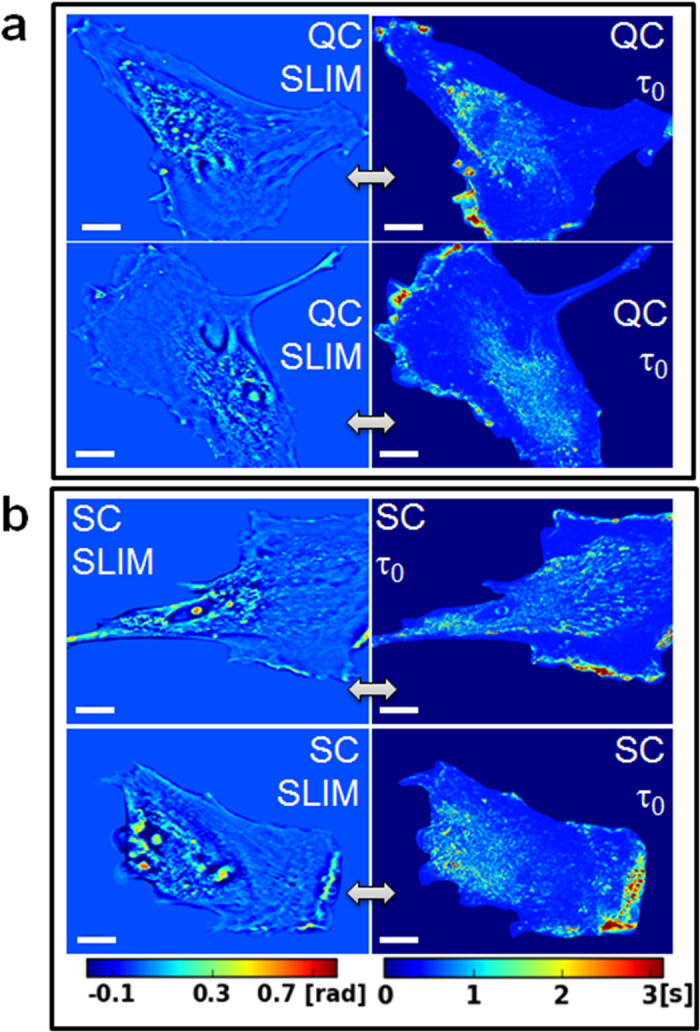
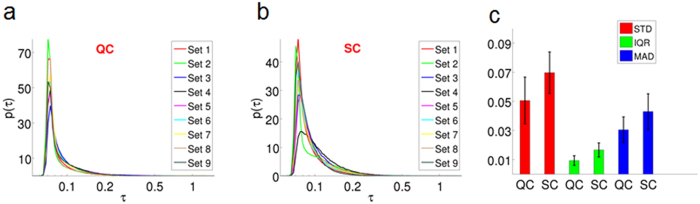
We present phase correlation imaging (PCI) as a novel approach to study cell dynamics in a spatially-resolved manner. PCI relies on quantitative phase imaging time-lapse data and, as such, functions in label-free mode, without the limitations associated with exogenous markers. The correlation time map outputted in PCI informs on the dynamics of the intracellular mass transport. Specifically, we show that PCI can extract quantitatively the diffusion coefficient map associated with live cells, as well as standard Brownian particles. Due to its high sensitivity to mass transport, PCI can be applied to studying the integrity of actin polymerization dynamics. Our results indicate that the cyto-D treatment blocking the actin polymerization has a dominant effect at the large spatial scales, in the region surrounding the cell. We found that PCI can distinguish between senescent and quiescent cells, which is extremely difficult without using specific markers currently. We anticipate that PCI will be used alongside established, fluorescence-based techniques to enable valuable new studies of cell function.


Conflict of interest statement

Gabriel Popescu has financial interest in Phi Optics, Inc., a research instrumentation company that commercializes the SLIM technology.

Figures

Figure 1
Figure 1. Generation of PCI maps.
(a) SLIM module, attached to a phase contrast microscope (PCM): L1, L2, lenses, LCPM, liquid crystal phase modulator, sCMOS, complementary metal–oxide–semiconductor camera. (b) Schematic for generation of phase correlation image by calculating the correlation time at each pixel for a sequence of time-resolved phase images. (c) SLIM image of an A549 lung cancer cells. (d) Zoomed-in view of the cellular highlighted in c. (e) PCI map for the A549 ling cell in c. (f) PCI map corresponding to the intracellular region highlighted in e.
Figure 2
Figure 2. Measurement of diffusion coefficients of Brownian particles using PCI.
(a) Quantitative phase image of 1 μm polystyrene beads in glycerol undergoing Brownian motion. (b) Correlation time map of the sample shown in a. (c) Histogram of the bandwidth values across the PCI map, band-passed around q0 = 8 rad/μm. The mean value is displayed using the vertical line. (d) Dispersion relation curve associated with the diffusive particles shown in a. The mean Γ value from c is shown by the horizontal line.
Figure 3
Figure 3. Measurement of diffusion coefficients of mass transport in live cells.
(a) SLIM image of a A549 lung cell. (b) Correlation time map generated using PCI. (c) Histogram of the bandwidth values across the PCI map, band-passed around q0 = 6 rad/μm. The mean is indicated by the vertical line. (d) Dispersion relation curve associated with the live cell in a. The mean of Γ from c is indicated by the horizontal line.
Figure 4
Figure 4. PCI studies of the effect of CytoD treatment on actin dynamics.
(a) SLIM image of a glia cell. (b) The PCI map of the cell in a. (c) Low pass filtered version of the PCI map in b generated by blurring with a 3 μm width Gaussian kernel. (d) SLIM image of a glia cell after cyto-D treatment. (e) The PCI map of the cell in d. (f) Low pass filtered version of the PCI map in e generated by blurring with a 3 μm width Gaussian kernel. The color bars between each pair of figures (a–d,b–e,c–f) are common to the pair.
Figure 5
Figure 5. Phase correlation imaging of quiescent (QC) and senescent (SC) cells.
(a) SLIM (left) and PCI (right) of two QC cells, as indicated. (b) SLIM (left) and PCI (right) of two SC cells, as indicated. The scale bar indicates 10 um. All the SLIM images and all PCI maps are on the same respective color bar, as shown.
Figure 6
Figure 6. Differentiation between quiescent cells (QC) and senescent cells (SC) using PCI.
(a) Distribution function of correlation time. p (linear axis, units of s−1), vs. τ0 (log axis, in seconds) for nine sets of QC. (b) Distribution function of correlation time. p (linear axis, units of s−1), vs. τ0 (log axis, in seconds) for nine sets of SC. (c) The median values of standard deviation (STD), inter-quartile range (IQR), and IQR and median absolute deviation (MAD), corresponding to the nine sets for QC and SC, as indicated.

References

    1. Alberts B., Wilson J. H. & Hunt T. Molecular biology of the cell. 5th edn, (Garland Science, 2008).
    1. Mofrad M. R. K. & Kamm R. D. Cytoskeletal mechanics: models and measurements. (Cambridge University Press, 2006).
    1. Segev N. Trafficking inside cells: pathways, mechanisms, and regulation. (Landes Bioscience; Springer Science+Business Media, 2009).
    1. Wang R., Lei L., Wang Y. X., Levine A. J. & Popescu G. Dispersion-Relation Fluorescence Spectroscopy. Physical Review Letters 109, doi: Artn 188104, doi: 10.1103/Physrevlett.109.188104 (2012). - DOI - PubMed
    1. Wang R. et al.. Dispersion-relation phase spectroscopy of intracellular transport. Opt. Express 19, 20571–20579 (2011). - PMC - PubMed

Publication types