. 2016 Sep 22;167(1):47-59.e15.
doi: 10.1016/j.cell.2016.08.028. Epub 2016 Sep 8.

Warm-Sensitive Neurons that Control Body Temperature

Affiliations

Warm-Sensitive Neurons that Control Body Temperature

Chan Lek Tan et al. Cell. .

Abstract

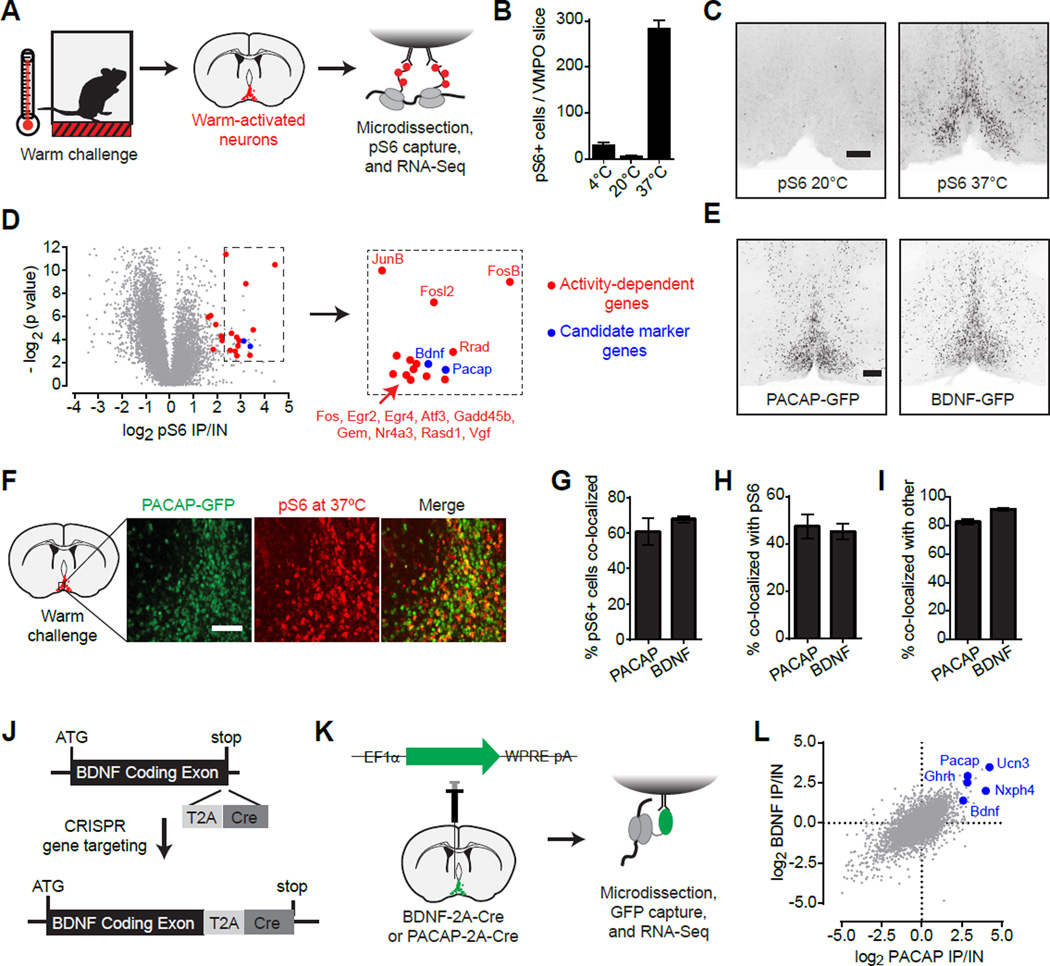
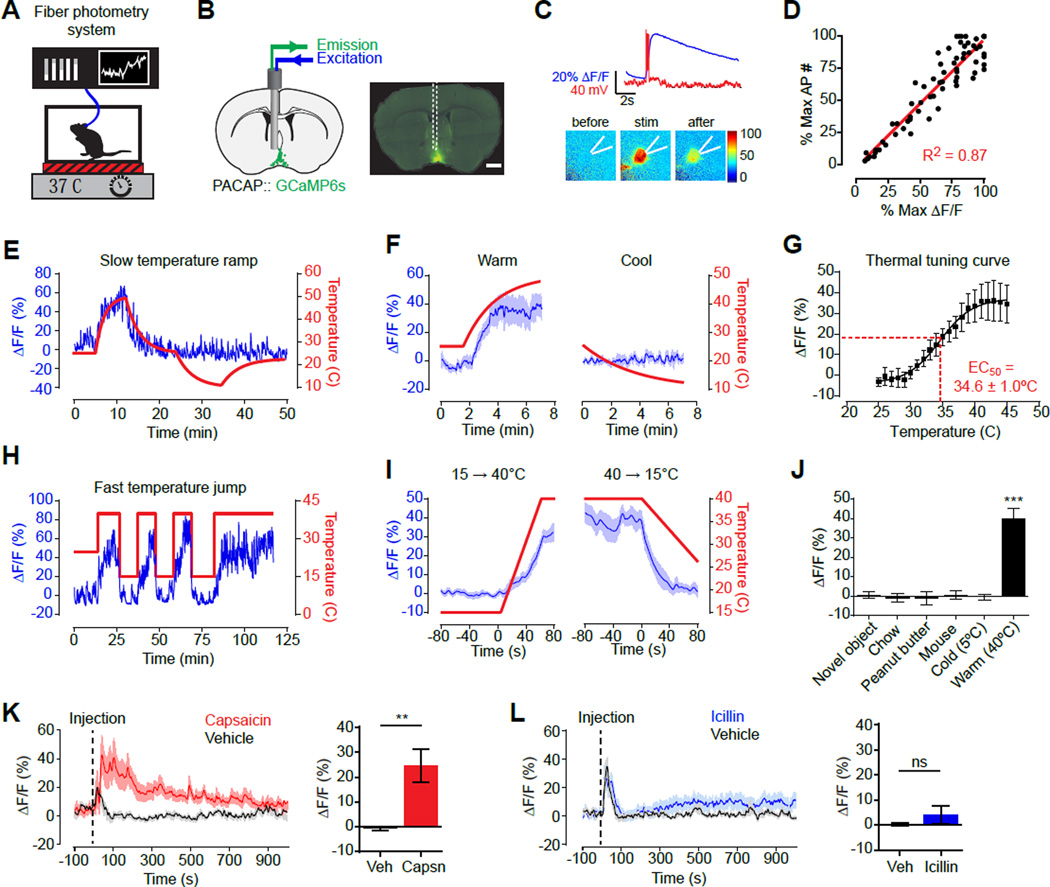
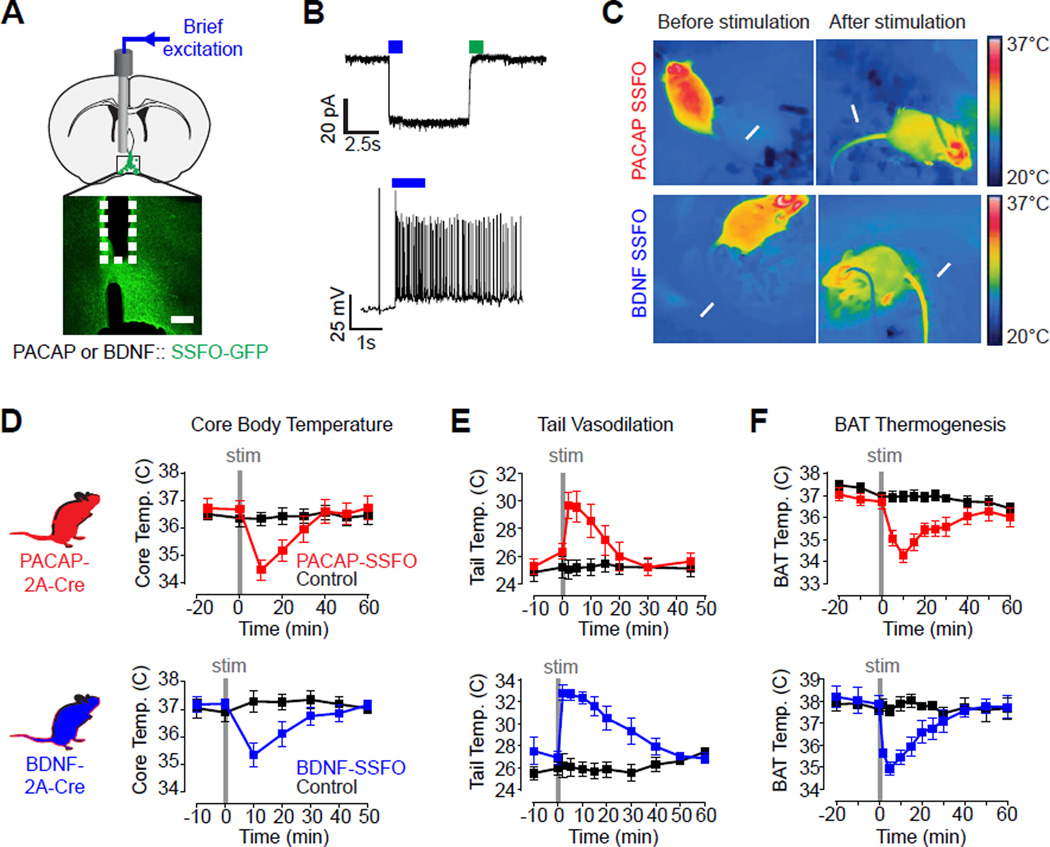
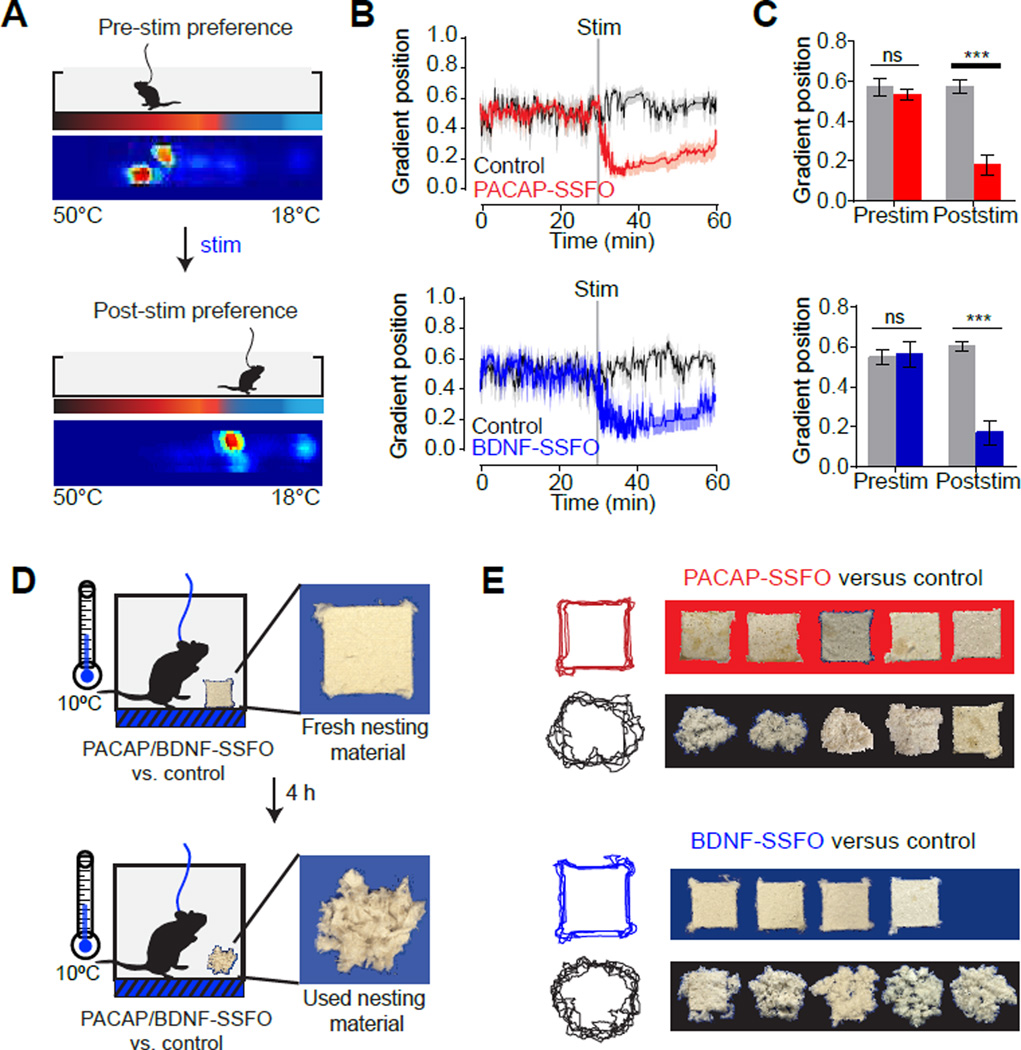
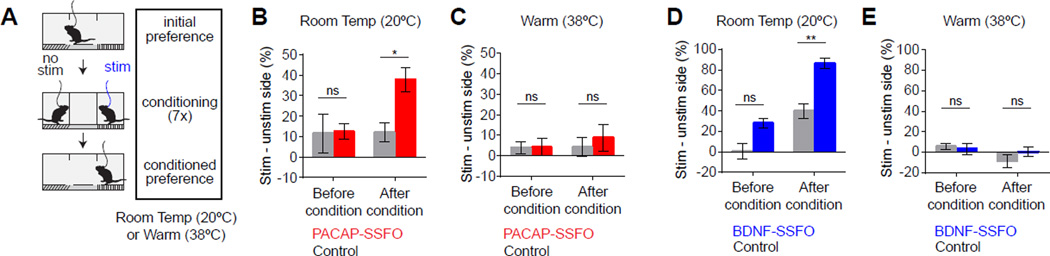
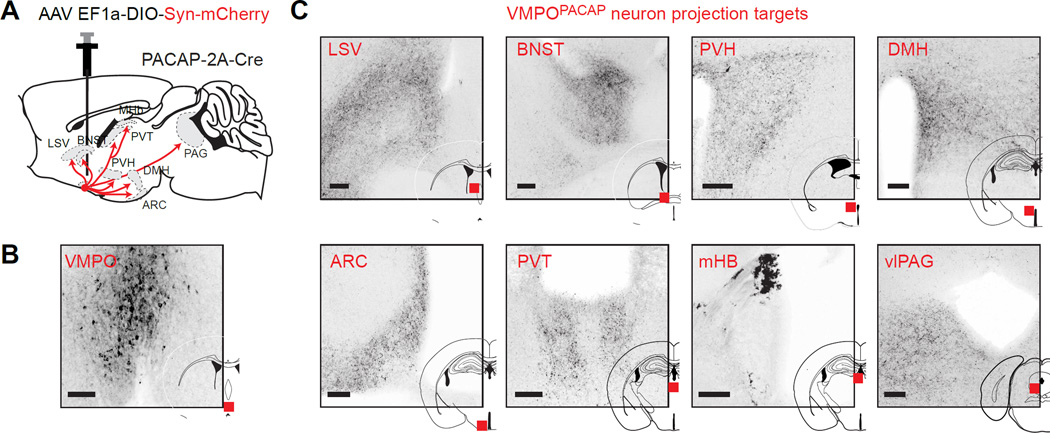
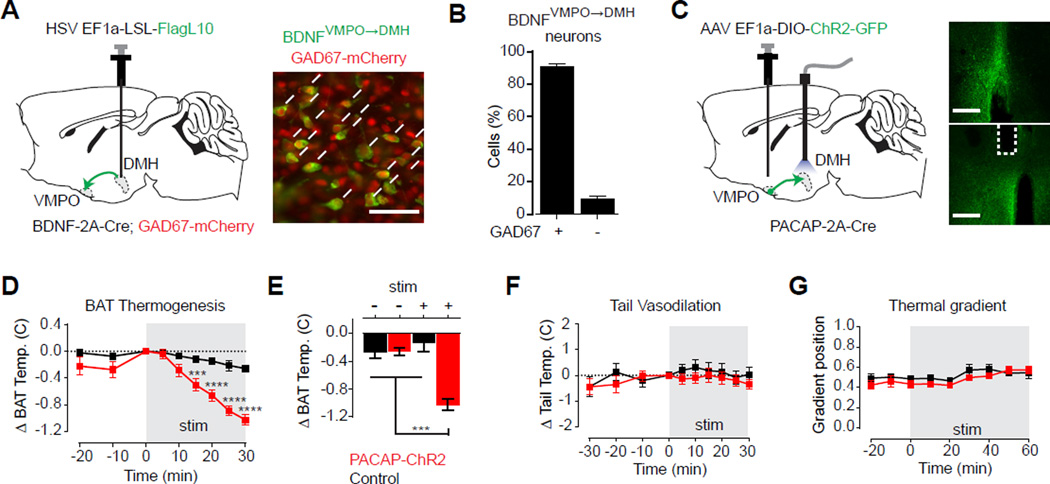
Thermoregulation is one of the most vital functions of the brain, but how temperature information is converted into homeostatic responses remains unknown. Here, we use an unbiased approach for activity-dependent RNA sequencing to identify warm-sensitive neurons (WSNs) within the preoptic hypothalamus that orchestrate the homeostatic response to heat. We show that these WSNs are molecularly defined by co-expression of the neuropeptides BDNF and PACAP. Optical recordings in awake, behaving mice reveal that these neurons are selectively activated by environmental warmth. Optogenetic excitation of WSNs triggers rapid hypothermia, mediated by reciprocal changes in heat production and loss, as well as dramatic cold-seeking behavior. Projection-specific manipulations demonstrate that these distinct effectors are controlled by anatomically segregated pathways. These findings reveal a molecularly defined cell type that coordinates the diverse behavioral and autonomic responses to heat. Identification of these warm-sensitive cells provides genetic access to the core neural circuit regulating the body temperature of mammals. PAPERCLIP.


Figures

Figure 1
Figure 1. Warm-activated POA neurons express PACAP and BDNF
See also Figure S1. (A) PhosphoTRAP strategy for genetic identification of warm-activated neurons. (B) Number of activated (pS6+) cells in the VMPO after subjecting mice to warm (37°C), cold (4°C) or regular ambient temperatures. (C) Anatomic location of pS6-positive cells after warm exposure. Scale bar = 200 µm (D) PhosphoTRAP sequencing results. Fold enrichment in IP versus input fraction (x-axis) and statistical significance (y-axis) are shown. Blue: candidate markers of activated neurons; Red: activity-induced immediately-early genes. Microdissected preoptic area from 5–8 animals were pooled in each of the three experimental replicates. (E) Distribution of PACAP and BDNF neurons in the VMPO based on Cre-dependent GFP reporter expression. Scale bar = 200 µm. (F) Colocalization of PACAP-GFP (green) with warm-activated pS6 (red). Scale bar = 200 µm. (G–H) Bar graphs quantifying colocalization of warm-activated pS6 with GFP expressed in either PACAP- (Pac) or BDNF- expressing cells. (G) Percentage of pS6+ neurons that are GFP+. (H) Percentage of GFP+ neurons that are pS6+. (I) Percentage of PACAP-GFP neurons positive for BDNF-LacZ (Pac) and vice-versa (Bdnf). g–i n=3 per group. (J), CRISPR-aided generation of Cre-knock in allele at the endogenous BDNF locus. (K–L) RNA-Seq profiling of selective gene expression in PACAP or BDNF neurons using TRAP. (K) Schematic of TRAP strategy. Microdissected preoptic area from 6–10 animals were pooled in each experimental replicate. Two experimental replicates each were performed for PACAP-Cre labeled neurons and for BDNF-Cre labeled neurons. (L) Scatter plot showing fold-enrichment of each gene in BDNF neurons (y-axis) or in PACAP neurons (x-axis). Selected neuropeptide genes are highlighted in blue.
Figure 2
Figure 2. Natural dynamics of VMPOPACAP neurons
See also Figure S2. (A) Fiber photometry setup to record VMPOPACAP neural activity in awake animals in response to temperature changes. (B) Schematic and representative coronal section show placement of optical fiber above VMPOPACAP neurons expressing GCAMP6s (green). Scale bar = 500 µm. (C) Fluorescence increase (blue line) and action potential spikes (red) in response to current injection in representative VMPOPACAP cell. (D) GCAMP6s fluorescence signal increases proportionally with induced action potential spikes. n=7 mice. (E) Representative trace recorded during gradual temperature ramps between 47°C and 10°C. (F) Mean responses during gradual temperature changes from 25°C to 47°C (Warm) or from 25°C to 10°C (Cool). n=5, One-way RM-ANOVA, F20,140(Warm)=15.2, P<0.001; F14,56(Cool)=1.09, P= 0.38; (G) Mean response at each 1 °C temperature interval during from gradual temperature ramp experiments. n=8. Fitted curve with 4-PL, sigmoidal function is shown. (H) Representative trace recorded during rapid temperature steps between 40°C and 15°C. (I) Mean responses during rapid temperature transitions shown in H. n=7. (J) Mean response during first 1000 seconds following exposure to each stimulus. n=6. *** P<0.001, Bonferroni multiple comparisons test on all possible pairs. (K–L) Fluorescence response to Capsaicin (K) or Icilin (L) injection normalized to paired responses to vehicle injection. Animal handling and Injection starts at time=0 Bar graphs show average response in 5 min window after vehicle/drug injection. 2-tailed paired t-test vs vehicle: Capsaicin P=0.0093, Icilin P=0.34. n=9.
Figure 3
Figure 3. Optogenetic activation of VMPOPACAP/BDNF neurons induces hypothermia
See also Figure S3. (A) Schematic and representative slice showing placement of optical fiber above VMPOPACAP/BDNF neurons expressing SSFO-eYFP (green). Scale bar = 100 µm. (B) Representative patch-clamp recording trace showing light-induced photocurrent (top) and action potentials (bottom) in VMPOPACAP/BDNF neurons expressing SSFO. (C) Infrared thermography shows tail vasodilation (arrow) and trunk temperature loss upon VMPOPACAP/BDNF neurons stimulation. (D–F) Stimulation (2 Hz, 30 s) of VMPOPACAP (red) or VMPOBDNF (blue) neurons induced (D) transient rectal temperature hypothermia. n=4–7 per group, F7,84 (PACAP)=15.43, P<0.001; F6,48 (BDNF)=16.16, P<0.001; (E) increased tail base temperature. n=7–9 per group, F8,120 (PACAP)=11.43, P<0.001; F7,84(BDNF)=14.78, P<0.001; (F) reduced subcutaneous temperature in the interscapular brown fat deposit. n=5–10 per group, F10,160 (PACAP)=13.11, P<0.001; F9,72 (BDNF)=6.70, P<0.001. All F statistic show two-way RM-ANOVA, Group × Time Interaction.
Figure 4
Figure 4. Optogenetic activation of VMPOPACAP/BDNF neurons induces thermoregulatory behavior
See also Figure S4. (A–C) VMPOPACAP/BDNF neuron stimulation alters temperature preference in the thermal gradient. (A) Schematic of thermal gradient assay. Heat map shows cumulative positions of a representative subject on a thermal gradient in the 30 minute span before and after light stimulation. (B) Average gradient position (0=18°C, 1=50°C) during stimulation trials. (C) Median gradient position in the 30 minute interval before and after stimulation. n=7–10 per group. Two-way RM-ANOVA, Interaction, F1,15(PACAP)=37.78, P<0.001; F1,13(BDNF)=13.90, P=0.002. post-hoc Bonferroni multiple comparisons *** P<0.001. (D–E) POAPACAP/BDNF neuron stimulation suppresses nesting activity. (D) Schematic of nesting activity assay. PACAP-SSFO, BDNF-SSFO or control subjects were given fresh nesting material in a cool environment (10°C). Light stimulation was applied for 4 hours (10 seconds of 2 Hz stimulation every 30 minutes) and condition of nesting material was recorded after. Representative fresh and used nesting material are shown. (E) Photographs (right) of nesting material and a composite of traced outlines are shown after a 4-hour nesting activity assay.
Figure 5
Figure 5. Optogenetic activation of VMPOPACAP/BDNF neurons conditions place preference at cool but not at warm ambient temperatures
(A) Scheme of conditioned place preference test. (B–E) Difference between proportion of time spent in the stimulation-paired chamber and unpaired chamber for either PACAP-SSFO (B,C) or BDNF-SSFO (D,E) mice at 20°C (B,D) or 38°C (C,E). 20°C: Two-way RM-ANOVA, F1,6(PACAP, Interaction)=7.03, P<0.05; F1,8(BDNF, Group)=18.62, P=0.002; F1,8(BDNF, Conditioning)=29.25, P<0.001. 38°C: Two-way RM-ANOVA, All factors P>0.05. n=3–6. post-hoc Bonferroni multiple comparisons * P<0.05, ** P<0.01.
Figure 6
Figure 6. Anterograde tracing reveals downstream thermoregulatory circuit
(A) Schematic summarizing strategy for visualizing target structures using Cre-dependent virus expressing a synaptophysin-mCherry fusion protein. Major VMPOPACAP neuron projection sites are indicated. (B) Expression of synaptophysin-mcherry (dark) in VMPOPACAP neurons cell bodies at VMPO injection site. (C) Expression of synaptophysin-mcherry in VMPOPACAP neuron terminals at indicated regions (red squares). Abbreviations: LSV- ventral portion of lateral septum; BNST- bed nucleus of stria terminalis. DMH- dorsomedial hypothalamus; ARC-arcuate nucleus; PVT-paraventricular thalamus; MHb-medial habenula; PVH-paraventricular hypothalamus; vlPAG- ventrolateral periaqueductal gray. Scale bars = 100 µm.
Figure 7
Figure 7. VMPOPACAP/BDNF neurons inhibit brown fat thermogenesis via a GABAergic projection to the DMH
See also Figure S5. (A) Schematic and representative image of retrograde-labeling of BDNFPOA→DMH neurons (green) and costaining for nuclear localized GAD67-mCherry (red). Scale bar = 50 µm (B) Bar graph quantifies percentage of BDNFVMPO→DMH neurons that were GAD67 positive. n=3 (C–G) DMH-projection site-specific stimulation. Red: PACAP-ChR2 subjects. Black: control subjects. Schematic and images. (C) Expression of hChR2(H134R)-GFP (green) in cell bodies at VMPO injection site and axon terminals at DMH. White dotted line indicate optic fiber placement. Scale bar = 400 µm (D–E) Interscapular brown fat temperature decreases upon light stimulation in PACAP-ChR2 subjects. (10 ms light pulse at 5 Hz in 1 s ON/1s OFF duty cycle). n=8–11 per group. (D) Timecourse shows change in BAT temperature relative to start of stimulation period shown in gray. Two-way RM-ANOVA, F8,136(Group × Time)=9.154, P<0.001. (E) Mean brown fat temperature changes after 30 minutes in the absence or presence of stimulation. Two-way ANOVA, F1,34(Group × Stimulation)=26.04, P<0.0001.. (F) No effects observed on tail vasodilation. Change in tail temperature relative to start of stimulation period shown in gray. n=11 per group. Two-way RM-ANOVA, All factors, P>0.05. (G) No effect on preferred temperature as shown by the mean thermal gradient position in 10 minute intervals. Stimulation period shown in gray. n=7 per group. Two-way RM-ANOVA, Interaction and Group factors, P>0.05. post-hoc Bonferroni multiple comparisons *** P<0.001.

Comment in

References

    1. Boulant JA, Hardy JD. The effect of spinal and skin temperatures on the firing rate and thermosensitivity of preoptic neurones. The Journal of physiology. 1974;240:639–660. - PMC - PubMed
    1. Bratincsak A, Palkovits M. Evidence that peripheral rather than intracranial thermal signals induce thermoregulation. Neuroscience. 2005;135:525–532. - PubMed
    1. Broberger C, Johansen J, Johansson C, Schalling M, Hokfelt T. The neuropeptide Y/agouti gene-related protein (AGRP) brain circuitry in normal, anorectic, and monosodium glutamate-treated mice. Proceedings of the National Academy of Sciences of the United States of America. 1998;95:15043–15048. - PMC - PubMed
    1. Cao WH, Fan W, Morrison SF. Medullary pathways mediating specific sympathetic responses to activation of dorsomedial hypothalamus. Neuroscience. 2004;126:229–240. - PubMed
    1. Carlisle HJ. Behavioural significance of hypothalamic temperature-sensitive cells. Nature. 1966;209:1324–1325. - PubMed

Publication types

MeSH terms

Substances