

Assessing the suitability of summary data for two-sample Mendelian randomization analyses using MR-Egger regression: the role of the I2 statistic
- PMID: 27616674
- PMCID: PMC5446088
- DOI: 10.1093/ije/dyw220
Assessing the suitability of summary data for two-sample Mendelian randomization analyses using MR-Egger regression: the role of the I2 statistic
Abstract
Background: : MR-Egger regression has recently been proposed as a method for Mendelian randomization (MR) analyses incorporating summary data estimates of causal effect from multiple individual variants, which is robust to invalid instruments. It can be used to test for directional pleiotropy and provides an estimate of the causal effect adjusted for its presence. MR-Egger regression provides a useful additional sensitivity analysis to the standard inverse variance weighted (IVW) approach that assumes all variants are valid instruments. Both methods use weights that consider the single nucleotide polymorphism (SNP)-exposure associations to be known, rather than estimated. We call this the `NO Measurement Error' (NOME) assumption. Causal effect estimates from the IVW approach exhibit weak instrument bias whenever the genetic variants utilized violate the NOME assumption, which can be reliably measured using the F-statistic. The effect of NOME violation on MR-Egger regression has yet to be studied.
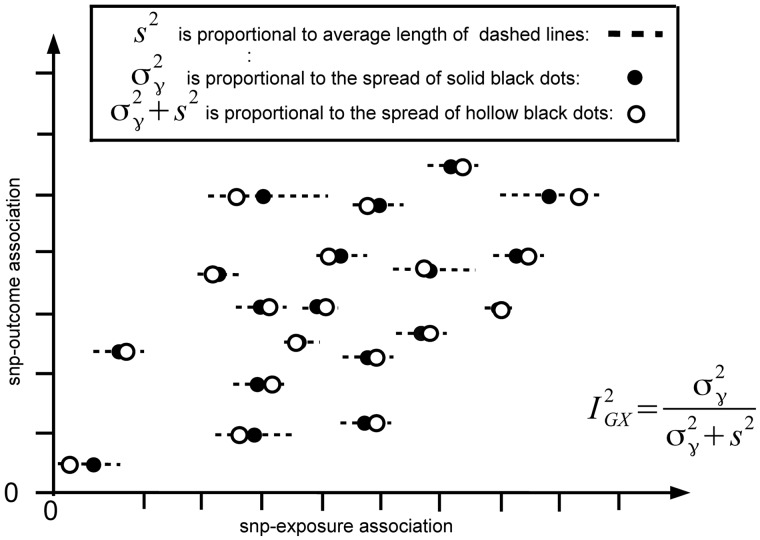
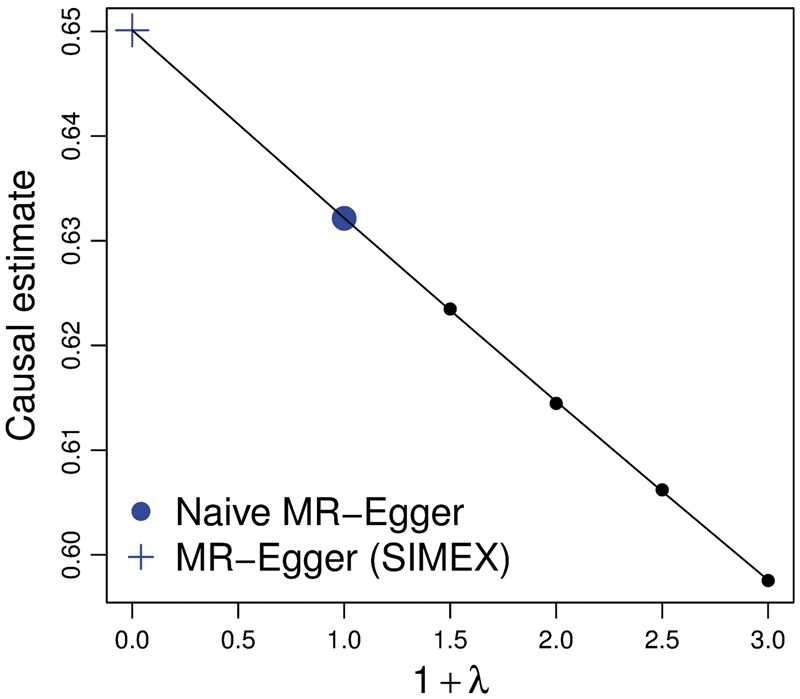
Methods: An adaptation of the I2 statistic from the field of meta-analysis is proposed to quantify the strength of NOME violation for MR-Egger. It lies between 0 and 1, and indicates the expected relative bias (or dilution) of the MR-Egger causal estimate in the two-sample MR context. We call it IGX2 . The method of simulation extrapolation is also explored to counteract the dilution. Their joint utility is evaluated using simulated data and applied to a real MR example.
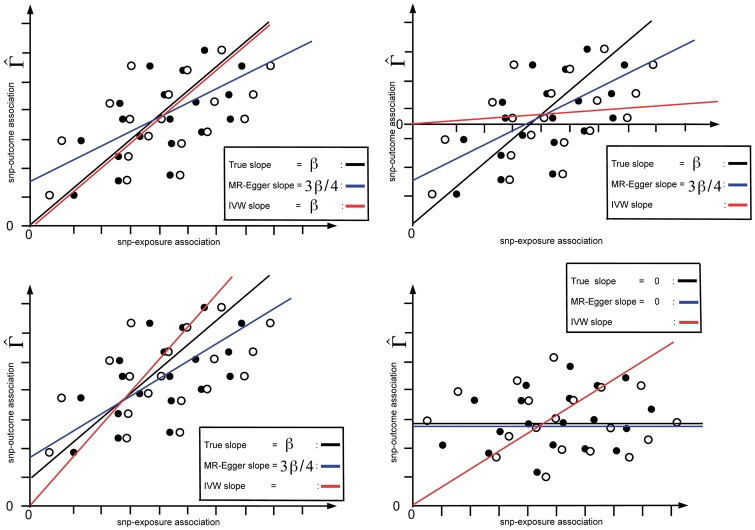
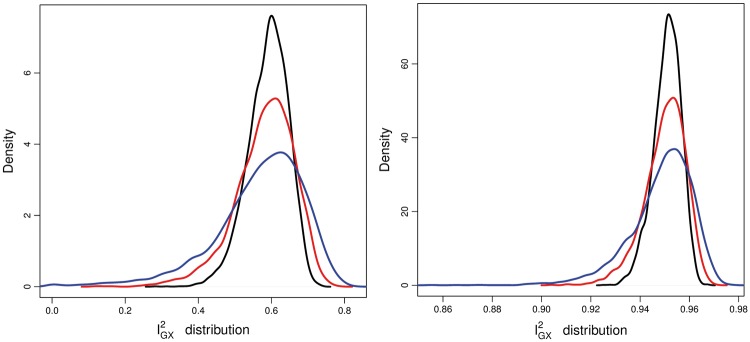
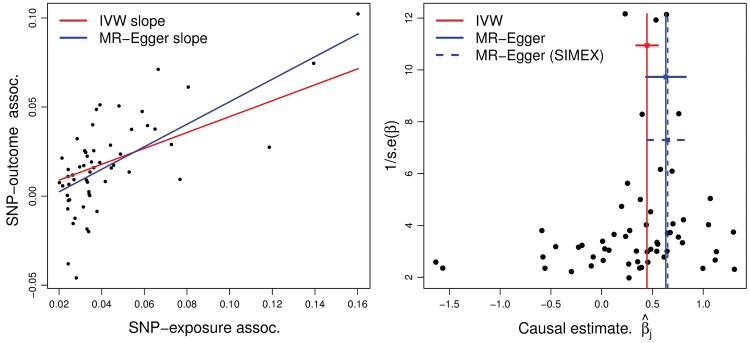
Results: In simulated two-sample MR analyses we show that, when a causal effect exists, the MR-Egger estimate of causal effect is biased towards the null when NOME is violated, and the stronger the violation (as indicated by lower values of IGX2 ), the stronger the dilution. When additionally all genetic variants are valid instruments, the type I error rate of the MR-Egger test for pleiotropy is inflated and the causal effect underestimated. Simulation extrapolation is shown to substantially mitigate these adverse effects. We demonstrate our proposed approach for a two-sample summary data MR analysis to estimate the causal effect of low-density lipoprotein on heart disease risk. A high value of IGX2 close to 1 indicates that dilution does not materially affect the standard MR-Egger analyses for these data.
Conclusions: : Care must be taken to assess the NOME assumption via the IGX2 statistic before implementing standard MR-Egger regression in the two-sample summary data context. If IGX2 is sufficiently low (less than 90%), inferences from the method should be interpreted with caution and adjustment methods considered.
Keywords: I2 statistic; MR-Egger regression; Mendelian randomization; measurement error; simulation extrapolation.
© The Author 2016. Published by Oxford University Press on behalf of the International Epidemiological Association.
Figures
References
-
- Davey Smith G, Ebrahim S.. `Mendelian randomization': can genetic epidemiology contribute to understanding environmental determinants of disease? Int J Epidemiol 2003;32:1–22. - PubMed
Publication types
MeSH terms
Grants and funding
LinkOut - more resources
Full Text Sources
Other Literature Sources
Miscellaneous
