. 2016 Aug 26:10:83.
doi: 10.3389/fnana.2016.00083. eCollection 2016.

Ontogenic Changes and Differential Localization of T-type Ca(2+) Channel Subunits Cav3.1 and Cav3.2 in Mouse Hippocampus and Cerebellum

Affiliations

Ontogenic Changes and Differential Localization of T-type Ca(2+) Channel Subunits Cav3.1 and Cav3.2 in Mouse Hippocampus and Cerebellum

Carolina Aguado et al. Front Neuroanat. .

Abstract

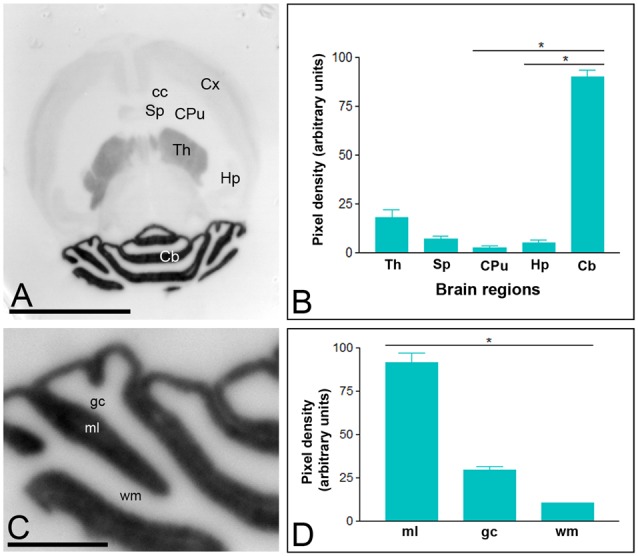
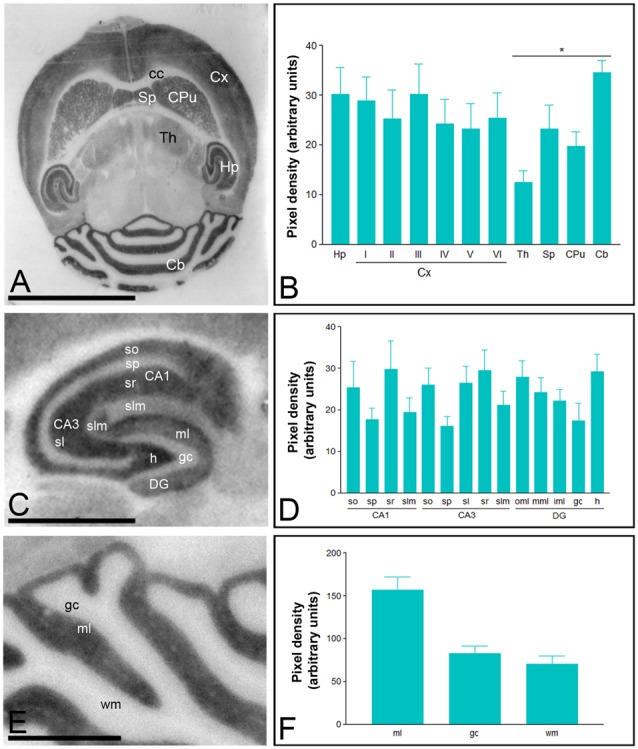
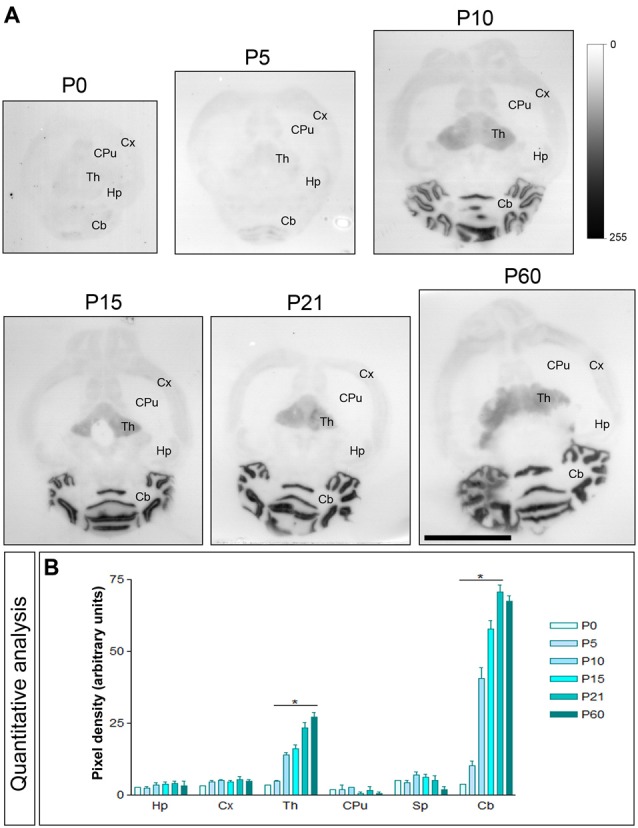
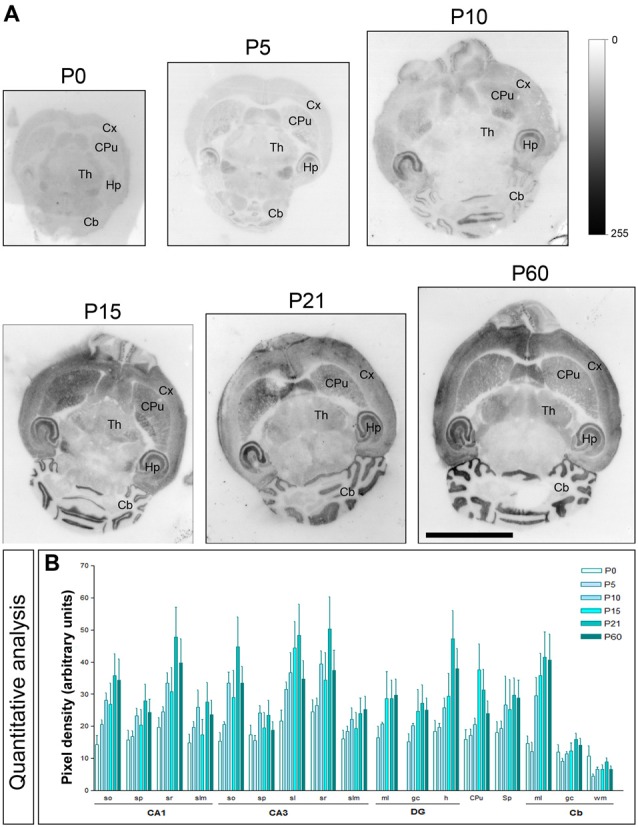
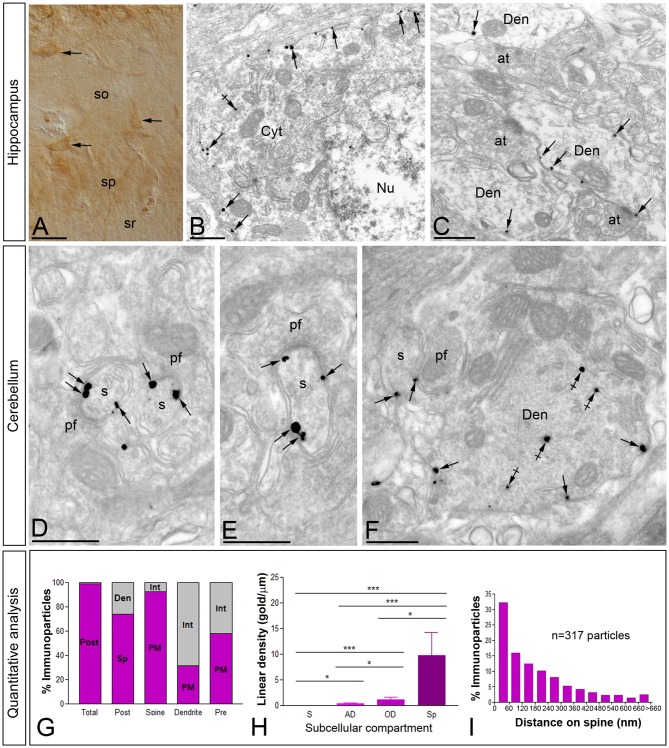
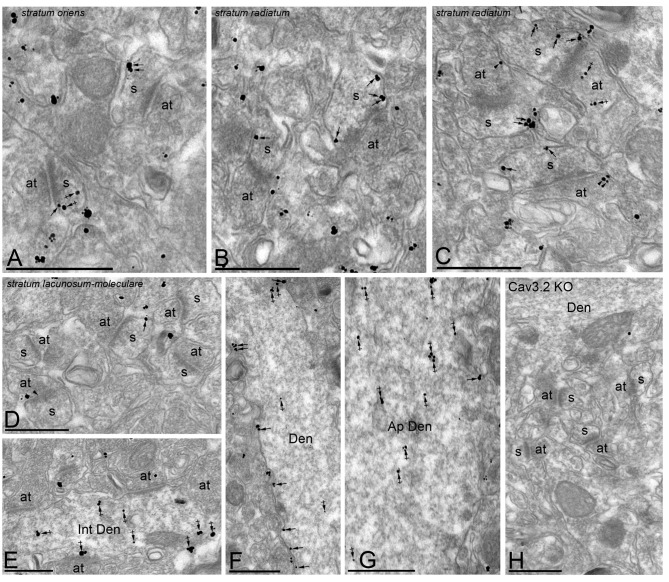
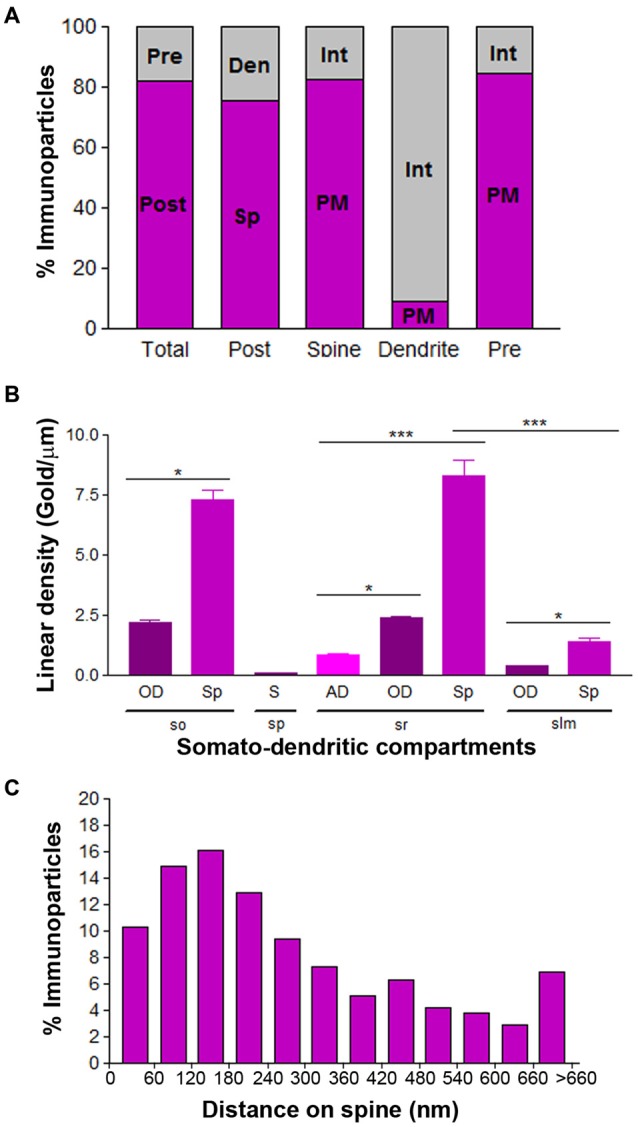
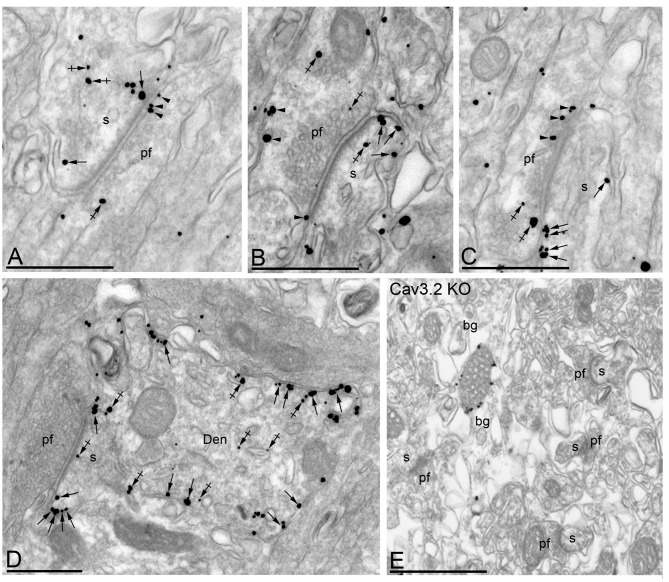
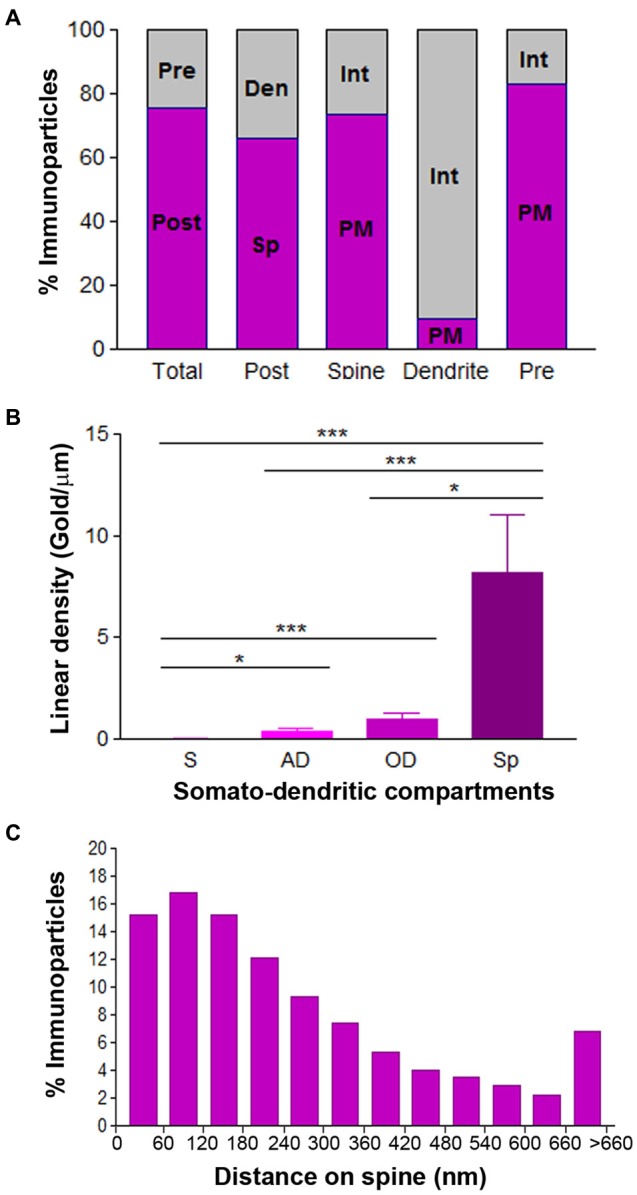
T-type calcium (Ca(2+)) channels play a central role in regulating membrane excitability in the brain. Although the contributions of T-type current to neuron output is often proposed to reflect a differential distribution of T-type channel subtypes to somato-dendritic compartments, their precise subcellular distributions in central neurons are not fully determined. Using histoblot and high-resolution immunoelectron microscopic techniques, we have investigated the expression, regional distribution and subcellular localization of T-type Cav3.1 and Cav3.2 channel subunits in the adult brain, as well as the ontogeny of expression during postnatal development. Histoblot analysis showed that Cav3.1 and Cav3.2 proteins were widely expressed in the brain, with mostly non-overlapping patterns. Cav3.1 showed the highest expression level in the molecular layer (ml) of the cerebellum (Cb), and Cav3.2 in the hippocampus (Hp) and the ml of Cb. During development, levels of Cav3.1 and Cav3.2 increased with age, although there were marked region- and developmental stage-specific differences in their expression. At the cellular and subcellular level, immunoelectron microscopy showed that labeling for Cav3.1 was present in somato-dendritic domains of hippocampal interneurons and Purkinje cells (PCs), while Cav3.2 was present in somato-dendritic domains of CA1 pyramidal cells, hippocampal interneurons and PCs. Most of the immunoparticles for Cav3.1 and Cav3.2 were either associated with the plasma membrane or the intracellular membranes, with notable differences depending on the compartment. Thus, Cav3.1 was mainly located in the plasma membrane of interneurons, whereas Cav3.2 was mainly located in the plasma membrane of dendritic spines and had a major intracellular distribution in dendritic shafts. In PCs, Cav3.1 and Cav3.2 showed similar distribution patterns. In addition to its main postsynaptic distribution, Cav3.2 but not Cav3.1 was also detected in axon terminals establishing excitatory synapses. These results shed new light on the subcellular localization of T-type channel subunits and provide evidence for the non-uniform distribution of Cav3.1 and Cav3.2 subunits over the plasma membrane of central neurons, which may account for the functional heterogeneity of T-type mediated current.

Keywords: calcium channels; cerebellum; electron microscopy; hippocampus; immunohistochemistry; quantification.


Figures

Figure 1
Figure 1
Regional distribution of the T-type Ca2+ channel Cav3.1 subtype in the adult mouse brain. (A–D) The distribution of the Cav3.1 protein was visualized in histoblots of horizontal brain sections at P90 using an affinity-purified anti-Cav3.1 antibody. Cav3.1 expression in different brain regions was determined by densitometric analysis of the scanned histoblots. The strongest expression was detected in the cerebellum (Cb) and thalamus (Th), with weaker expression in the septum (Sp), cortex (Cx) and hippocampus (Hp). The weakest expression level was detected in the caudate putamen (CPu). In the Cb, the strongest expression level was detected in the molecular layer (ml), with lowest intensity in the granule cell layer (gc) and white matter (wm). Error bars indicate SD; *P < 0.05. Scale bars: (A), 0.5 cm; (C), 0.1 cm.
Figure 2
Figure 2
Regional distribution of the T-type Ca2+ channel Cav3.2 subtype in the adult mouse brain. Protein distribution was visualized on histoblots of brain horizontal sections at P90 using affinity-purified anti-Cav3.2 antibodies. The developed histoblots were scanned and densitometric measurements from five independent experiments were averaged together to compare the protein densities. (A,B) The strongest expression was detected in the Cb, Hp, Sp, Cx and CPu, with weaker expression in the Th and no expression in the corpus callosum (cc). In the Cx, the strongest expression levels were found in layer III. (C,D) In the Hp, very strong Cav3.2 immunoreactivity was detected in the strata oriens (so) and radiatum (sr) of the CA1 and CA3 regions, as well as in the hilus and the outer 1/3 of ml of the dentate gyrus (DG). Moderate labeling was observed in the inner 2/3 of ml of the DG, weaker labeling in the stratum lacunosum-moleculare (slm) of the CA1 and CA3 regions. The weakest intensity was observed in the stratum pyramidale (sp) of the CA1 and CA3 regions and the gc of the DG. In the Cb, the strongest expression level was detected in the ml, and weaker in the gc and wm. Error bars indicate SD; *P < 0.05. h, hilus; sl, stratum lucidum. In panels (E,F): gc, granule cell layer; ml, molecular layer; wm, white matter. Scale bars: (A), 0.5 cm; (C,E), 0.1 cm.
Figure 3
Figure 3
Developmental and regional distribution of the T-type Ca2+ channel Cav3.1 subtype in the mouse brain. (A) Cav3.1 protein distribution was visualized on histoblots of brain horizontal sections at various stages of postnatal development using an affinity-purified anti-Cav3.1 antibody. Cav3.1 was expressed in the brain since the day of birth (P0), and at all stages the strongest expression was detected in the Cb and Th, with the lowest intensity in the CPu. (B) The histoblots were scanned and densitometric measurements from four independent experiments were averaged to compare the protein densities for each developmental time point. This quantitative analysis indicates that Cav3.1 expression increased progressively during postnatal development in the Cb and Th. In contrast, Cav3.1 expression does not change significantly from P0 to P60 in the Hp, Cx, CPu and Sp. Error bars indicate SEM; *P < 0.05 compared with P60. Scale bar, 0.5 cm.
Figure 4
Figure 4
Developmental and regional distribution of the T-type Ca2+ channel Cav3.2 subtype in the mouse brain. (A) Cav3.2 protein distribution was visualized on histoblots of brain horizontal sections at various stages of postnatal development using an affinity-purified anti-Cav3.2 antibody. Cav3.2 was widely expressed in the brain since the day of birth (P0), and at all stages the strongest expression level was detected in the Hp, Cb and CPu. (B) The histoblots were scanned and densitometric measurements from four independent experiments were averaged to compare the protein densities for each developmental time point. This quantitative analysis shows a differential Cav3.2 expression in a developmental stage- and region-specific manner. The CPu and Cb Cav3.2 expression increase with age peaking at P21. In most subfields of the Hp and Sp, the expression increase until P10, decreased at P15 and increased again to peak at P21. so, stratum oriens; sp, stratum pyramidale; sr, stratum radiatum; slm, stratum lasunosum-moleculare; sl, stratum lucidum; ml, molecular layer; gc; granule cell layer; h, hilus; wm, white matter. CA1, CA1 region of the Hp; CA3, CA3 region of the Hp; DG, dentate gyrus. Error bars indicate SEM. Scale bar, 0.5 cm.
Figure 5
Figure 5
Cellular and subcellular localization of Cav3.1 in the brain. Micrographs showing immunolabeling for Cav3.1 in the Hp and the Cb at P30. (A) Using the pre-embedding immunoperoxidase at the light microscopic level and differential interference contrast optic, labeling for Cav3.1 was detected in interneurons distributed in the so and sp of the hippocampal CA1. (B,C) In those interneurons, using the pre-embedding immunogold technique at the electron microscopic level, immunoparticles for Cav3.1 were detected along the plasma membrane of somata and dendritic shafts (Den). Few immunoparticles were observed at intracellular sites (crossed arrows). (D–F) In the ml of the Cb, immunoparticles for Cav3.1 were abundant on the extrasynaptic plasma membrane (arrows) of dendritic spines (s) of Purkinje cells (PCs), particularly at the edge of postsynaptic densities, contacted by terminals of parallel fibers (pf). In contrast, most immunoparticles for Cav3.1 in dendritic shafts (Den) were detected at intracellular sites (crossed arrows) and few along the extrasynaptic plasma membrane (arrows). (G–I) Quantitative analysis showing compartmentalization of Cav3.1 in PCs. (G) Bar graphs showing the percentage of immunoparticles for Cav3.1 in PCs. A total of 4306 immunoparticles were analyzed, and virtually all (99%) were postsynaptic. Dendritic spines were enriched in Ca3.1 immunoparticles (74%), of which most were distributed in the plasma membrane (92.3%). In contrast, immunoparticles in dendritic shafts (26%) were mostly distributed at intracellular sites (68.7%). (H) Somato-dendritic gradient of Cav3.1 along the surface of PCs. Density of Cav3.1 immunoparticles increased significantly from soma (S) to spines (Sp) of PCs. Error bars indicate SD; *P < 0.05; ***P < 0.001. AD, apical dendrites; OD, oblique dendrites. (I) Histogram showing the distribution of immunoreactive Cav3.1 in relation to glutamate release sites in PC dendritic spines. These data show an enrichment of Cav3.1 in the proximity of asymmetrical synapses on dendritic spines. at, axon terminal; Cyt, cytoplasm; Nu, nucleus; sr, stratum radiatum. Scale bars: (A), 50 μm; (B–F), 500 nm.
Figure 6
Figure 6
Cellular and subcellular localization of Cav3.2 in the Hp. Electron micrographs showing immunoparticles for Cav3.2 in the Hp, as detected using the pre-embedding immunogold technique at P30. (A–D) Cav3.2 immunoparticles were abundant on the extrasynaptic plasma membrane (arrows) of dendritic spines (s) of CA1 pyramidal cells contacted by axon terminals (at) in the so and sr but less frequent in the slm. Few immunoparticles were observed at intracellular sites (crossed arrows) in dendritic spines. Immunoparticles for Cav3.2 were also localized to the extrasynaptic plasma membrane (arrowheads) of axon terminals (at) establishing asymmetrical synapses with spines (s). (E–G) In dendritic shafts, immunoparticles for Cav3.2 were mainly found in the plasma membrane in oblique dendrites (OD) but mainly detected at intracellular sites (crossed arrows) in apical dendrites (AD). Cav3.2 immunoparticles were also detected in interneurons (Int Den) at intracellular sites (crossed arrows). (H) The antibody specificity was controlled and confirmed in the Hp of Cav3.2 KO mice that were free of any immunolabeling, with the exception of very few particles associated to mitochondria (arrow). Scale bars: (A–G), 500 nm.
Figure 7
Figure 7
Compartmentalization of Cav3.2 in CA1 pyramidal cells. (A) Bar graphs showing the percentage of immunoparticles for Cav3.2 at post- and presynaptic compartments and along plasma membrane vs. intracellular sites. A total of 3086 immunoparticles were analyzed, and 82.2% were postsynaptic and 17.8% presynaptic. Postsynaptically, 75.4% were detected in dendritic spines and 24.6% in dendritic shafts. Most immunoparticles in spines were in the plasma membrane (82.4%) and most in dendritic shafts were at intracellular sites (90.8%). (B) Change in the density of Cav3.2 in CA1 pyramidal cells as a function of distance from the soma. Density of Cav3.2 immunoparticles increased significantly from soma (S) to dendritic spines (Sp) in the so and sr, but not in the slm. Error bars indicate SD; *P < 0.05; ***P < 0.001. AD, apical dendrites; OD, oblique dendrites; sp, stratum pyramidale. (C) Histogram showing the distribution of immunoreactive Cav3.2 in relation to glutamate release sites in dendritic spines of CA1 pyramidal cells. Data are expressed as the proportion of immunoparticles at a given distance from the edge of the synaptic specialization. These data show that 64% of all Cav3.2 immunoparticles were distributed within the first 300 nm from the edge of asymmetrical synapses.
Figure 8
Figure 8
Cellular and subcellular localization of Cav3.2 in the Cb. Electron micrographs showing immunoparticles for Cav3.2 in the ml of the Cb, as detected using the pre-embedding immunogold technique at P30. (A–C) Immunoparticles for Cav3.2 were mostly distributed along the extrasynaptic plasma membrane (arrows) of dendritic spines (s) of PCs contacted by terminals of parallel fibers (pf), and to a lesser extent at intracellular sites (crossed arrows) in PC spines. Cav3.2 immunoparticles were also distributed presynaptically, in axon terminals of pf. Most of these presynaptic immunoparticles were localized in the plasma membrane (arrowheads) of active zone and extrasynaptically, and a few were distributed at intracellular sites (crossed arrows). (D) In dendritic shafts (Den), immunoparticles for Cav3.2 were more frequently detected at intracellular sites (crossed arrows) than along the extrasynaptic plasma membrane (arrows). (E) The antibody specificity was controlled and confirmed in the Cb of Cav3.2 KO mice that were free of any immunolabeling, with the exception of very few particles associated to mitochondria (arrow). Scale bars: (A–E), 500 nm.
Figure 9
Figure 9
Compartmentalization of Cav3.2 in PCs. (A) Bar graphs showing the percentage of immunoparticles for Cav3.2 in PCs. A total of 3123 immunoparticles were analyzed, and 75.7% were postsynaptic and 24.3% presynaptic. Postsynaptically, 66.1% were detected in dendritic spines and 33.9% in dendritic shafts. Most immunoparticles in spines were in the plasma membrane (73.3%) and most in dendritic shafts were at intracellular sites (90.5%). (B) Change in the density of Cav3.2 in PCs as a function of distance from the soma. Density of Cav3.1 immunoparticles increased significantly from soma (S) to spines (Sp) of PCs. Error bars indicate SD; *P < 0.05; ***P < 0.001. AD, apical dendrites; OD, oblique dendrites. (C) Histogram showing the distribution of immunoreactive Cav3.2 in relation to glutamate release sites in PC dendritic spines. These data show that 69% of all Cav3.2 immunoparticles were distributed within the first 300 nm from the edge of asymmetrical synapses.

References

    1. Ballesteros-Merino C., Lin M., Wu W. W., Ferrándiz-Huertas C., Cabañero M. J., Watanabe M., et al. . (2012). Developmental profile of SK2 channel expression and function in CA1 neurons. Hippocampus 22, 1467–1480. 10.1002/hipo.20986 - DOI - PMC - PubMed
    1. Ballesteros-Merino C., Watanabe M., Shigemoto R., Fukazawa Y., Adelman J. P., Luján R. (2014). Differential subcellular localization of SK3-containing channels in the hippocampus. Eur. J. Neurosci. 39, 883–892. 10.1111/ejn.12474 - DOI - PubMed
    1. Carter A. G., Sabatini B. L. (2004). State-dependent calcium signaling in dendritic spines of striatal medium spiny neurons. Neuron 44, 483–493. 10.1016/j.neuron.2004.10.013 - DOI - PubMed
    1. Catterall W. A. (2000). Structure and regulation of voltage-gated Ca2+ channels. Annu. Rev. Cell Dev. Biol. 16, 521–555. 10.1146/annurev.cellbio.16.1.521 - DOI - PubMed
    1. Chemin J., Monteil A., Perez-Reyes E., Bourinet E., Nargeot J., Lory P. (2002). Specific contribution of human T-type calcium channel isotypes (α1G, α1H and α1I) to neuronal excitability. J. Physiol. 540, 3–14. 10.1113/jphysiol.2001.013269 - DOI - PMC - PubMed