Review
. 2016 Sep 8;4(1):59.
doi: 10.1186/s40560-016-0182-z. eCollection 2016.

Glycocalyx and its involvement in clinical pathophysiologies

Affiliations
Review

Glycocalyx and its involvement in clinical pathophysiologies

Akira Ushiyama et al. J Intensive Care. .

Abstract

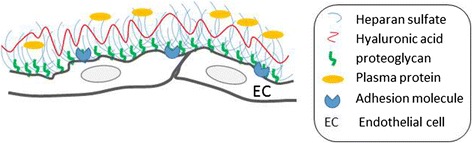
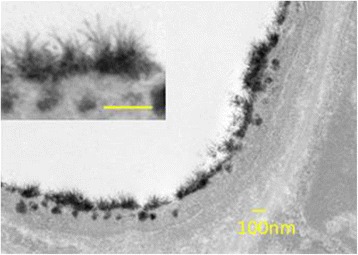
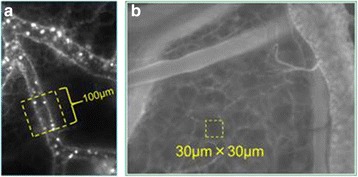
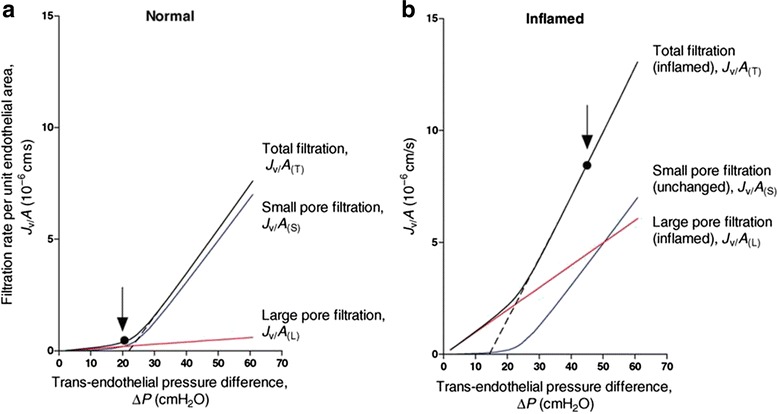
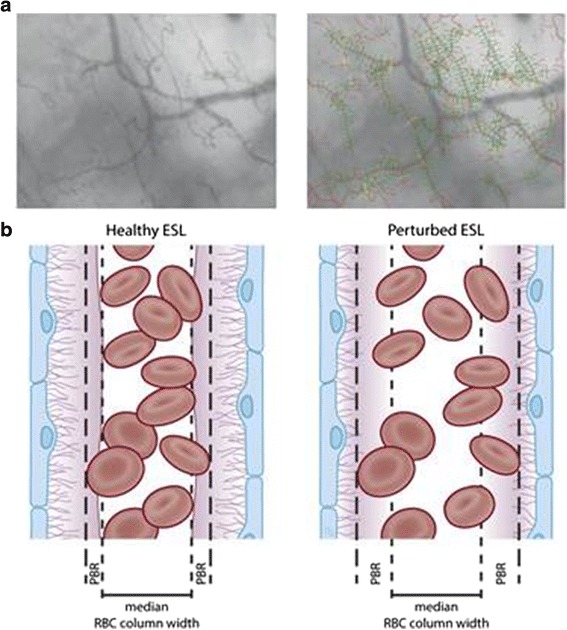
Vascular hyperpermeability is a frequent intractable feature involved in a wide range of diseases in the intensive care unit. The glycocalyx (GCX) seemingly plays a key role to control vascular permeability. The GCX has attracted the attention of clinicians working on vascular permeability involving angiopathies, and several clinical approaches to examine the involvement of the GCX have been attempted. The GCX is a major constituent of the endothelial surface layer (ESL), which covers most of the surface of the endothelial cells and reduces the access of cellular and macromolecular components of the blood to the surface of the endothelium. It has become evident that this structure is not just a barrier for vascular permeability but contributes to various functions including signal sensing and transmission to the endothelium. Because GCX is a highly fragile and unstable layer, the image had been only obtained by conventional transmission electron microscopy. Recently, advanced microscopy techniques have enabled direct visualization of the GCX in vivo, most of which use fluorescent-labeled lectins that bind to specific disaccharide moieties of glycosaminoglycan (GAG) chains. Fluorescent-labeled solutes also enabled to demonstrate vascular leakage under the in vivo microscope. Thus, functional analysis of GCX is advancing. A biomarker of GCX degradation has been clinically applied as a marker of vascular damage caused by surgery. Fragments of the GCX, such as syndecan-1 and/or hyaluronan (HA), have been examined, and their validity is now being examined. It is expected that GCX fragments can be a reliable diagnostic or prognostic indicator in various pathological conditions. Since GCX degradation is strongly correlated with disease progression, pharmacological intervention to prevent GCX degradation has been widely considered. HA and other GAGs are candidates to repair GCX; further studies are needed to establish pharmacological intervention. Recent advancement of GCX research has demonstrated that vascular permeability is not regulated by simple Starling's law. Biological regulation of vascular permeability by GCX opens the way to develop medical intervention to control vascular permeability in critical care patients.

Keywords: Endothelial surface layer; Glycocalyx; Heparan sulfate; Hyaluronan; Lectin; Leukocyte; Sepsis; Starling’s law; Syndecan-1; Vascular permeability.


Figures

Fig. 1
Fig. 1
Structural diagram of the ESL. The ESL is composed of a layer of PGs and GAGs lining the luminal surface of the endothelium. The image is not shown to scale
Fig. 2
Fig. 2
GCX layer visualized using transmission electron microscopy. Mice were fixed by perfusion with glutaraldehyde-lanthanum solution. The photos show a post-capillary venule under normal conditions. (The image was originally obtained by H. Kataoka)
Fig. 3
Fig. 3
Typical experimental methods used to analyze GCX/ESL function. a Fluorescent-labeled leukocytes in microvasculature. To quantify the leukocyte-endothelium interaction, fluorescence-labeled leukocytes in flowing blood were observed within a region of interest (ROI) during a 30-s video recording, and adhesive and/or rolling leukocytes were counted. b Permeable analysis using FITC dextran. To analyze vascular permeability, fluorescence-labeled dextran was injected and time-dependent changes in brightness within an ROI (yellow box) set over the interstitium were identified using image analysis software. (These images were originally obtained by H. Kataoka)
Fig. 4
Fig. 4
Steady-state fluid exchange simulated for a post-capillary venule, with the fluid-conducting pathways modeled as parallel small pore and large pore populations, under normal and inflamed conditions. a Basal low permeability state: 95 % of the hydraulic conductance is represented by small pores (radius = 4 nm; blue curve) and 5 % is represented by large pores (radius = 22.5 nm; red curve). The black solid curve shows the total fluid exchange (sum of the red and blue lines) at varying values of Pc. The vessel was perfused with Ringer solution containing serum albumin (Πp = 25 cmH2O). Pi was assumed to be constant, and the aquaporin pathway was negligible (≤10 % of total conductance). b Steady-state fluid exchange under increased permeability conditions in the same vessel as that shown in a. The red curve represents the flow through the large pore system after inflammation had increased the number of large pores by tenfold. The small pore population remained unchanged. The dashed lines represent extrapolations of the linear parts of the steady-state summed relations to the pressure axis, where their intersection gives the value of the effective COP opposing fluid filtration (reduced during inflammation). The vertical arrows show the typical microvascular pressures under the basal condition (A) and during mild inflammation (b). The increase in pressure contributed to the dramatic 17-fold increase in the filtration rate (cited from Levick JR, Michel CC. Cardiovasc Res. 2010;87(2):198–210.)
Fig. 5
Fig. 5
Sidestream dark field (SDF) imaging for measuring the perfused boundary region (PBR) in the sublingual capillary bed. a Recording of the sublingual capillary bed captured using an SDF camera (left). The capillaries are automatically recognized and analyzed after various quality checks (right). Based on the shift in the red blood cell (RBC) column width over time, the PBR can be calculated. b Model of a blood vessel showing the PBR under healthy conditions (left). The EG prevents the RBC from approaching the endothelial cell; thus, the PBR is relatively small. Under disease conditions (right) or after enzymatic breakdown of the EG in an animal model, the damaged EG allows the RBCs to approach the endothelium more often. This results in a higher variation in RBC column width, which is reflected as a high PBR. ESL, endothelial surface layer (cited from Dane MJ, van den Berg BM, et al. Am J Physiol Renal Physiol. 2015,308(9):F956–F966)

References

    1. Danielli J. Capillary permeability and oedema in the perfused frog. J Physiol. 1940;98:109–129. doi: 10.1113/jphysiol.1940.sp003837. - DOI - PMC - PubMed
    1. Chambers R, Zweifach B. Intercellular cement and capillary permeability. Physiol Rev. 1947;27:436–463. - PubMed
    1. Copley A. Hemorheological aspects of the endothelium-plasma interface. Microvasc Res. 1974;8:192–212. doi: 10.1016/0026-2862(74)90094-6. - DOI - PubMed
    1. Luft JH. Fine structures of capillary and endocapillary layer as revealed by ruthenium red. Fed Proc. 1966;25(6):1773–1783. - PubMed
    1. Pries AR, Secomb TW, Gaehtgens P. The endothelial surface layer. Pflugers Arch. 2000;440:653–666. doi: 10.1007/s004240000307. - DOI - PubMed

LinkOut - more resources