. 2016 Oct;18(10):1054-1064.
doi: 10.1038/ncb3406. Epub 2016 Sep 12.

Self-repair promotes microtubule rescue

Affiliations

Self-repair promotes microtubule rescue

Charlotte Aumeier et al. Nat Cell Biol. 2016 Oct.

Abstract

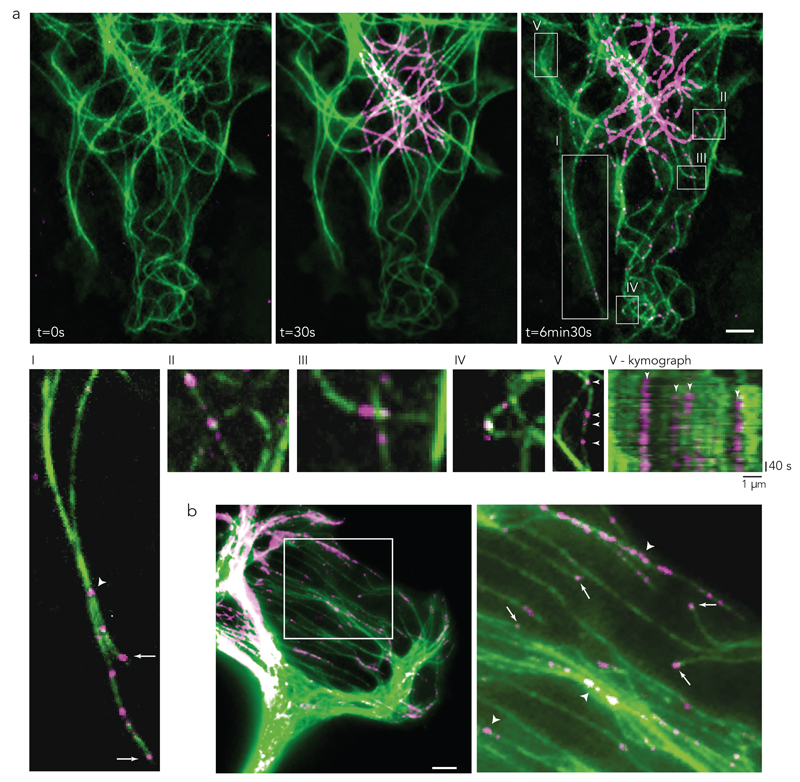
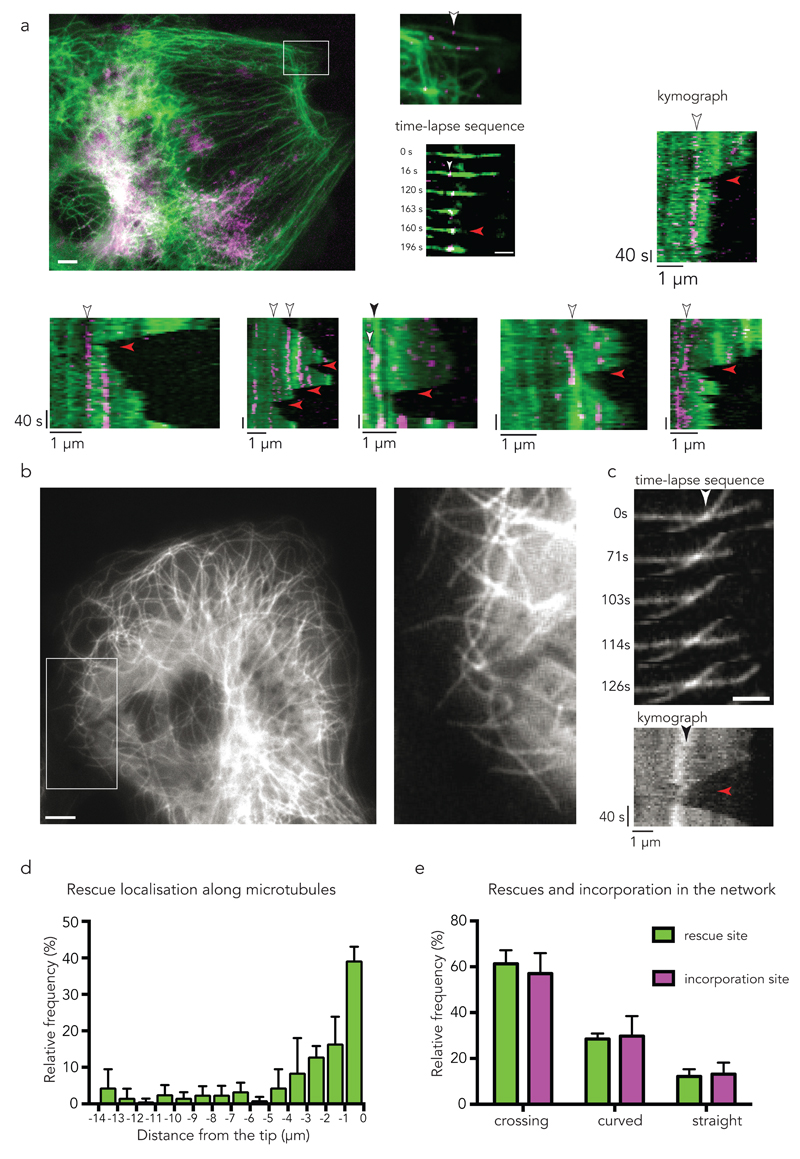
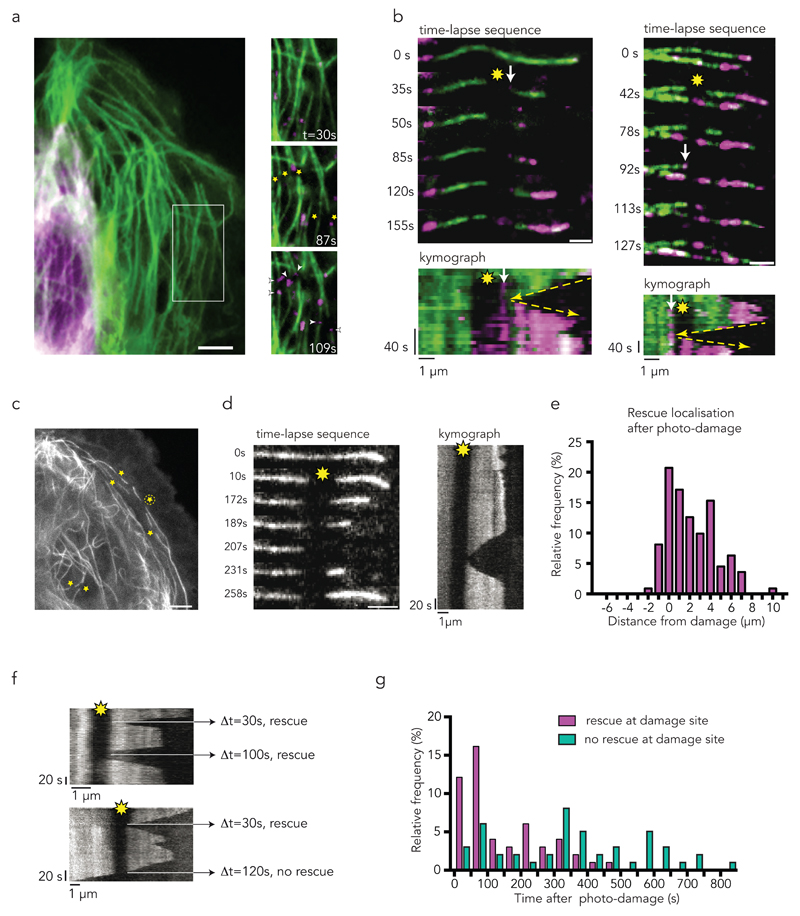
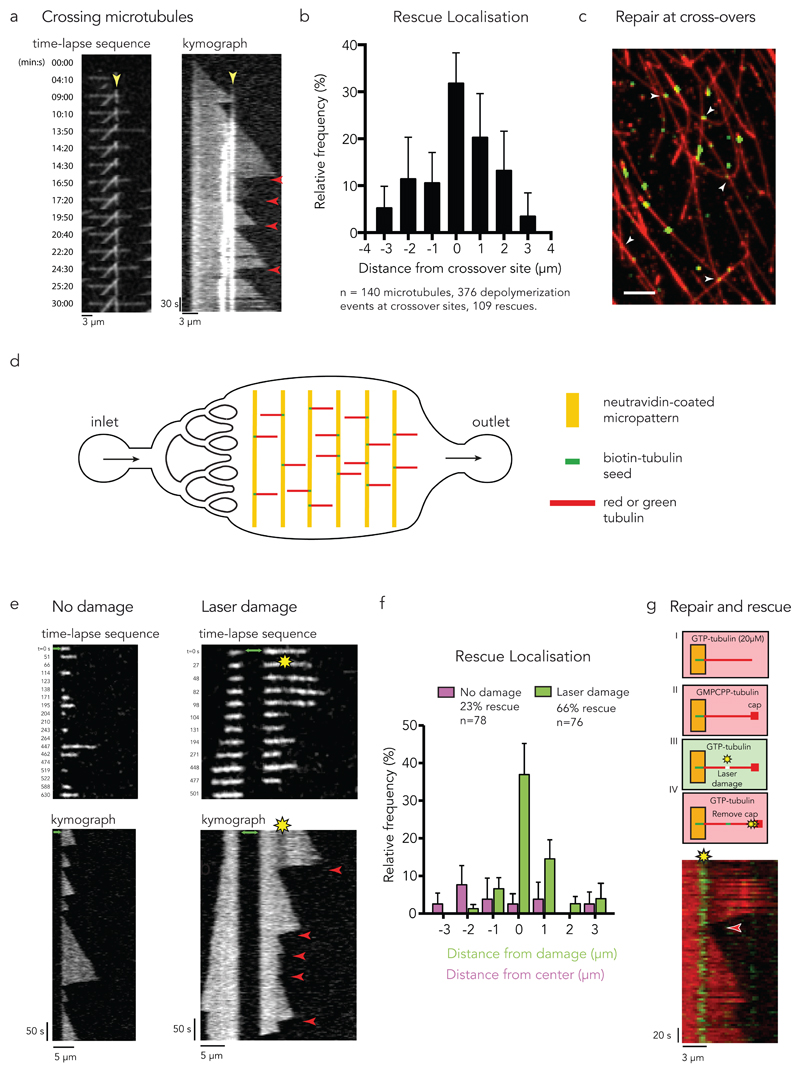
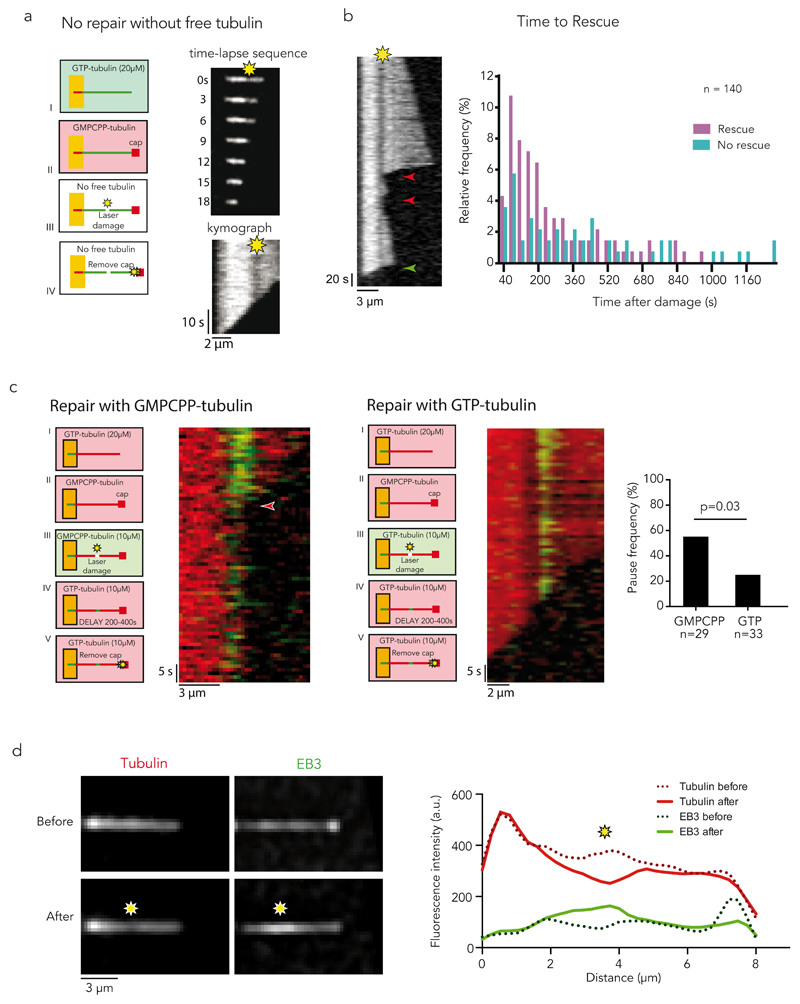
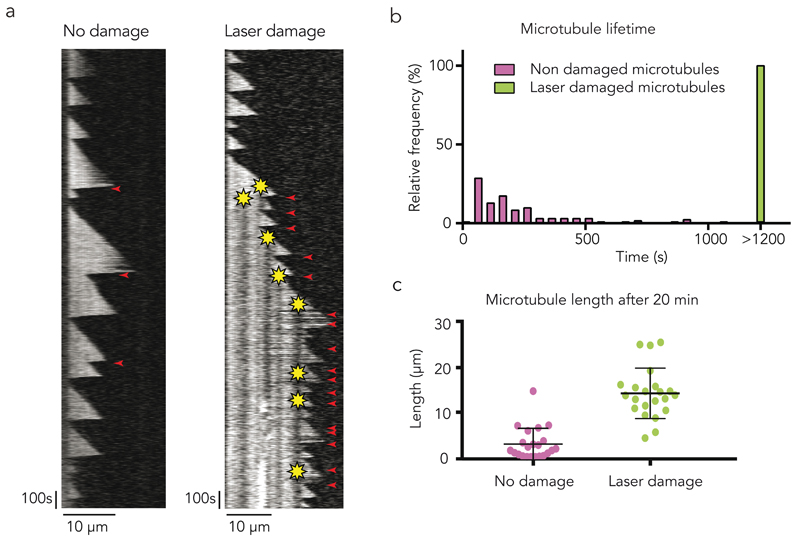
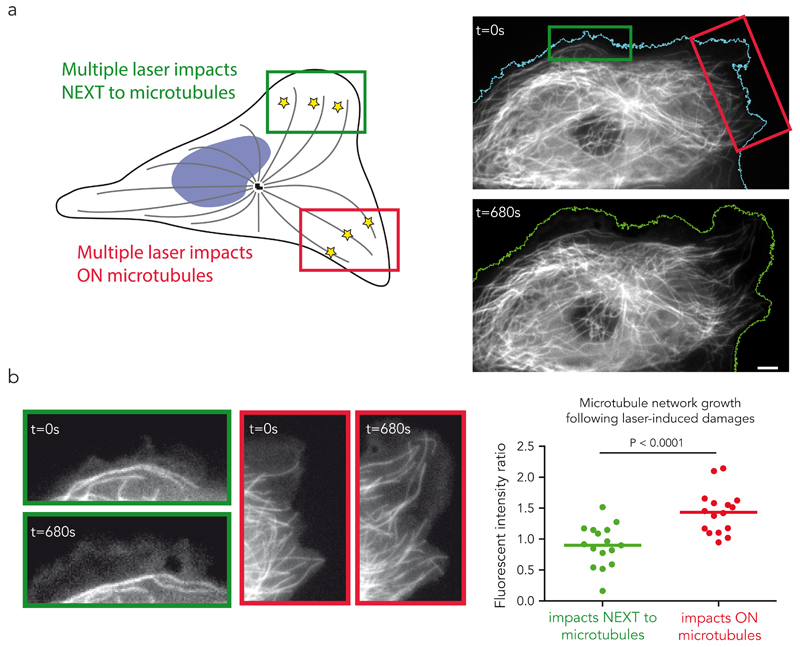
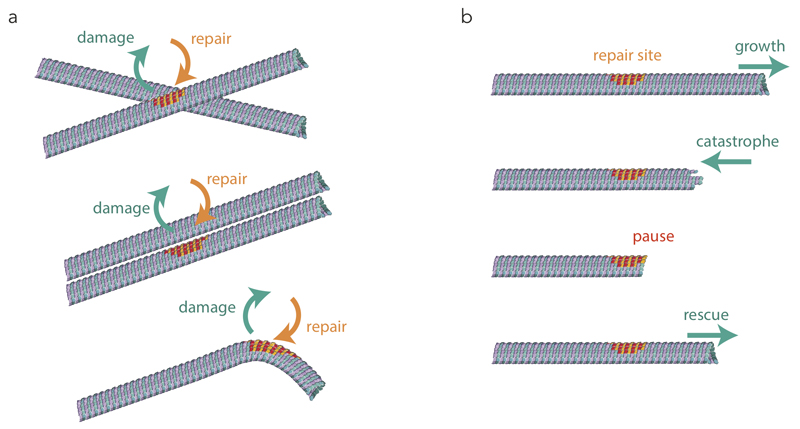
The dynamic instability of microtubules is characterized by slow growth phases stochastically interrupted by rapid depolymerizations called catastrophes. Rescue events can arrest the depolymerization and restore microtubule elongation. However, the origin of these rescue events remains unexplained. Here we show that microtubule lattice self-repair, in structurally damaged sites, is responsible for the rescue of microtubule growth. Tubulin photo-conversion in cells revealed that free tubulin dimers can incorporate along the shafts of microtubules, especially in regions where microtubules cross each other, form bundles or become bent due to mechanical constraints. These incorporation sites appeared to act as effective rescue sites ensuring microtubule rejuvenation. By securing damaged microtubule growth, the self-repair process supports a mechanosensitive growth by specifically promoting microtubule assembly in regions where they are subjected to physical constraints.


Conflict of interest statement

Competing financial interests. The authors have no competing financial interests.

Figures

Figure 1
Figure 1. Microtubule self-repair in living cells.
(a) PTK2 cell expressing mEos2 pre- and post-conversion. Converted free tubulin dimers (magenta) diffused through the cytoplasm. Signal of converted dimers (magenta) was observed at the growing tips as well as in spot-like structures along the length of pre-existing microtubules (green). (I-V) Enlarged regions of a. (I) Bundled microtubules with photo-converted tubulin spots within the bundle (arrowhead) and at the growing tip (arrow). (II-III) Incorporation of converted dimers (magenta) in pre-existing microtubule (green) at microtubule crossing sites. (IV) Incorporation of converted dimers (magenta) in pre-existing microtubule (green) at bent sites. (V) Incorporation along pre-existing microtubule (arrowhead) with corresponding kymograph. Bottom white arrowhead in (V) is represented by the first left arrowhead of the kymograph in (V-kymograph). (b) After photo-conversion magenta-tubulin signal was observed at growing microtubule tips (arrow). True incorporation was not distinguishable from growing tips within bundled microtubules (arrowhead). Arrows are growing microtubule tips after photo-conversion; arrowheads are sites of incorporation of converted tubulin dimers (magenta) in pre-existing microtubule. Images are representative of 5 independent experiments. Scale bar 5 µm.
Figure 2
Figure 2. Self-repair sites are rescue sites in living cells.
(a) Photo-converted tubulin dimers (magenta) in pre-existing microtubule (green). The white arrow head in the inset point at a repair site along a single microtubule. Scale bar 5 µm. The time-lapse sequence shows the occurrence of a rescue event (red arrow head) at the site of incorporation with corresponding kymograph (right panels). Scale bar 2 µm. Kymographs at the bottom show additional examples of repair sites (white arrow heads) associated with rescue events (red arrow heads). Kymograph in the third panel shows an incorporation (white arrow head) and rescue event (red arrow head) at a microtubule crossing site (black arrow head). Images are representative of 5 independent experiments. (b) The localization of rescue events were analysed within the cell margin of PTK2 cells stably expressing GFP-tubulin. Enlarged region (white rectangle) of a representative analysed area. Scale bar 5 µm. (c) Representative time sequence of a rescue event at a microtubule crossing site (white arrowhead) with corresponding kymograph. Black arrow indicates the crossing site within the kymograph, the red arrow points at the rescue event. Images in 2 b,c are representative of 5 independent experiments. Scale bar 2 µm. (d) Histogram of the distance of rescue events with respect to the growing tip (set to zero) in PTK2 GFP-tubulin cells. Data represent mean +/- s.d, n= 148 rescue events from 4 cells. (e) Correlation of the site of rescue with the site of incorporation. Relative frequency of the localization of the rescue event with respect to crossing sites, curved sites and straight microtubules. Relative frequency of the localization of the incorporation with respect to crossing sites, curved sites and straight microtubules. Incorporation was analysed in fixed cells 2 min after photo-conversion. Data represent mean +/- s.d, n= 79 rescue events from 4 cells, and n= 113 incorporation events from 4 cells.
Figure 3
Figure 3. Photo-damaged sites are repair and rescue sites in living cells.
Yellow star indicates photo-damage sites; white arrow indicates site of incorporation of photo-converted tubulin dimers (magenta). Yellow arrow is tracking the depolymerisation, rescue, and growth event. (a) Laser induced photo-damage sites (star) get repaired (arrowhead) by converted tubulin dimers (magenta) over time. (b) Time-lapse sequence with corresponding kymographs of microtubules after laser induced photo-damage (yellow star). Incorporation (arrow) of converted tubulin dimers (magenta) occurs at the photo-damage sites and act as rescue sites. Note within the kymographs that rescue occurs at the exact position of repair site, highlighted by yellow arrows. Scale bar 2 µm. (c) Representative sites of laser induced photo-damage within the cell margin and near the nucleus (yellow stars) of PTK2 GFP-tubulin cells. Time sequence and kymograph of the rescue event of the microtubule labelled with an encircled star is shown in d. Scale bar 5 µm. (d) Representative time-lapse sequence and corresponding kymograph of analysed microtubule after photo-damage (yellow star). Microtubule rescues at the photo-damage site. Images are representative of 5 independent experiments. Scale bar 2 µm. (e) Histogram of the localization of the 111 rescue events with respect to the 51 photo-damage site in 20 PTK2 GFP-tubulin cells. All rescues occurring along the microtubule tip were taken into account. Center of the photo-damage site is x = zero; average size of photo-damage was 1.2 µm. 50 % of the rescues occurred within the damage site. Only one rescue event was observed shortly after the damage site. The other 50% of rescues were observed along the microtubule closer to the tip, where the frequency of rescue is reported to be high. (f) Multiple rescues at a photo-damage site (yellow star) were observed occasionally. Microtubule depolymerized eventually over the photo-damage site after rescue events (bottom image). (g) Histogram of the time between the induction of photo-damage (t= 0 s) and observation of the rescue or depolymerization event in 10 cells showing 52 rescues at damaged site and 47 absence of rescue at damaged sites. Rescue events are most frequent within 250 s after photo-damage. No rescue was observed after 550 s.
Figure 4
Figure 4. Microtubule self-repair induces rescue events in vitro.
(a) Rescue at crossing microtubules. Time-lapse sequence of 3 microtubules crossing each other. The kymograph highlights the crossing sites (yellow arrow-head pointing at the bright white vertical lines) and the occurrence of multiple rescue events at this site (red arrow-heads). (b) The graph shows the frequency of rescue events for crossing microtubules as a function of distance from the crossing site. Data represent mean +/- s.d from n=8 independent experiments. (c) Repair at crossing microtubules. Observation of the incorporation of green tubulin dimers along red microtubules. White arrow-heads point at crossing sites where accumulation of green tubulin was detected. Image is representative of 3 independent experiments. Scale bar 5 µm. (d) Illustration of the microfluidic device. Short biotinylated microtubule seeds were fixed on neutravidin coated micropatterns and elongated using red or green free tubulin. To exchange or remove the solution of free tubulin, a flow was induced parallel to the microtubules. (e) Photo damage sites can induce rescue. The image sequences and kymographs show microtubule dynamics with (right) and without (left) laser-induced damage. The green arrows indicate the seed. Red arrow-heads indicate rescue events. (f) The graph shows the frequency of rescue events for photo damaged microtubules as a function of distance from the center of the damage (green bars) and for microtubules without damage as a distance from the center of the observed microtubule (magenta bars). Data represent mean values +/- s.d from n= 4 independent experiments. (g) Tubulin incorporation at photodamaged sites is associated with rescue. Green microtubule seeds were elongated with red free tubulin (step I). A GMPCPP cap was grown at the microtubule tip to avoid spontaneous depolymerization (step II). Photo damage was induced in the presence of green tubulin (step III). Depolymerization was initiated by removing the GMPCPP cap with a laser pulse at high intensity (step IV). The kymograph shows rescue (red arrow-head) at the damaged site where green tubulin was incorporated. Image is representative of 4 independent experiments.
Figure 5
Figure 5. Incorporation and hydrolysis of free tubulin.
(a) Damage without repair. Red microtubule seeds were elongated with green free tubulin (step I). A GMPCPP cap was grown at the microtubule tip to avoid spontaneous depolymerization (step II). Photo damage was induced in the absence of free tubulin (step III). Depolymerization was initiated by removing the GMPCPP cap with a laser pulse at high intensity (step IV). The time-lapse sequence and kymograph show no rescue nor pause at the damaged, and non-repaired, site. See quantification in supplementary figure 4. (b) Rescue Lifetime. Kymograph shows multiple rescues (red arrow-heads) at a photo-damage site (yellow star) eventually followed by microtubule depolymerisation (green arrow-head). The graph represents the time between inducing the damage and observation of the rescue or depolymerisation event. Rescue events become less frequent as the time after damage increases. No rescue could be observed 17 minutes after inducing the damage. (c) Hydrolysis of incorporated tubulins. Red microtubules were laser damaged and repaired with non-hydrolyzable (GMPCPP, left panels) or hydrolysable (GTP, right panels) tubulin. After an additional delay of 3 to 6 minutes the cap was removed in the presence of sub-critical concentration of free tubulin. The graph shows the frequency of pauses (highlighted in the left panel with a red arrow-head) in both cases. Non-hydrolysable tubulins increased the lifetime of repair and rescue sites. A Chi-square test was used to compare pause frequencies for GTP and GMPCPP. n represents the number of microtubules that were allowed to repair in the presence of GTP and GMPCPP, respectively. (d) EB3 recruitment at repair sites. Red microtubules were photodamaged in the presence of red-fluorescent free tubulin dimers and EB3-GFP. Images show microtubule fluorescence in the red (left) and green (right) channels, before (top) and after (bottom) the laser-induced damage. The graph shows fluorescent linescans along this microtubule before and after the damage. The yellow star represents the damaged site. More examples are shown in Supplementary Figure 5 as well as absence of EB3 recruitment in the absence of free tubulin. Images are representative of 5 independent experiments.
Figure 6
Figure 6. Self-repair biases microtubule dynamic instability in vitro.
(a) The kymograph on the left shows a typical non-damaged microtubule with infrequent rescue events. On the right, the microtubule was damaged several times close to the tip as soon as it grew out long enough. Though catastrophe events were frequent, this microtubule was protected from complete depolymerisation by the photo damage. Yellow star indicates the photo-damage site. Red arrowhead indicates rescue events. (b) Damages increase microtubule lifetime. The graph shows the distribution of 28 laser damaged (green) and 133 non-damaged (magenta) microtubule lifetime. Damaged microtubule lifetime was found to be considerably longer than the lifetime of non-damaged microtubules. (c) Damages increase microtubule length. The graph shows the length of laser damaged (green) and non-damaged (magenta) microtubule after 20 minutes. Error bars show mean +/- s.d. for n = 22 microtubules per condition, pooled from 4 independent experiments.
Figure 7
Figure 7. Self-repair biases microtubule dynamic instability in vivo.
(a) Repeated microtubule shooting “on” and “off-target”. Laser induced photo-damage were targeted either on the microtubules, in the red region, or next to the microtubules, in the green region. The images show the cell before (top) and after (bottom) the shooting. Comparison of the left and right cell margin pre- and post-photo-damage. Scale bar is 5 µm. (b) Preferential microtubule network growth in damaged regions. Images show the microtubule network in the “on-target” (red) and “off-target” (green) regions before (t=0s) and after (t=680s) the shooting. The graph shows the after/before ratio of the mean microtubule fluorescence intensity in each region. Lines represent mean values from n=16 cells from 4 independent experiments. P value was generated by a wilcoxon paired test. The total microtubule length increased in the regions where the laser impacts were targeted on the microtubules. Scale bar is 2 µm.
Figure 8
Figure 8. Microtubule self-repair and rescue.
(a) Microtubule self-repair. The schemes show the preferential microtubules’ conformation in which free tubulin incorporation (orange-red) was observed along pre-existing microtubules (green-blue) in living cells. (b) Microtubule rescue at self-repair sites. The schemes show the interruption of microtubule depolymerisation at the repaired site (shown with orange-red dimers) and the induction of microtubule regrowth.

Comment in

References

    1. Mimori-Kiyosue Y. Shaping microtubules into diverse patterns: Molecular connections for setting up both ends. Cytoskeleton. 2011;68:603–618. - PubMed
    1. Hammond JW, et al. Posttranslational modifications of tubulin and the polarized transport of kinesin-1 in neurons. Mol Biol Cell. 2010;21:572–83. - PMC - PubMed
    1. Winans AM, Collins SR, Meyer T. Waves of actin and microtubule polymerization drive microtubule-based transport and neurite growth before single axon formation. Elife. 2016;5:1–22. - PMC - PubMed
    1. Stiess M, et al. Axon extension occurs independently of centrosomal microtubule nucleation. Science. 2010;327:704–7. - PubMed
    1. Wadsworth P. Regional regulation of microtubule dynamics in polarized, motile cells. Cell Motil Cytoskeleton. 1999;42:48–59. - PubMed

Publication types