. 2016 Nov;12(11):937-943.
doi: 10.1038/nchembio.2172. Epub 2016 Sep 12.

Lactate metabolism is associated with mammalian mitochondria

Affiliations

Lactate metabolism is associated with mammalian mitochondria

Ying-Jr Chen et al. Nat Chem Biol. 2016 Nov.

Abstract

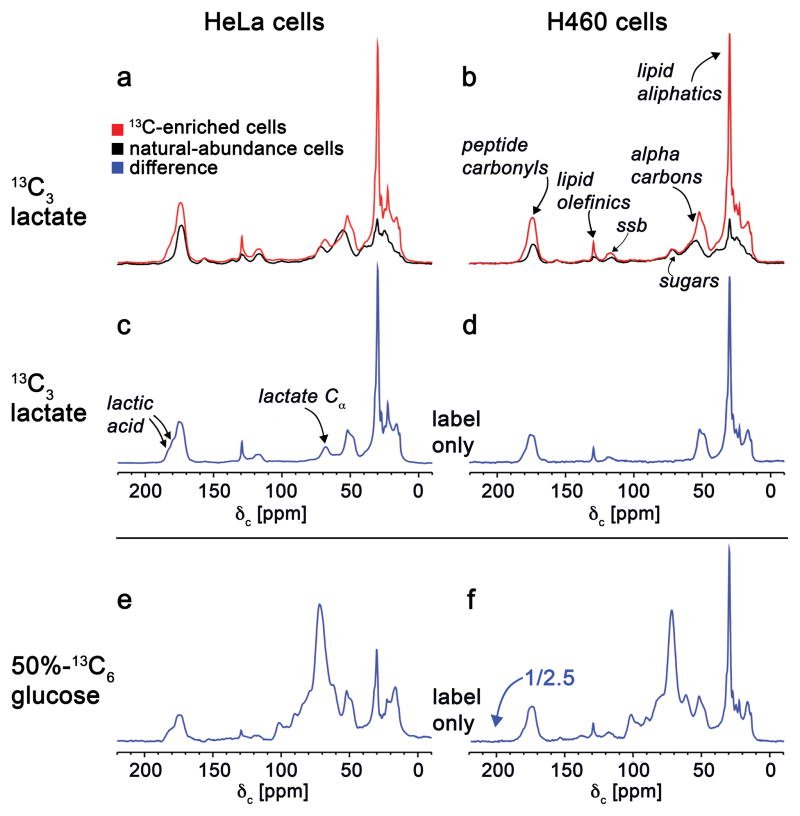
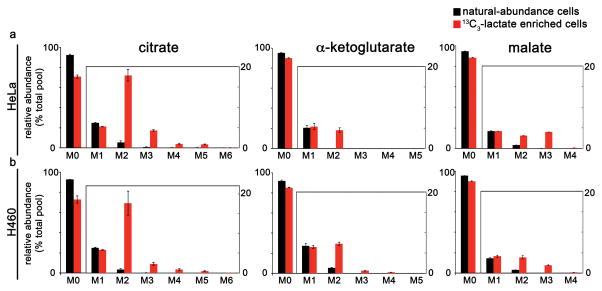
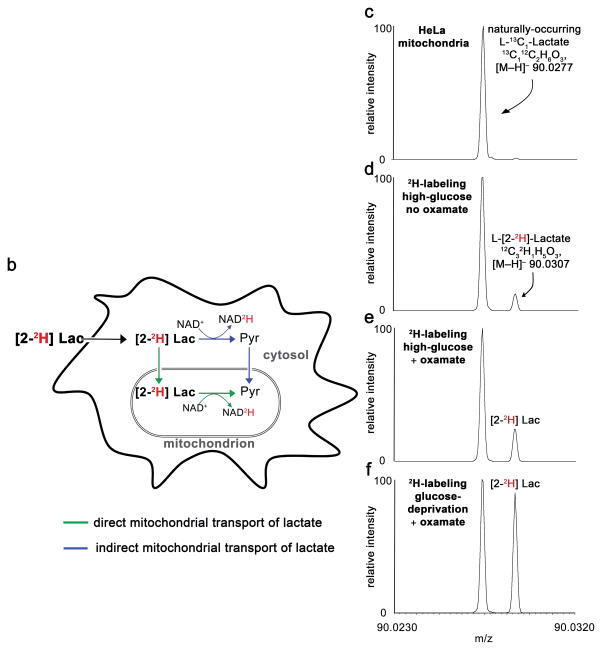
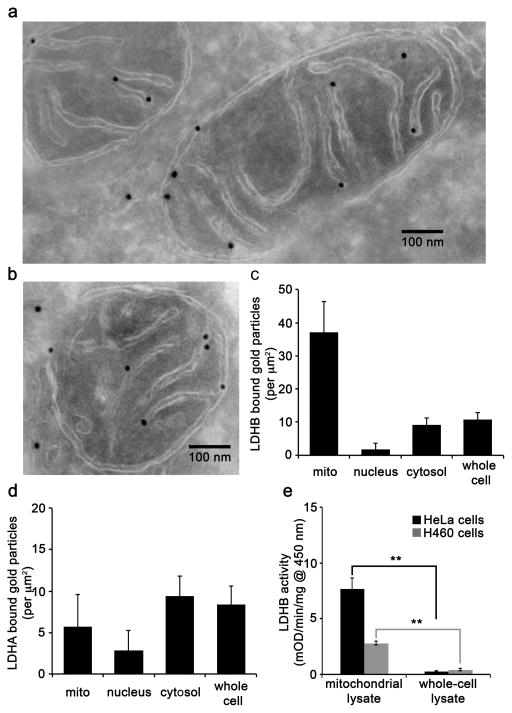
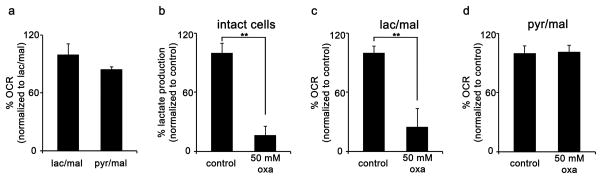
It is well established that lactate secreted by fermenting cells can be oxidized or used as a gluconeogenic substrate by other cells and tissues. It is generally assumed, however, that within the fermenting cell itself, lactate is produced to replenish NAD+ and then is secreted. Here we explore the possibility that cytosolic lactate is metabolized by the mitochondria of fermenting mammalian cells. We found that fermenting HeLa and H460 cells utilize exogenous lactate carbon to synthesize a large percentage of their lipids. Using high-resolution mass spectrometry, we found that both 13C and 2-2H labels from enriched lactate enter the mitochondria. The lactate dehydrogenase (LDH) inhibitor oxamate decreased respiration of isolated mitochondria incubated in lactate, but not of isolated mitochondria incubated in pyruvate. Additionally, transmission electron microscopy (TEM) showed that LDHB localizes to the mitochondria. Taken together, our results demonstrate a link between lactate metabolism and the mitochondria of fermenting mammalian cells.


Conflict of interest statement

Competing financial interests: G.J.P. is a scientific advisory board member for Cambridge Isotope Laboratories. R.W.G. has financial relationships with LipoSpectrum and Platomics.

Figures

Figure 1
Figure 1
125-MHz cross-polarization magic-angle spinning 13C NMR spectra of intact HeLa cells (left column) and H460 lung-cancer cells (right column). The full spectra obtained from cells labeled for 48 hours with 3 mM 99%-13C3-lactate (red, panels a and b) are compared to the corresponding spectra of unlabeled cells (black, panels a and b). The label-only difference spectra are in blue. The label-only difference spectrum shown in panel c resulted from subtracting the black and red spectra shown in panel A. Similarly, the label-only difference spectrum shown in panel d resulted from subtracting the black and red spectra shown in panel b. Label-only difference spectra were also obtained from cells labeled with 24 mM 50%-13C6-glucose (panels e and f, the latter scaled down by a factor of 2.5). The glucose labeling resulted in secreted lactate with four times the 13C concentration of the exogenous lactate labeling of panels c and d (see Supplementary Fig. 1).
Figure 2
Figure 2
HeLa and H460 cells cultured in 13C3-lactate have labeled TCA cycle intermediates. The patterns shown represent the isotopologue distribution of citrate, α-ketoglutarate, and malate as measured by LC/MS. Data are from (a) HeLa cells or (b) H460 lung cancer cells cultured for 3 hours in standard media (containing natural-abundance glucose) that was supplemented with either 3 mM 13C3-lactate (red) or natural-abundance lactate (black). Data shown are mean values ± s.d. (n = 3).
Figure 3
Figure 3
Deuterium labels from 2H-lactate enter the mitochondria. (a) Schematic showing location of 2H label as a function of LDH activity. (b) Schematic showing two pathways (blue and green) that result in mitochondrial lactate. Only the pathway shown in green results in deuterated mitochondrial lactate. (c–f) Mass spectra from isolated mitochondria showing that 13C1-lactate (from natural abundance) and 2-2H-lactate (from exogenous label) can be resolved. The 2-2H-lactate peak is only detected at levels above natural abundance in mitochondria from cells cultured in 2-2H-lactate. Data are from mitochondria isolated from HeLa cells cultured for 45 minutes in high-glucose media supplemented with (c) 3 mM natural-abundance lactate or (d) 2-2H-lactate. The bottom spectra show increased 2-2H-lactate labeling from HeLa mitochondria. These data result from (e) culturing HeLa cells for 45 minutes in high-glucose media and 100 mM oxamate during mitochondrial isolation or (f) culturing HeLa cells for 45 minutes in glucose-free media and 100 mM oxamate during mitochondrial isolation.
Figure 4
Figure 4
LDHB is present in HeLa mitochondria. (a–b) Electron micrographs of cryosectioned HeLa cells immunolabeled with primary anti-LDHB and secondary antibody conjugated to 18 nm gold nanoparticles. Scale bar, 100 nm. (c) Semi-quantitative analysis of LDHB localization in the mitochondria (mito), nucleus, cytosol, and whole cell. The data were obtained from images of 10 random cells taken at 20,000X. The area of the mitochondria, nucleus, and cytosol were calculated by using ImageJ. Error bars represent s.d. from n = 10 images. (d) Semi-quantiative analysis of LDHA localization in the mitochondria (mito), nucleus, cytosol, and whole cell from HeLa cells immunolabeled with primary anti-LDHA and secondary antibody conjugated to 18 nm gold nanoparticles. The data were obtained from images of 10 random cells taken at 20,000X. The area of the mitochondria, nucleus, and cytosol were calculated by using ImageJ. Error bars represent s.d. from n = 10 images. (e) LDHB activity was detected in both whole-cell and isolated mitochondrial lysates from HeLa and H460 cells. LDHB activities were measured by an immunocapture enzymne activity assay. Data shown are the averages ± s.d. from n = 3 replicates (**p < 0.01, Student’s t-test).
Figure 5
Figure 5
HeLa mitochondria use lactate as a carbon source to respire. (a) OCR of isolated HeLa mitochondria incubated with the following substrates: 10 mM lactate, 5 mM malate, and 5 mM ADP (lac/mal, n = 3); or 10 mM pyruvate, 5 mM malate, and 5 mM ADP (pyr/mal, n = 3). (b) Lactate-production assay from intact HeLa cells treated with 50 mM of oxamate shows a ~70% decrease in lactate production relative to control cultures after 6 hours. (c) OCR of isolated HeLa mitochondria incubated with 10 mM lactate, 1 mM malate, and 5 mM ADP (control, n = 3); or 10 mM lactate, 1 mM malate, 5 mM ADP, and 50 mM oxamate (oxa, n = 3). (d) OCR of isolated HeLa mitochondria incubated with the following substrates: 10 mM pyruvate, 1 mM malate, and 5 mM ADP (control, n = 3); or 10 mM pyruvate, 1 mM malate, 5 mM ADP, and 50 mM oxamate (oxa, n = 3). Data shown are averages ± s.d. from n = 3 replicates. (**p < 0.01, Student’s t-test).

References

    1. Lehninger A, Nelson D, Cox ME. Lehninger Principles of Biochemistry. W. H. Freeman and Company; 2008.
    1. CORI CF, CORI GT. Carbohydrate metabolism. Annu Rev Biochem. 1946;15:193–218. - PubMed
    1. Nielsen HB, Clemmesen JO, Skak C, Ott P, Secher NH. Attenuated hepatosplanchnic uptake of lactate during intense exercise in humans. J Appl Physiol. 2002;92:1677–83. - PubMed
    1. Bonvento G, Herard AS, Voutsinos-Porche B. The astrocyte--neuron lactate shuttle: a debated but still valuable hypothesis for brain imaging. J Cereb Blood Flow Metab. 2005;25:1394–9. - PubMed
    1. Pavlides S, et al. The reverse Warburg effect: aerobic glycolysis in cancer associated fibroblasts and the tumor stroma. Cell Cycle. 2009;8:3984–4001. - PubMed

LinkOut - more resources