. 2016 Dec;19(12):1583-1591.
doi: 10.1038/nn.4388. Epub 2016 Sep 12.

L1-associated genomic regions are deleted in somatic cells of the healthy human brain

Affiliations

L1-associated genomic regions are deleted in somatic cells of the healthy human brain

Jennifer A Erwin et al. Nat Neurosci. 2016 Dec.

Erratum in

Abstract

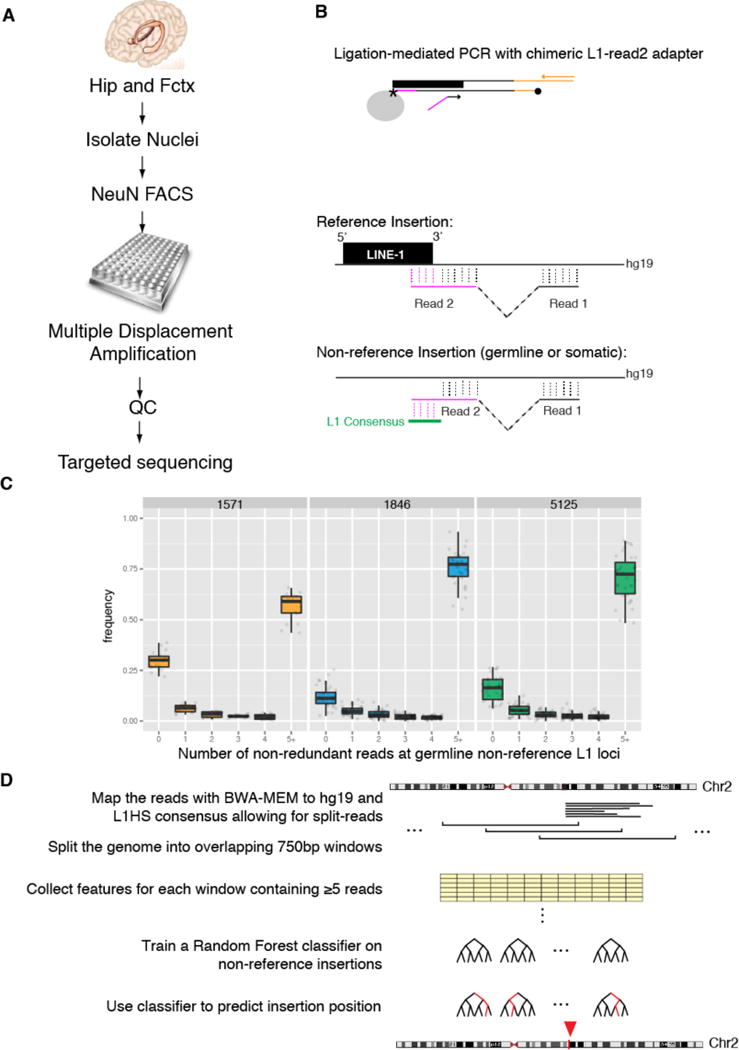
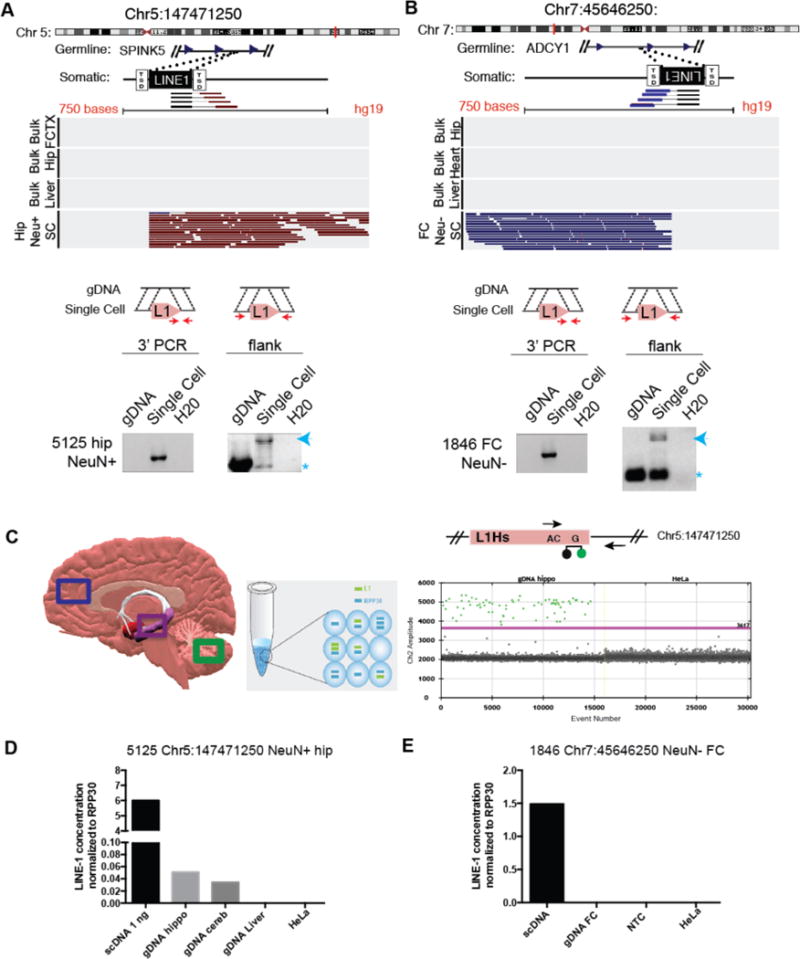
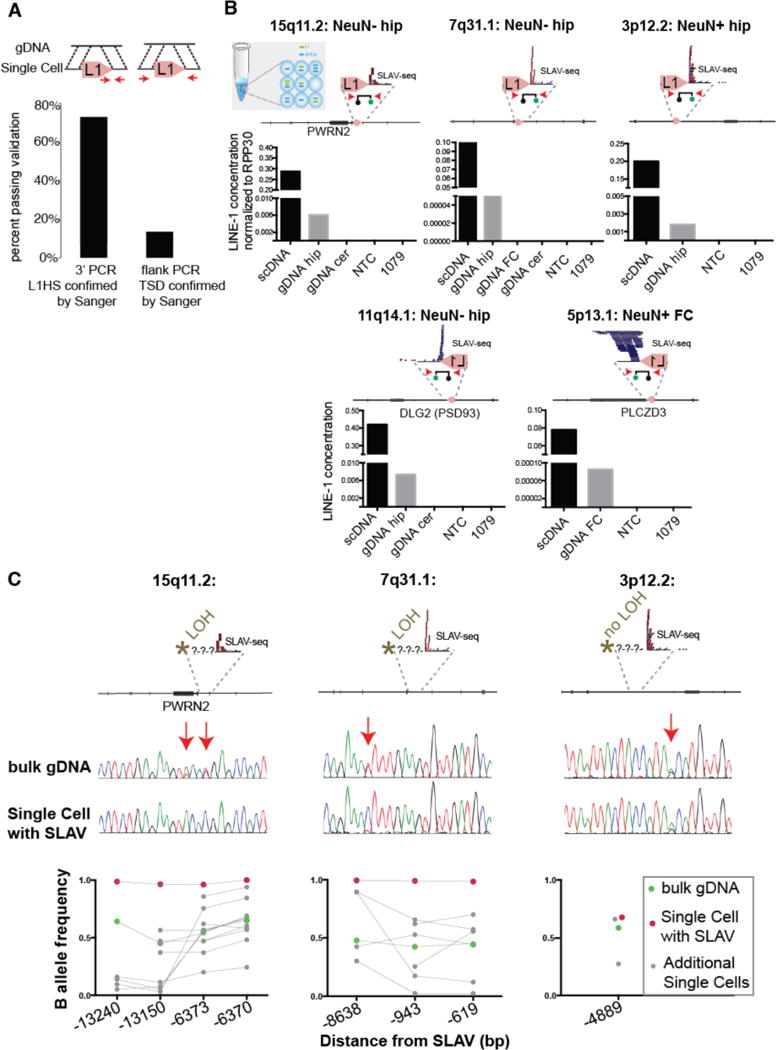
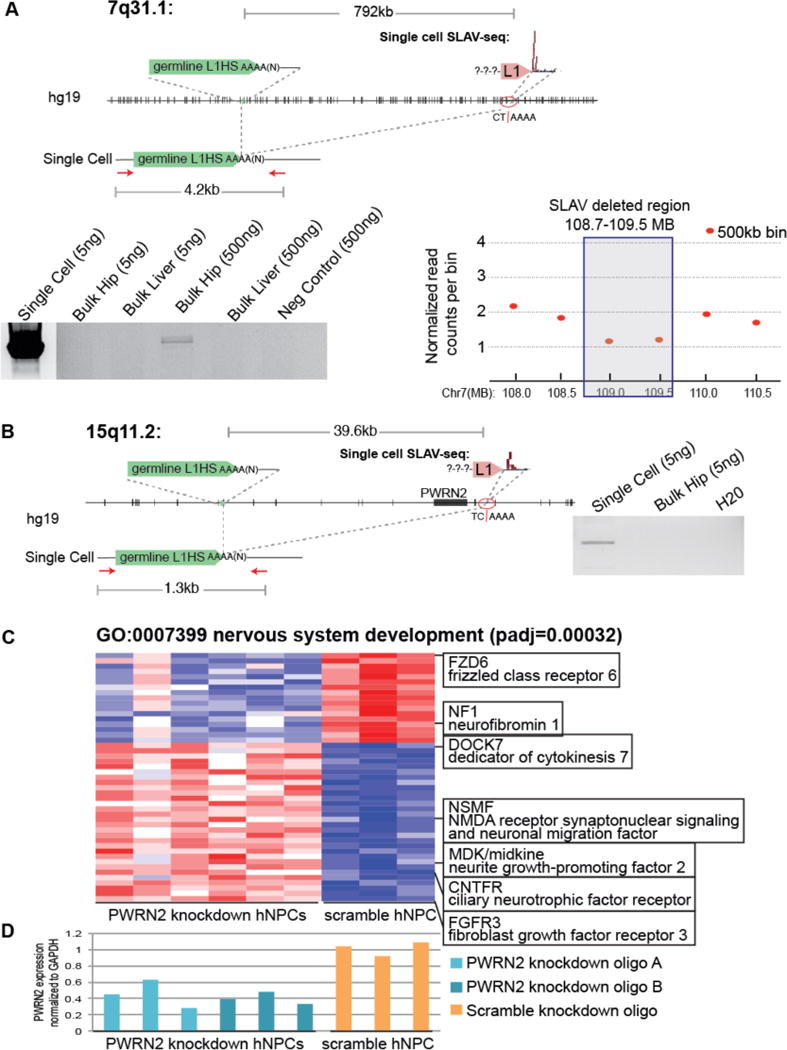
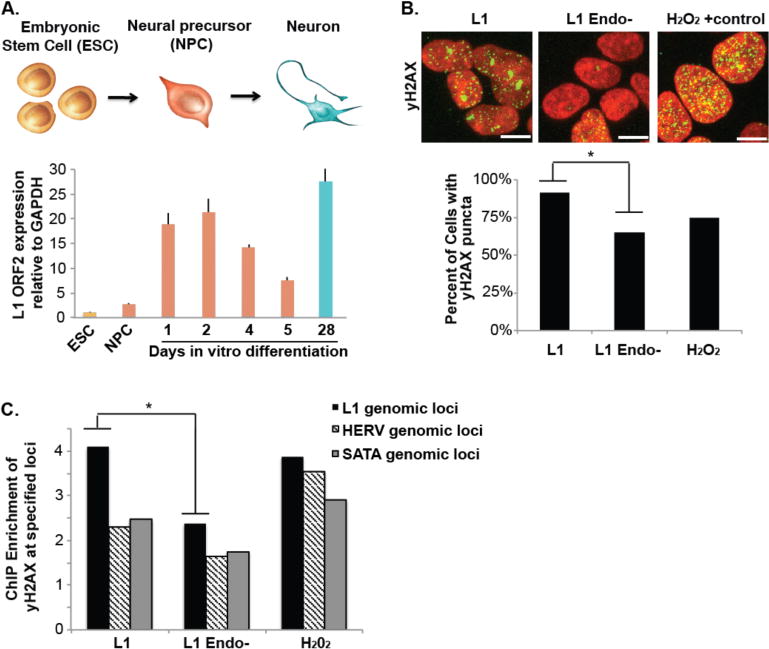
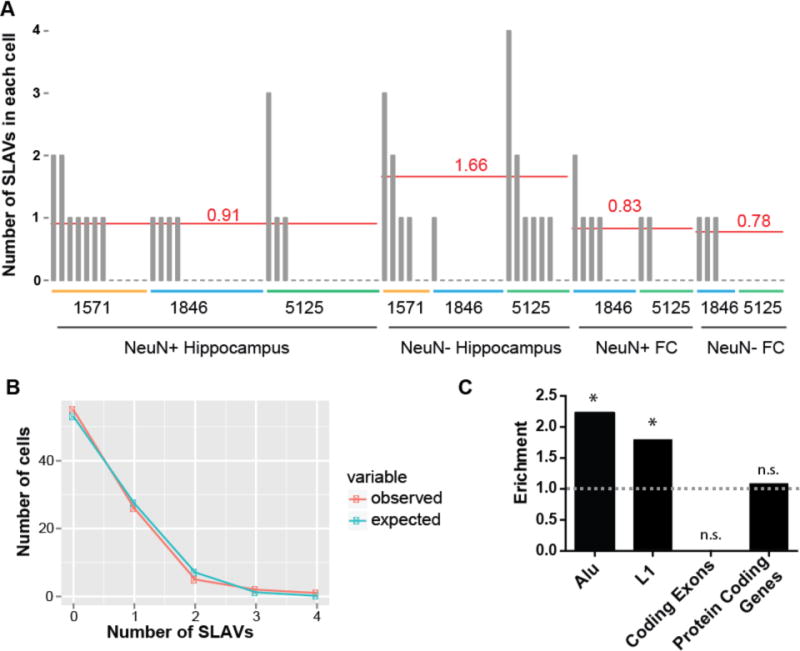
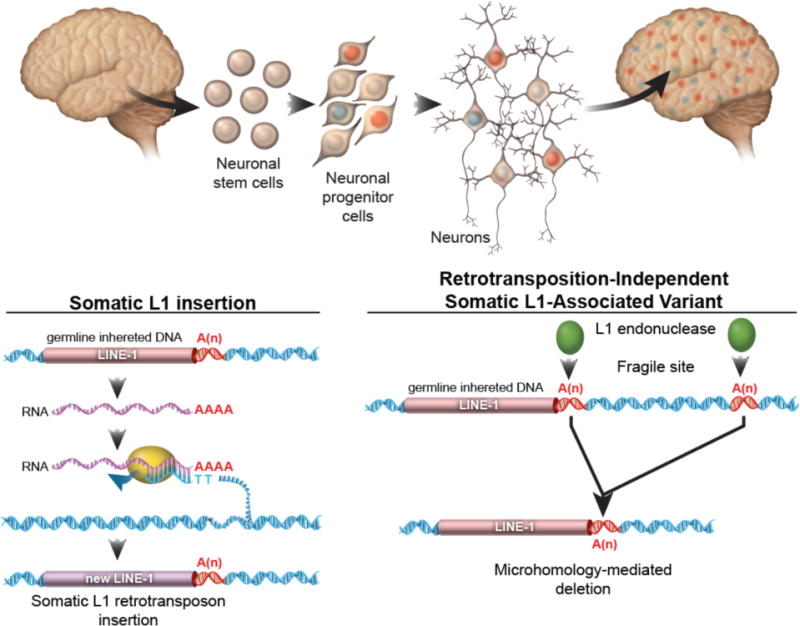
The healthy human brain is a mosaic of varied genomes. Long interspersed element-1 (LINE-1 or L1) retrotransposition is known to create mosaicism by inserting L1 sequences into new locations of somatic cell genomes. Using a machine learning-based, single-cell sequencing approach, we discovered that somatic L1-associated variants (SLAVs) are composed of two classes: L1 retrotransposition insertions and retrotransposition-independent L1-associated variants. We demonstrate that a subset of SLAVs comprises somatic deletions generated by L1 endonuclease cutting activity. Retrotransposition-independent rearrangements in inherited L1s resulted in the deletion of proximal genomic regions. These rearrangements were resolved by microhomology-mediated repair, which suggests that L1-associated genomic regions are hotspots for somatic copy number variants in the brain and therefore a heritable genetic contributor to somatic mosaicism. We demonstrate that SLAVs are present in crucial neural genes, such as DLG2 (also called PSD93), and affect 44-63% of cells of the cells in the healthy brain.


Figures

Figure 1
Figure 1. SLAV-seq identifies reference and non-reference L1-associated insertions
(A) Schematic of SLAV-seq. Individual nuclei from the hippocampus (Hip) and frontal cortex (Fctx) of postmortem samples from 3 individuals were isolated, immunofluorescently labeled for NeuN, and sorted into a 384-well plate. Whole-genome amplification is performed using multiple displacement amplification. After quality control (QC), amplified DNA is subjected to targeted sequencing. (B) The targeted sequencing approach involves a single extension with a biotinylated (*) L1HS-specific oligo on sheared DNA. This step was followed by capture and on-bead ligation of an amino-modified asymmetric adapter (magenta) and hemi-specific nested PCR. Read 2 is an L1-flanking genome split read. For reference insertions, read 1 and read 2 [including the L1 (magenta)] are fully aligned to hg19. For non-reference insertions, the first portion of read 2 aligns with the 3′ end of L1 consensus sequence but not to the hg19 reference sequence. (C) SLAV-seq yields high detection rates for known non-reference germline L1 insertions. Boxplots are shown for each single-cell library from the specified individuals (1571, 1846, and 5125), indicating the fraction of known non-reference germline loci (KNRGL) detected (y axis) as a function of the number of non-redundant L1 junction reads (x axis). (D) Schematic of the analysis to identify somatic insertions using a Random Forest machine learning classifier. Red arrowhead indicates a genomic window classified as containing a non-reference variant.
Figure 2
Figure 2. A subset of somatic L1 insertions contains target site duplication and occurred in a progenitor cell
(A,B) Visualization of sequencing reads and PCR validation that indicate a somatic L1 insertion in a hippocampal neuron (A) and in a frontal cortex glial cell (B) but absent from bulk tissue isolated from the same individual. Note: Red indicates reads mapping on the − strand and blue indicates reads mapping on the + strand. 3′ and flanking PCR and Sanger sequencing (PCR primers red arrow) were used to validate the L1HS sequence with target site duplication (TSD). Gels indicate the insertion product (blue arrow) and the empty allele (*). (C–E) Digital PCR assay was used to detect the specific L1 3′ junction sequence in single cell (scDNA) and bulk gDNA isolated from the same individual (C). A forward primer and a VIC-labeled taqman probe specific for the 3′ end of young L1 insertions were paired with a locus-specific reverse primer adapted from White et. al. _Colored boxes indicate brain regions extracted for genomic DNA. Example VIC fluorescence signal (Ch 2, y axis) for each positive droplet (green) above the threshold (purple line). Quantification for Chr5:147471250 (D) and Chr7:45646250 (E) variants normalized to the single-copy control RPP30. NTC, non-template control.
Figure 3
Figure 3. Identification of retrotransposition-independent SLAVs
(A) Percentage of predicted variants validated by 3′ PCR-Sanger sequencing or flanking/TSD PCR-Sanger (arrows indicate PCR primers). (B) Digital PCR assay confirms the presence of the L1 variant in single cell (scDNA) and bulk genomic DNA (gDNA) (as described in Fig. 2C). The specified variants have a confirmed 3′-L1Hs junction but lack TSD. (C) Loss of heterozygosity is detected upstream of the variant in 2 of 3 specified variants. The arrows indicate single nucleotide polymorphisms detected in bulk gDNA. Bottom: Quantification of additional SNVs from single cell and bulk genomic DNA. Connecting line indicates the same DNA sample tested across several positions.
Figure 4
Figure 4. Retrotransposition-independent somatic deletions are associated with L1 sequences
(A) Identification of a SLAV with a 792-kb deletion. Schematic of the reference genome (hg19) and the somatic variant. Red arrows indicate PCR primers. Gel indicates the presence of a 4.2-kb amplification product in the single cell and bulk hippocampal DNA that is absent from the corresponding bulk liver and 1079 gDNA. Note: The amplified product in single cell lane is a much higher concentration and is presented at a reduced contrast compared to the rest of the gel. Right:Whole genome sequencing copy number profile confirms a reduced copy number of the SLAV-deleted region. Plot showing the copy number profile for the single cell containing the 7q31.1 SLAV analyzed by whole genome sequencing. The normalized read count values for each individual genomic bin are shown for 500-kb bins (red). Note: Single cell amplification generates variable copy numbers and larger bin sizes are considered more reliable (B) Identification of a 39.6-kb SLAV deletion resulted in the deletion of PWRN2. Schematic of the reference genome (hg19) and the somatic variant. Red arrows indicate PCR primers. Gel indicates the presence of a 1.3-kb amplification product in the single cell that is absent from the corresponding bulk hippocampal gDNA. (C) PWRN2 knockdown in human embryonic stem cell derived hippocampal progenitor cells results in aberrant expression of nervous system development genes. Heatmap of the significantly differentially expressed genes between PWRN2 and scramble control NPCs (padj<0.001, 3 biological replicates for each shRNA) that were enriched in the nervous system development category (n=69 genes, padj=0.00032). Red: high expression, Blue: low expression, Z score by gene expression level. Columns indicate each biological replicate, rows indicate genes. (D) PWRN2 knockdown results in decreased PWRN2 transcript levels. PWRN2 expression was determined by reverse transcription PCR quantification normalized to GAPDH.
Figure 5
Figure 5. L1 endonuclease creates dsDNA damage preferentially at germline L1 genomic loci
(A) L1 expression is upregulated during human hippocampal neuronal differentiation. Human embryonic stem cells (ESC) were differentiated to hippocampal neurons via a neural precursor cell (NPC). L1 expression was determined by reverse transcription PCR quantification normalized to GAPDH. (B) L1 overexpression creates dsDNA damage that is dependent on a functional L1 endonuclease domain. HEK293T cells were transfected with L1, L1 endonuclease and reverse transcriptase-deficient plasmids (L1 Endo-) or treated with 1.85mM of H2O2 for 10min and stained for γ-H2AX (green) DAPI (red). Scale bar= 5μm, * indicates p<0.05, t-test. (C) L1 overexpression induces γ-H2AX preferentially at germline L1 genomic loci. HEK293T cells were transfected with L1, L1 endonuclease and reverse transcriptase-deficient plasmids (L1 Endo-) or treated with 1.85mM of H2O2 for 10min. Chromatin Immunoprecipitation (ChIP) for γ-H2AX or IgG control was performed and Quantitative PCR of γ-H2AX associated DNA normalized to IgG control for the specified repetitive genomic loci. * indicates p<0.05, t-test.
Figure 6
Figure 6. Rate and distribution of SLAV events in healthy brain cells
(A) The number of somatic L1 candidates in each cell that was sequenced (one bar represents one cell). The average number of insertions per cell type, normalized for detection rate of known non-reference insertions, is represented by the red line. FC, frontal cortex. (B) The distribution of SLAVs per cell follows closely a Poisson distribution (χ2 test p-value=0.26). (C) SLAVs are enriched in germline Alu and L1 regions and are not depleted from protein coding genes (exons plus introns). No SLAVs were detected in coding exons. (* indicates p<0.05, exact binomial test)
Figure 7
Figure 7. SLAVs are composed of two classes of variants
For somatic L1 insertions, a germline-inherited LINE-1 sequence is transcribed into RNA. The L1 endonuclease and reverse transcriptase protein nicks the genomic DNA and reverse transcribes the L1 RNA, resulting in the insertion of a new copy of Line-1 sequence. For retrotransposition-independent SLAVs, L1 endonuclease preferentially cuts a a germline-inherited LINE-1 sequence and recombination with a downstream A microsatellite results in a microhomology-mediated deletion. The A microsatellite regions may be nicked by the L1 endonuclease or a fragile site within the genome of neural progenitor cells.

References

    1. Campbell IM, Shaw CA, Stankiewicz P, Lupski JR. Somatic mosaicism: implications for disease and transmission genetics. Trends in genetics: TIG. 2015;31:382–392. doi: 10.1016/j.tig.2015.03.013. - DOI - PMC - PubMed
    1. Shirley MD, et al. Sturge-Weber syndrome and port-wine stains caused by somatic mutation in GNAQ. The New England journal of medicine. 2013;368:1971–1979. doi: 10.1056/NEJMoa1213507. - DOI - PMC - PubMed
    1. Poduri A, et al. Somatic activation of AKT3 causes hemispheric developmental brain malformations. Neuron. 2012;74:41–48. doi: 10.1016/j.neuron.2012.03.010. - DOI - PMC - PubMed
    1. Muotri AR, et al. Somatic mosaicism in neuronal precursor cells mediated by L1 retrotransposition. Nature. 2005;435:903–910. - PubMed
    1. Erwin JA, Marchetto MC, Gage FH. Mobile DNA elements in the generation of diversity and complexity in the brain. Nature reviews Neuroscience. 2014;15:497–506. doi: 10.1038/nrn3730. - DOI - PMC - PubMed

Publication types