. 2016 Oct;48(10):1112-8.
doi: 10.1038/ng.3664. Epub 2016 Sep 12.

The rules and impact of nonsense-mediated mRNA decay in human cancers

Affiliations

The rules and impact of nonsense-mediated mRNA decay in human cancers

Rik G H Lindeboom et al. Nat Genet. 2016 Oct.

Abstract

Premature termination codons (PTCs) cause a large proportion of inherited human genetic diseases. PTC-containing transcripts can be degraded by an mRNA surveillance pathway termed nonsense-mediated mRNA decay (NMD). However, the efficiency of NMD varies; it is inefficient when a PTC is located downstream of the last exon junction complex (EJC). We used matched exome and transcriptome data from 9,769 human tumors to systematically elucidate the rules of NMD targeting in human cells. An integrated model incorporating multiple rules beyond the canonical EJC model explains approximately three-fourths of the non-random variance in NMD efficiency across thousands of PTCs. We also show that dosage compensation may sometimes mask the effects of NMD. Applying the NMD model identifies signatures of both positive and negative selection on NMD-triggering mutations in human tumors and provides a classification for tumor-suppressor genes.


Conflict of interest statement

The authors declare no competing financial interests.

Figures

Figure 1
Figure 1. Study overview.
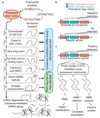
The rules of NMD were inferred from nonsense somatic mutations (n=2,840) in TCGA tumor genome sequences, and then validated using somatic frameshift changes (n=3,151) in TCGA and germline nonsense variants (n=1,784) in Geuvadis. NMD efficiency was quantified via mRNA expression levels for the TCGA (after control for somatic copy-number changes), and via allele-specific expression for the Geuvadis cohort.
Figure 2
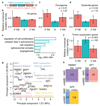
Figure 2. A downstream EJC and the proximity to the start codon are widespread signals for NMD.
NMD efficiency (–log2 nonsense mRNA level / wild-type mRNA level) in different gene regions. (a) NMD efficiency for PTCs in the first 200 coding nt with and without a downstream AUG codon. (b) NMD evasion in the last exon (red) and 50 nt upstream of the last exon (green), in comparison to efficient NMD in the second-last (blue) and further upstream (purple) exons. (c) PTCs in the second-last exon do not induce NMD when an intron is present in the 3′ UTR, shown for the nonsense mutations (left) and PTCs resulting from frameshift mutations (right). (a-c) P-values are by Mann-Whitney U-test, two-tailed, not adjusted for multiple testing. (d) Above: a schematic representation with color-coded gene regions that show different NMD efficiencies; black boxes represent exons. Below: a loess fit and its 95% C.I. shows NMD efficiency trends (individual points not shown). Bottom-left: increase in NMD efficiency across the first 200 coding nt. Bottom-right: variation in NMD efficiency around the last exon junction, where the assumed location of the EJC is demarcated in the top of the plot. (e) Color-coding of gene regions.
Figure 3
Figure 3. Exon length, distance to stop codon, mRNA decay rates and RBPs influence NMD efficiency.
(a) Reduced NMD efficiency in long exons. (b) Effects of distance between the PTC and the downstream exon junction. The line is a local polynomial regression fit. (c) Reduced NMD efficiency at PTCs very distant from the normal stop codon (after controlling for the EJC model and start-proximal NMD insensitivity; Methods). X-axis shows the median distance between the PTC and the normal stop codon of boxplots. (d) Reduced NMD efficiency in transcripts with short half-lives. X-axis shows the median mRNA half-life in minutes in each boxplot. Bins in (c) and (d) are equal-width on the square root-transformed scale. (e) RNA binding protein motifs associated to NMD efficiency when located within +/– 100 nt from the PTC (SRSF1, PABPN1 and SNRPB2) or in the normal 3′UTR (ACO1). NMD efficiency distribution in left or the right box corresponds to absent or present motif, respectively. The position weight matrices used to detect motifs are shown below. In all boxplots, the central line and the notch are median and its approximate 95% C.I., the box shows the interquartile range, and the whiskers are extreme values upon removing outliers. (a,e) P-values are from Mann-Whitney U-test, two-tailed.
Figure 4
Figure 4. The identified NMD rules explain a large part of the NMD efficiency but NMD can have little effect when there is dosage compensation.
(a) The identified rules for NMD explain different amounts of variance in NMD efficiency between PTCs, up to a total of R2=74.2%. The predictive power of every feature was determined by sequentially introducing the features to RF models, based on the order of the features suggested by an initial analysis of the entire feature set (Supplementary Table 3); in the bar chart, the bottommost features were added first, and the topmost features added last. The gain in R2 upon adding each feature is shown after normalizing by the maximum attainable R2 given the noise in the data (estimated from repeated occurrences of the same PTC in different tumors; Methods). (b) A significant decrease in explained NMD efficiency is observed in dosage-compensated genes. Explained NMD efficiency in the top 20% least and most-dosage compensated genes (definition in Methods) are shown in the top and bottom bars, respectively. Colors in the bars match the features in (a). Significance by a t-test on the Fisher-transformed Pearson correlations of the RF model.
Figure 5
Figure 5. Signatures of negative/positive selection on somatic nonsense mutations.
(a) Genes were divided into NMD-insensitive regions: (i) last exon plus 50 nt upstream (3′NS), and (ii) first 250 nt after start codon (5′NS), and (iii) the NMD-sensitive remainder (S). (b-d) Density of nonsense mutations normalized by synonymous mutations within each gene region, for all genes (b), oncogenes (c) from the Cancer Gene Census and essential genes (d) from. (e) Gene Ontology enrichment analysis of genes under negative selection, based on NMD-sensitive vs. insensitive proportions (Methods). Gene sets ≥30 genes and odds ratio > 2 are shown. (f) As (b-d), but for the 200 highest scoring ‘STOP’ tumor suppressor (TS) genes from. Panels (b-d, f), error bars are 95% C.I. obtained by bootstrapping; n = number of examined PTCs; p-values are from randomization tests, comparing against the baseline in (b). (g) A principal components analysis of occurrence of nonsense mutations in NMD-sensitive or NMD-insensitive gene regions and copy-number alteration data in the same patients (Methods). Clusters with different putative mechanisms of inactivation shown with distinct shapes and colors. Arrows show correlations of principal components and original features; colors as in (h). TS genes with ≥50 nonsense mutations in the TCGA cohort are shown. (h) Example TS genes from each cluster: PBRM1- two-hit genes; NF1- haploinsufficient TS genes; APC- genes that rarely undergo NMD. Columns show relative frequencies of tumors harboring a deletion (“Del”) or not (“noDel”) of a gene; rows are tumors with nonsense mutations in NMD-sensitive (“NMD”) or NMD-insensitive regions (“noNMD”).
Figure 6
Figure 6. Model summarizing the rules governing NMD in human cells.
(a) Overview of the determinants of NMD efficiency. (b) Negative selection against NMD-triggering somatic mutations. (c) Relevance of NMD for tumor suppressor inactivation.

References

    1. Maquat LE. When cells stop making sense: effects of nonsense codons on RNA metabolism in vertebrate cells. RNA. 1995;1:453–65. - PMC - PubMed
    1. Mendell JT, Sharifi NA, Meyers JL, Martinez-Murillo F, Dietz HC. Nonsense surveillance regulates expression of diverse classes of mammalian transcripts and mutes genomic noise. Nat Genet. 2004;36:1073–8. - PubMed
    1. Frischmeyer PA, Dietz HC. Nonsense-mediated mRNA decay in health and disease. Hum Mol Genet. 1999;8:1893–900. - PubMed
    1. Hall GW, Thein S. Nonsense codon mutations in the terminal exon of the beta-globin gene are not associated with a reduction in beta-mRNA accumulation: a mechanism for the phenotype of dominant beta-thalassemia. Blood. 1994;83:2031–7. - PubMed
    1. Kerr TP, Sewry CA, Robb SA, Roberts RG. Long mutant dystrophins and variable phenotypes: evasion of nonsense-mediated decay? Hum Genet. 2001;109:402–7. - PubMed

Publication types