. 2016 Oct;22(10):1187-1191.
doi: 10.1038/nm.4176. Epub 2016 Sep 12.

Neonatal gut microbiota associates with childhood multisensitized atopy and T cell differentiation

Affiliations

Neonatal gut microbiota associates with childhood multisensitized atopy and T cell differentiation

Kei E Fujimura et al. Nat Med. 2016 Oct.

Abstract

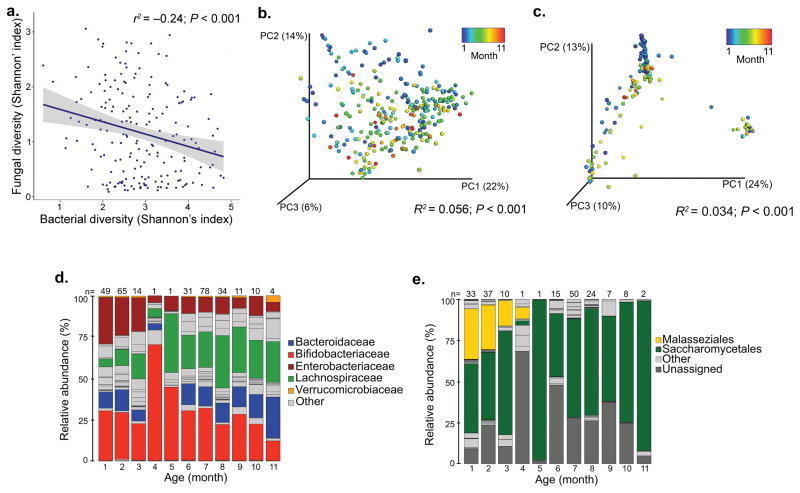
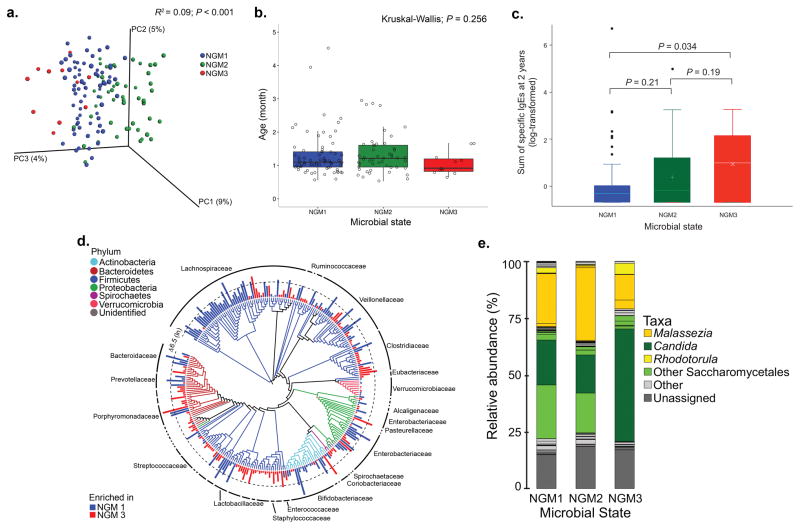
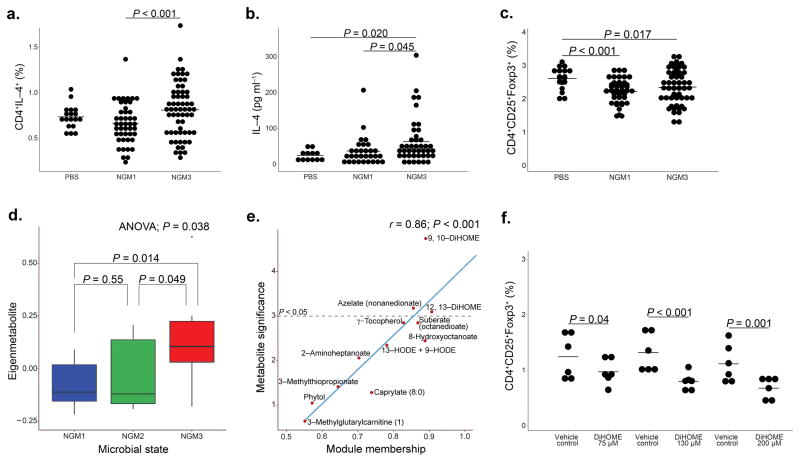
Gut microbiota bacterial depletions and altered metabolic activity at 3 months are implicated in childhood atopy and asthma. We hypothesized that compositionally distinct human neonatal gut microbiota (NGM) exist, and are differentially related to relative risk (RR) of childhood atopy and asthma. Using stool samples (n = 298; aged 1-11 months) from a US birth cohort and 16S rRNA sequencing, neonates (median age, 35 d) were divisible into three microbiota composition states (NGM1-3). Each incurred a substantially different RR for multisensitized atopy at age 2 years and doctor-diagnosed asthma at age 4 years. The highest risk group, labeled NGM3, showed lower relative abundance of certain bacteria (for example, Bifidobacterium, Akkermansia and Faecalibacterium), higher relative abundance of particular fungi (Candida and Rhodotorula) and a distinct fecal metabolome enriched for pro-inflammatory metabolites. Ex vivo culture of human adult peripheral T cells with sterile fecal water from NGM3 subjects increased the proportion of CD4+ cells producing interleukin (IL)-4 and reduced the relative abundance of CD4+CD25+FOXP3+ cells. 12,13-DiHOME, enriched in NGM3 versus lower-risk NGM states, recapitulated the effect of NGM3 fecal water on relative CD4+CD25+FOXP3+ cell abundance. These findings suggest that neonatal gut microbiome dysbiosis might promote CD4+ T cell dysfunction associated with childhood atopy.


Conflict of interest statement

Statement We have no competing financial interests.

Figures

Fig. 1
Fig. 1. Bacterial and fungal α– and β–diversity are related to age of participant at the time of fecal sample collection
(a) Bacterial and fungal α–diversities are inversely correlated (Shannon’s index; n = 188; Pearson’ correlation r2 = −0.24; P < 0.001). (b) Age of participant is associated with bacterial β–diversity (n = 298; PERMANOVA R2 = 0.056; P < 0.001). (c) Age of participant is related to fungal β–diversity (n = 188; PERMANOVA R2 = 0.034; P < 0.001). (d) Age-stratified taxa summaries (presented at the family level) of bacterial relative abundance (n = 298; number of participants per age-group is provided above bars). (e) Age-stratified taxa summaries (presented at the order level) of fungal relative abundance (n = 188; number of participants per age-group is provided above bars).
Fig. 2
Fig. 2. Compositionally distinct, age-independent bacterial gut microbiota–states (NGMs) exist in neonates, exhibit significant differences in fungal taxonomy and are related to relative risk of atopy at age–2 years
(a) NGM designation significantly explains observed variation (n = 130; PERMANOVA with unweighted UniFrac R2 = 0.09; P < 0.001) in bacterial β–diversity. (b) NGM participants do not differ significantly in age (n = 130; Kruskal–Wallis; P = 0.256). Boxplots are defined by the 25th and 75th percentiles with the center line representing the median (50th percentile). Lines that extend from the box are defined as 1.5 times the interquartile range (IQR, 75th–25th percentile), plus or minus the 75th and 25th percentiles, respectively. (c) The sum of allergen–specific serum IgE concentrations measures at two–years of age (n = 130) is significantly higher in NGM3 versus NGM1 participants (Welch’s t–test; P = 0.034). Boxplots are constructed as defined in (b). (d) Taxonomic comparison of NGM3 with NGM1 subjects; taxa exhibiting significant difference (ZINB; Benjamini–Hochberg, q < 0.05) in mean relative abundance (natural log transformed for purposes of illustration) are shown. Bar height indicates the magnitude of between–group relative abundance delta. (e) Relative abundance of fungal genera differs across NGMs.
Fig. 3
Fig. 3. NGMs significantly differ in CD4+ cell differentiation
Dendritic cells and autologously purified naïve CD4+ cells from serum of two healthy adult donors (biological replicates), were incubated with sterile fecal water from NGM1 (n = 7; three biological replicates per sample) or NGM3 (n = 5; three biological replicates per sample) participants. NGM3 induced significantly increased (a) proportions of CD4+IL–4+ (LME, P < 0.001; center line represents mean) and (b) expression of IL–4 (LME; P = 0.045). (c) Both NGMs expressed significantly increased proportions of CD4+CD25+Foxp3+ cells (LME; P < 0.001 for NGM1 and P = 0.017 for NGM3) compared to control. (d) Weighted correlation network analysis identified a metabolic module that differentiated NGM3 from NGM 2 and NGM1 participants (n = 28; ANOVA; P = 0.038). Boxplots define the 25th and 75th percentiles, median represented by centerline. IQR (75th–25th percentile) represented by whiskers. (e) Scatterplot of metabolite significance versus module membership (MM) of the 12 metabolites in the NGM3 discriminating metabolic module. Metabolites with a value of P < 0.05, significantly discriminate NGM3 from other NGMs. MM value indicates the degree of inter-connectedness of a specific metabolite to other metabolites in the module (higher MM value indicates greater inter-connectedness). (f) Using the same ex vivo assay as performed in 3a–c, 12, 13 DiHOME significantly reduced the proportion of CD4+CD25+Foxp3+ cells at three different concentrations (LME; P = 0.04, P < 0.001, P = 0.001 for concentrations of 75, 130 and 200 μM respectively).

Comment in

References

    1. Arrieta M, et al. Early infancy microbial and metabolic alterations affect risk of childhood asthma. Sci Transl Med. 2015;7:1–14. - PubMed
    1. Asher MI, Montefort S, Bjorksten B, Lai CK, Strachan DP, WS Worldwide time trends in the prevalence of symptoms of asthma, allergic rhinoconjunctivitis, and eczema in childhood. Int Study Asthma Allerg Child. 2006;368:733–743. - PubMed
    1. Simpson A, et al. Beyond atopy: multiple patterns of sensitization in relation to asthma in a birth cohort study. Am J Respir Crit Care Med. 2010;181:1200–6. - PubMed
    1. Aichbhaumik N, et al. Prenatal exposure to household pets influences fetal immunoglobulin E production. Clin Exp Allergy. 2008;38:1787–1794. - PMC - PubMed
    1. Havstad S, et al. Atopic phenotypes identified with latent class analyses at age 2 years. J Allergy Clin Immunol. 2014;134:722–727. - PMC - PubMed

MeSH terms