. 2016 Sep 13;17(1):366.
doi: 10.1186/s12859-016-1229-9.

Tissue enrichment analysis for C. elegans genomics

Affiliations

Tissue enrichment analysis for C. elegans genomics

David Angeles-Albores et al. BMC Bioinformatics. .

Abstract

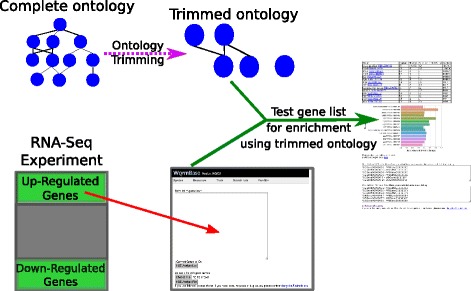
Background: Over the last ten years, there has been explosive development in methods for measuring gene expression. These methods can identify thousands of genes altered between conditions, but understanding these datasets and forming hypotheses based on them remains challenging. One way to analyze these datasets is to associate ontologies (hierarchical, descriptive vocabularies with controlled relations between terms) with genes and to look for enrichment of specific terms. Although Gene Ontology (GO) is available for Caenorhabditis elegans, it does not include anatomical information.

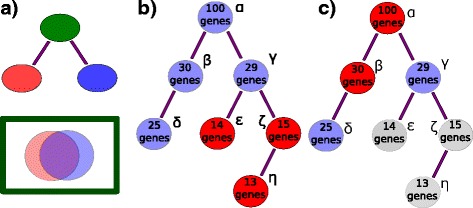
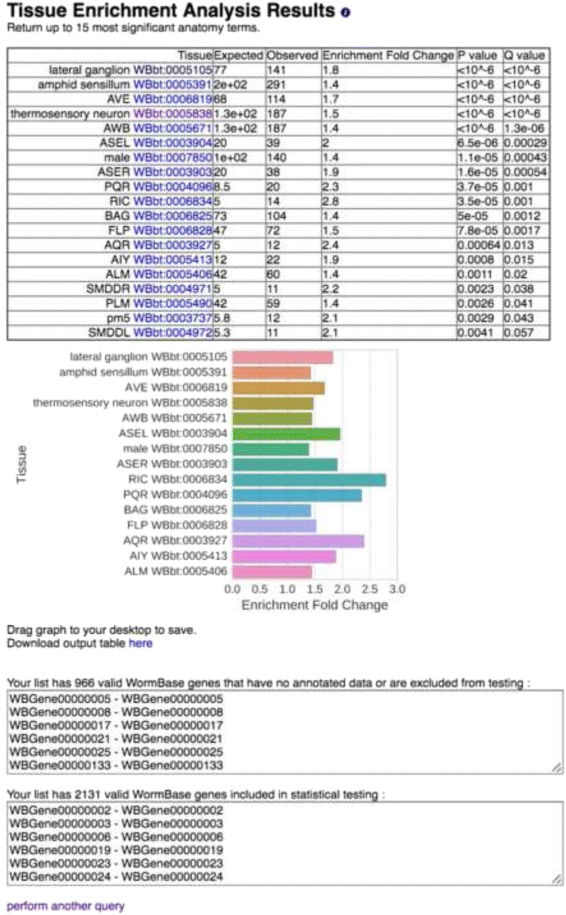
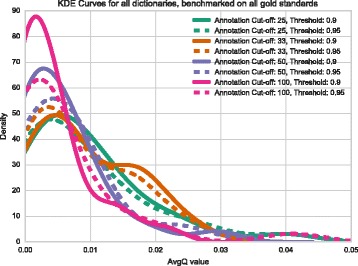
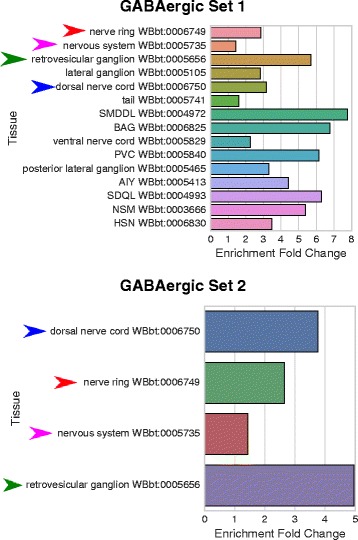
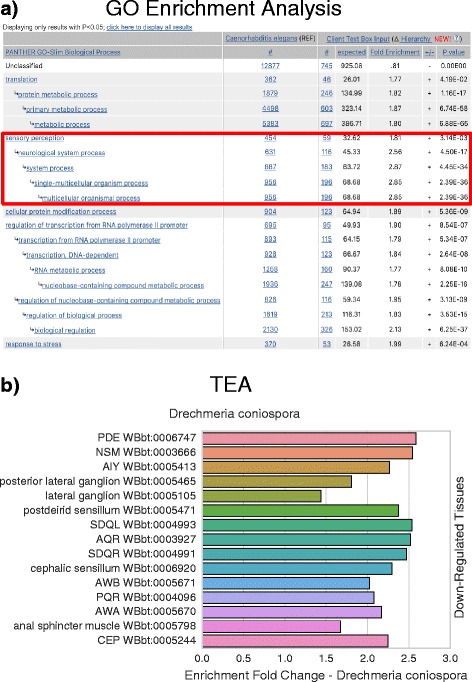
Results: We have developed a tool for identifying enrichment of C. elegans tissues among gene sets and generated a website GUI where users can access this tool. Since a common drawback to ontology enrichment analyses is its verbosity, we developed a very simple filtering algorithm to reduce the ontology size by an order of magnitude. We adjusted these filters and validated our tool using a set of 30 gold standards from Expression Cluster data in WormBase. We show our tool can even discriminate between embryonic and larval tissues and can even identify tissues down to the single-cell level. We used our tool to identify multiple neuronal tissues that are down-regulated due to pathogen infection in C. elegans.

Conclusions: Our Tissue Enrichment Analysis (TEA) can be found within WormBase, and can be downloaded using Python's standard pip installer. It tests a slimmed-down C. elegans tissue ontology for enrichment of specific terms and provides users with a text and graphic representation of the results.

Keywords: Anatomy ontology; Gene ontology; High-throughput biology; RNA-seq; WormBase.


Figures

Fig. 1
Fig. 1
Schematic representation of trimming filters for an acyclical ontology. a The parent node (green) contains at least as many annotations as the union of the two sisters. These two sisters share annotations extensively, as expressed by the overlap in the Venn diagram, so they qualify for removal. b Nodes with less than a threshold number of genes are trimmed (red) and discarded from the dictionary. Here, the example threshold is 25 genes. Nodes ε,ζ,η, shown in red are removed. c Parent nodes are removed recursively, starting from the root, if all their daughter nodes have more than the threshold number of annotations. Nodes in grey (ε,ζ,η) were removed in the previous step. Nodes α,β shown in red are trimmed because each one has a complete daughter set. Only nodes γ and δ will be used to generate the static dictionary
Fig. 2
Fig. 2
Screenshot of results from the web GUI. After inputting a gene-list, the user is provided with the results. An HTML table is output with hyperlinks to the ontology terms. A publication-ready graph is provided below, which can be saved by dragging to the desktop. The graph is colored for better visualization; color is not intended to convey information. The graph and the table show anatomy terms in human-readable format, followed by their unique WBbt ID. Finally, lists of the genes used and discarded for the analysis are also presented
Fig. 3
Fig. 3
TEA Workflow. The complete ontology is annotated continuously by WormBase curators. After each update, the ontology is processed to remove uninformative terms, and the remaining terms are used for statistical testing. Users can select a gene list and input it into our tool using our WormBase portal. The gene list is tested for enrichment using the trimmed ontology, and results are output in tabular and graphic formats for analysis
Fig. 4
Fig. 4
Kernel density estimates (KDE) for 30 gold standard datasets. We ran TEA on 30 datasets we believed to be enriched in particular tissues and pooled all the results to observe the distribution of q-values. The mode of the distribution for dictionaries with annotation cut-offs of 100 and 50 genes are very similar; however, when the cut-off is lowered to 25 genes, the mode of the distribution shifts to the left, potentially signalling a decrease in measurement power
Fig. 5
Fig. 5
Independently derived gene sets show similar results when tested with the same dictionary. Set 1) GABAergic gene set from Watson [20]. Set 2) GABAergic gene set from Spencer [18]. Arrowheads highlight identical terms between both analyses. All terms refer to neurons or neuronal tissues and are GABA-associated. Dictionary with cutoff: 33; threshold: 0.95; method: ‘any’
Fig. 6
Fig. 6
D. coniospora gene enrichment analysis and tissue enrichment analysis results. We compared and contrasted the results from a gene enrichment analysis program, pantherDB, with TEA by analyzing genes that were significantly down-regulated when C. elegans was exposed to D. coniospora in a previously published dataset by Engelmann et al. [25] with both tools. a pantherDB screenshot of results, sorted by p-value. Only top hits shown. b TEA results, sorted by q-value (lowest on top) and fold-change. Both pantherDB and TEA identify terms associated with neurons (red square). The two analyses provide complementary, not redundant, information

References

    1. The Gene Ontology Consortium Gene Ontology: tool for the unification of biology. Nat Genet. 2000;25(May):25–9. - PMC - PubMed
    1. The Gene Ontology Consortium Gene Ontology Consortium: going forward. Nucleic Acids Res. 2015;43(D1):D1049–56. doi: 10.1093/nar/gku1179. - DOI - PMC - PubMed
    1. Mi H, Dong Q, Muruganujan A, Gaudet P, Lewis S, Thomas PD. PANTHER version 7: Improved phylogenetic trees, orthologs and collaboration with the Gene Ontology Consortium. Nucleic Acids Res. 2009;38(SUPPL.1):D204–10. - PMC - PubMed
    1. McLean CY, Bristor D, Hiller M, Clarke SL, Schaar BT, Lowe CB, Wenger AM, Bejerano G. GREAT improves functional interpretation of cis-regulatory regions. Nat Biotechnol. 2010;28(5):495–501. doi: 10.1038/nbt.1630. - DOI - PMC - PubMed
    1. Huang DW, Lempicki Ra, Sherman BT. Systematic and integrative analysis of large gene lists using DAVID bioinformatics resources. Nat Protoc. 2009;4(1):44–57. doi: 10.1038/nprot.2008.211. - DOI - PubMed

LinkOut - more resources