. 2016 Nov 4;291(45):23719-23733.
doi: 10.1074/jbc.M116.729418. Epub 2016 Sep 12.

Identification and Characterization of MCM3 as a Kelch-like ECH-associated Protein 1 (KEAP1) Substrate

Affiliations

Identification and Characterization of MCM3 as a Kelch-like ECH-associated Protein 1 (KEAP1) Substrate

Kathleen M Mulvaney et al. J Biol Chem. .

Abstract

KEAP1 is a substrate adaptor protein for a CUL3-based E3 ubiquitin ligase. Ubiquitylation and degradation of the antioxidant transcription factor NRF2 is considered the primary function of KEAP1; however, few other KEAP1 substrates have been identified. Because KEAP1 is altered in a number of human pathologies and has been proposed as a potential therapeutic target therein, we sought to better understand KEAP1 through systematic identification of its substrates. Toward this goal, we combined parallel affinity capture proteomics and candidate-based approaches. Substrate-trapping proteomics yielded NRF2 and the related transcription factor NRF1 as KEAP1 substrates. Our targeted investigation of KEAP1-interacting proteins revealed MCM3, an essential subunit of the replicative DNA helicase, as a new substrate. We show that MCM3 is ubiquitylated by the KEAP1-CUL3-RBX1 complex in cells and in vitro Using ubiquitin remnant profiling, we identify the sites of KEAP1-dependent ubiquitylation in MCM3, and these sites are on predicted exposed surfaces of the MCM2-7 complex. Unexpectedly, we determined that KEAP1 does not regulate total MCM3 protein stability or subcellular localization. Our analysis of a KEAP1 targeting motif in MCM3 suggests that MCM3 is a point of direct contact between KEAP1 and the MCM hexamer. Moreover, KEAP1 associates with chromatin in a cell cycle-dependent fashion with kinetics similar to the MCM2-7 complex. KEAP1 is thus poised to affect MCM2-7 dynamics or function rather than MCM3 abundance. Together, these data establish new functions for KEAP1 within the nucleus and identify MCM3 as a novel substrate of the KEAP1-CUL3-RBX1 E3 ligase.

Keywords: DNA replication; E3 ubiquitin ligase; KEAP1; MCM3; NFE2L2; Nrf2; erythroid-derived 2-like factor; nuclear factor 2; oxidative stress; proteomics.


Figures

FIGURE 1.
FIGURE 1.
PAC proteomics and a candidate-based approach reveal putative KEAP1 substrates. A, experimental schematic for the KEAP1 PAC proteomics. Putative substrates increase in association with KEAP1 following proteasome inhibition (red circles). B, the mean SILAC ratios (heavy/light) of high-confidence KEAP1 interactors detected by streptavidin AP of SBPHA-KEAP1 followed by LC/MS-MS in the presence or absence of 2–4 h of proteasome inhibitor (MG132) are plotted (high-confidence interactors were determined by the Spotlite-scored KEAP1 interaction network (74)). Proteins plotted were detected in at least two experimental replicates. Pink box-and-whisker plots show proteins with increased association with KEAP1 under proteasome inhibition (increased >50%) (supplemental Table S1). C, Western blot analysis of streptavidin affinity-purified KEAP1 protein complexes across an MG132 time course (0–8 h). D, LI-COR-based quantification of data shown in C. The abundance of each KEAP1-interacting protein within the KEAP1 AP protein complex across three biological replicate experiments is shown. Error bars represent standard error of the mean. E, Western blotting analysis of HDF-Tert cell lysates treated with the indicated proteasome inhibitor or KEAP1-CUL3 antagonist for 6 h. Each experiment (B–E) was performed three to five times. UNT, untreated.
FIGURE 2.
FIGURE 2.
KEAP1 associates with MCM3 in the MCM2–7 complex in both the nucleus and cytoplasm. A, FLAG-KEAP1 and FLAG-MCM3 protein interaction networks were determined by FLAG IP/MS. Spotlite-scored high-confidence interactors are shown (supplemental Table S2). B, endogenous MCM3 IP was probed for KEAP1 and MCM proteins using an antibody to an epitope common to multiple MCM subunits. C, endogenous MCM2 IP was probed for KEAP1 and MCM proteins. D, HEK293T cells stably expressing BirA*-KEAP1 (a biotin ligase proximity detector) or cells stably expressing controls (BirA*-GFP or BirA*-HC Red (RED)) were subjected to streptavidin affinity purification and probed for the indicated proteins. Biotinylated proteins were detected using fluorescently labeled streptavidin (Strept). Endog, endogenous. E, HEK293T immunofluorescence of VENUS-KEAP1 and endogenous MCM3. Scale bar = 20 μm. F, Duo-Link in situ proximity ligation assay of KEAP1 and MCM3. Images represent maximum intensity projections of Z-stacks. Each yellow fluorescent dot represents a single interaction between KEAP1 and MCM3 (left panel). VENUS-KEAP1 is shown in green. DAPI stain for nuclei is shown in blue. The center and right panels are the negative controls. For clarity, the yellow PLA puncta are shown alone in the top panels. Images were acquired using a confocal microscope. Scale bar = 20 μm. G, Western blotting analysis of cytoplasmic (Cyto) and nuclear (Nuc) fractions of HEK293T and HeLa cells to determine the localization of KEAP1. β-Tubulin, Vinculin, and Lamin A/C served as controls for cell fractionation. Each experiment (A–G) is representative of two to three biological replicates.
FIGURE 3.
FIGURE 3.
MCM3 is a KEAP1-CUL3 substrate for ubiquitylation. A, HEK293T cells were co-transfected with plasmids encoding SBPHA-KEAP1, FLAG-MCM3, and VSV-tagged ubiquitin (UB). Ubiquitylated MCM3 was detected by immunoblot analysis of immunopurified FLAG-MCM3 protein complexes. The IP was performed under near-denaturing conditions. UNT, untreated. B, HEK293T cells were co-transfected with plasmids encoding SBPHA-KEAP1, FLAG-NRF2 (positive control), and VSV-tagged ubiquitin. Ubiquitylated NRF2 was assessed by near-denaturing FLAG-NRF2 IP as in A. C, HEK293T cells stably expressing FLAG-MCM3 were transfected with control, KEAP1, or CUL3 siRNAs for 72 h, and the amount of ubiquitylated FLAG-MCM3 was determined as in A. D, ubiquitylation of endogenous MCM3 was determined by an anti-MCM3 IP after control (Cntl), KEAP1, or CUL3 siRNA transfection. N.S. is a nonspecific band shown as loading control (the nonspecific band was detected with anti-KEAP1 and was not affected by KEAP1 siRNA). E, HEK293T cells were transfected with plasmids encoding FLAG-MCM3 or FLAG-EAAE MCM3, and ubiquitylation was assayed as in A. F, HEK293T cells were transfected with plasmids encoding FLAG-MCM3 or FLAG-EAAE MCM3 and assessed for binding to KEAP1 by FLAG IP and Western blotting. G, in vitro ubiquitylation assay using KEAP1, CUL3-RBX1, UB, Ube1 (E1), UbcH5B (E2), and FLAG-MCM3. No E1 and No CUL3/KEAP1 served as negative controls. UB-MCM3 was detected by anti-FLAG (MCM3). These data are representative of two to five biological replicates of each (A–G). No CUL3/KEAP1 served as negative controls, complete reaction is denoted complete Rxn. VCL, vinculin.
FIGURE 4.
FIGURE 4.
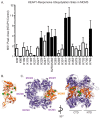
Mapping the KEAP1-dependent ubiquitylation sites in MCM3. A, HEK293T cells were transfected with plasmids encoding FLAG-MCM3 with or without the SBPHA-KEAP1 plasmid, and a near-denaturing FLAG IP was performed as in Fig. 3. A tryptic digest and ubiquitin remnant IP were then performed, followed by LC/MS-MS on the resultant peptides. Ubiquitylated peptides of MCM3 detected are plotted as mean ± S.E. MS1 peak areas of three biological replicate experiments. Black columns are lysine residues that increased beyond an arbitrary threshold of 3-fold increase in the presence of SBPHA-KEAP1 (supplemental Table S3). B, protein structural modeling of human MCM3 (Uniprot code P25205-1) threaded around an archaeal MCM structure (PDB code 3F9V). The KEAP1-modified lysines detected in A are shown as green spheres. C, protein structural modeling of human MCM3 from B superimposed over the published model of the yeast MCM2–7 complex (59). The KEAP1-modified lysines detected in A are shown as green spheres. A top-down view (left panel) and side view (right panel) are shown. CTD, C-terminal domain; NTD, N-terminal domain.
FIGURE 5.
FIGURE 5.
MCM3 levels and subcellular localization are not regulated by KEAP1. A, HEK293T cells were transfected with control or KEAP1 siRNA (20 nm, 72 h), lysed, and probed for KEAP1, NRF2, and MCM3 protein levels. CNTL, control. N.S. is a nonspecific band that served as a loading control (detected with anti-KEAP1 and was not changed by KEAP1 siRNA). B, WT, KEAP1−/−, or NRF−/− MEFs were lysed and probed for KEAP1, NRF2, MCM3, and HMOX1 protein levels by Western blotting. Beta tubulin (TUBB) serves as a loading control. C, HEK293T cells were treated with the KEAP1 antagonist/ROS mimetic compound tBHQ at 50 μm for 0–8 h. Whole cell lysates were subjected to Western blotting for MCM3, KEAP1, NRF2 (positive control), HMOX1, and TUBB as a loading control. D, HEK293T cells were treated with 40 nm bortezomib (proteasome inhibitor) for 0–8 h before Western blotting. E, HEK293T cells were treated with the lysosomal degradation inhibitor chloroquine at 100 μm for 0–8 h. Whole cell lysates were subjected to Western blotting for MCM3, KEAP1, NRF2, LC3 (positive control), and Actin as a loading control. F, HEK293T cells were transfected with control or KEAP1 siRNA for 48 h, followed by a 30 h cycloheximide (CHX) treatment (10 μg/ml), and lysates were probed for MCM3, TUBB, and KEAP1 protein levels. G, HEK293T cells were transfected with increasing amounts of SBPHA-GFP or SBPHA-KEAP1 plasmid, lysed by fractionation into nuclei and cytoplasm, and blots were probed for MCM3, KEAP1, and loading and fractionation controls. H, HEK293T cells were transfected with FLAG-KEAP1 plasmid and stained for endogenous MCM3 and anti-FLAG to determine MCM3 localization in the presence or absence of KEAP1. Images were acquired on a confocal microscope. Scale bar = 20 μm. Each experiment (A–H) is representative of two to three biological replicates.
FIGURE 6.
FIGURE 6.
MCM3 ubiquitylation by KEAP1 is not affected by DNA damage, ROS mimetics, or autophagy. A, HEK293T cells stably expressing SBPHA-KEAP1 were treated overnight with a panel of DNA-damaging agents (etoposide (Etop), 20 μm; gemcitabine (Gemcit), 1 μm; 4NQO, 100 nm) or KEAP1 antagonists (tBHQ, 50 μm; sulforaphane (Sulf), 20 μm). Western blotting analysis of KEAP1 affinity-purified protein complexes are shown. Phospho-Chk1 serves as a marker of DNA damage. Strept, streptavidin; Cntl, control. B, HEK293T cells were transfected with plasmids encoding FLAG-MCM3 and VSV-ubiquitin (UB) with or without KEAP1 and were treated with DNA-damaging agents as in A. C, MCM3 ubiquitylation assays were performed as in Fig. 3. Unt, untreated. D, FLAG-NRF2 and VSV-UB with or without KEAP1 were transfected into HEK293T cells and treated with or without ROS mimetics/KEAP1 antagonists for 6 h as indicated (tBHQ, 50 μm; sulforaphane, 20 μm). Ubiquitylation of NRF2 was assayed as in Fig. 3. E, HEK293T were transfected with plasmids encoding FLAG-MCM3 and VSV-UB with or without KEAP1 and treated with or without ROS mimetics/KEAP1 antagonists as in C. MCM3 ubiquitylation was assayed as in Fig. 3. E, HEK293T cells were transfected with plasmids encoding FLAG-MCM3 and VSV-UB with or without KEAP1 and treated with or without chloroquine (lysosomal degradation inhibitor; 100 μm) or rapamycin (autophagy inducer, 10 μm) for 6 h. MCM3 ubiquitylation was assayed as in Fig. 3. LC3 I-II conversion served as a control for treatment. Each experiment (A–E) is representative of two to three biological replicates.
FIGURE 7.
FIGURE 7.
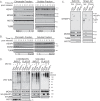
KEAP1 associates with chromatin. A, HeLa cells were transfected with control or KEAP1 siRNA and synchronized by double thymidine-nocodazole block. Lysates were collected during G1 and S phases, separated into soluble and chromatin fractions, and probed for KEAP1, MCM3, and loading and fractionation controls (C). B, HeLa cells were transfected as in A, synchronized by double thymidine block, collected during S and G2 phases, fractionated, and blotted as in A. C, HEK293T cells stably expressing BirA*-KEAP1 or BirA*-GFP were separated into chromatin (Chrom) and soluble (Sol) fractions, and the amount of MCM3 biotinylated by KEAP1 in each fraction was assessed by streptavidin (Strept) AP. D, HEK293T cells were transfected with the indicated plasmids and separated into chromatin and soluble fractions. Ubiquitylated MCM3 in each fraction was evaluated by IP/Western blotting. Each experiment is representative of two to three biological replicates. TUBB, beta tubulin; n.s., non-specific band.

References

    1. Kobayashi A., Ohta T., and Yamamoto M. (2004) Unique function of the Nrf2-Keap1 pathway in the inducible expression of antioxidant and detoxifying enzymes. Methods Enzymol. 378, 273–286 - PubMed
    1. Furukawa M., and Xiong Y. (2005) BTB protein Keap1 targets antioxidant transcription factor Nrf2 for ubiquitination by the Cullin 3-Roc1 ligase. Mol. Cell. Biol. 25, 162–171 - PMC - PubMed
    1. Zhang D. D., Lo S. C., Cross J. V., Templeton D. J., and Hannink M. (2004) Keap1 is a redox-regulated substrate adaptor protein for a Cul3-dependent ubiquitin ligase complex. Mol. Cell. Biol. 24, 10941–10953 - PMC - PubMed
    1. Baird L., and Dinkova-Kostova A. T. (2013) Diffusion dynamics of the Keap1-Cullin3 interaction in single live cells. Biochem. Biophys. Res. Commun. 433, 58–65 - PubMed
    1. Jiang Z. Y., Chu H. X., Xi M. Y., Yang T. T., Jia J. M., Huang J. J., Guo X. K., Zhang X. J., You Q. D., and Sun H. P. (2013) Insight into the intermolecular recognition mechanism between Keap1 and IKKβ combining homology modelling, protein-protein docking, molecular dynamics simulations and virtual alanine mutation. PLoS ONE 8, e75076. - PMC - PubMed