. 2016 Nov 11;291(46):24133-24147.
doi: 10.1074/jbc.M116.748236. Epub 2016 Sep 12.

Molecular Architecture of Contactin-associated Protein-like 2 (CNTNAP2) and Its Interaction with Contactin 2 (CNTN2)

Affiliations

Molecular Architecture of Contactin-associated Protein-like 2 (CNTNAP2) and Its Interaction with Contactin 2 (CNTN2)

Zhuoyang Lu et al. J Biol Chem. .

Abstract

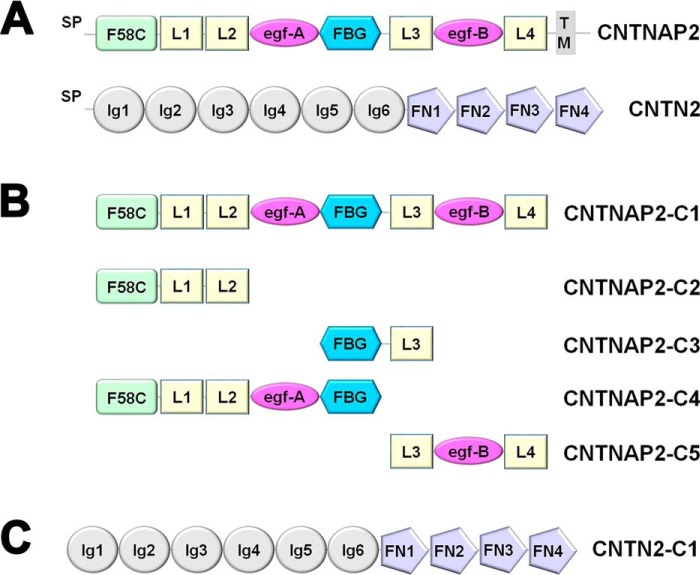
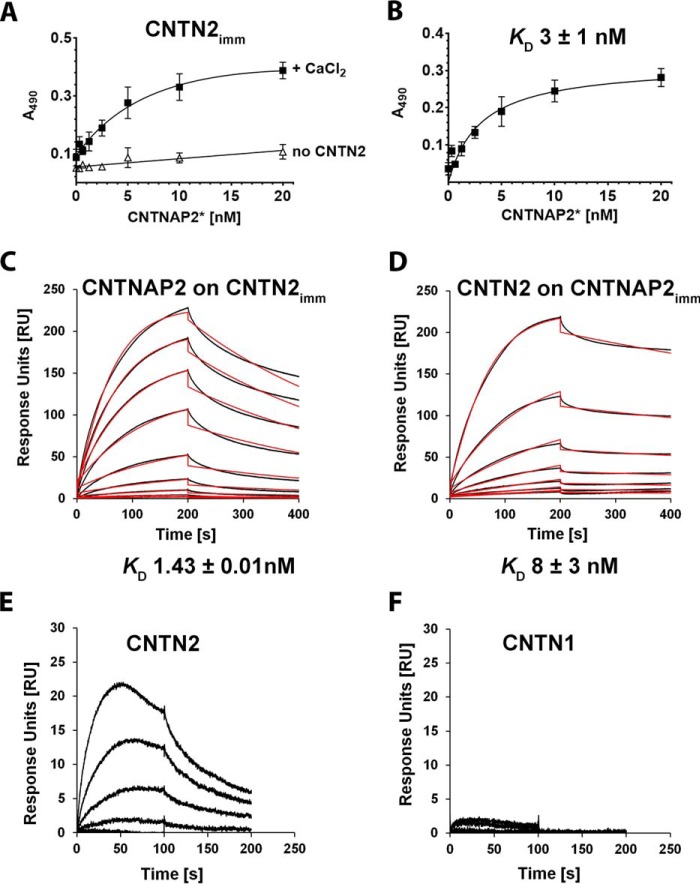
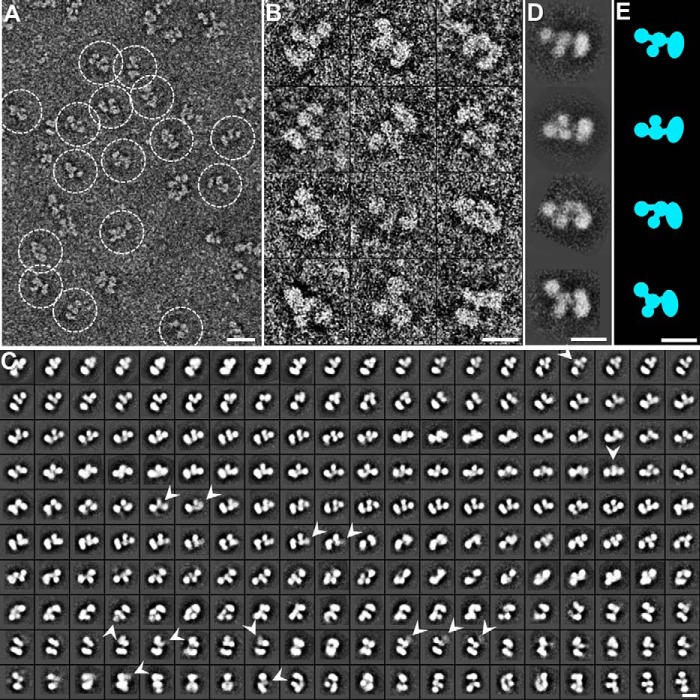
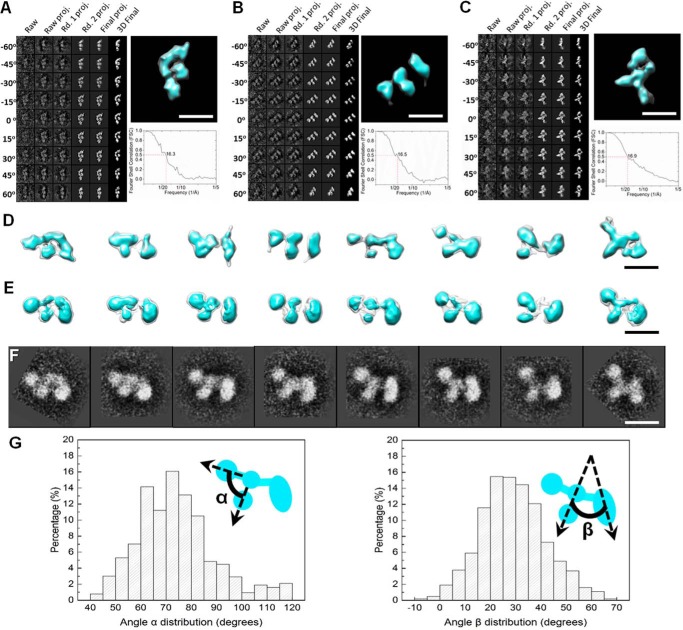
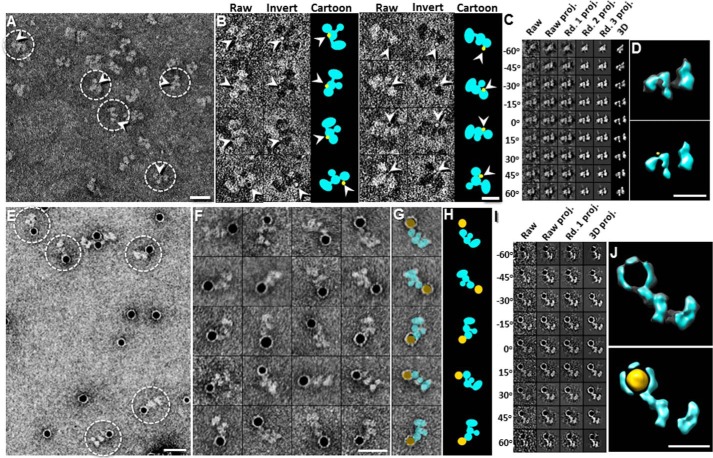
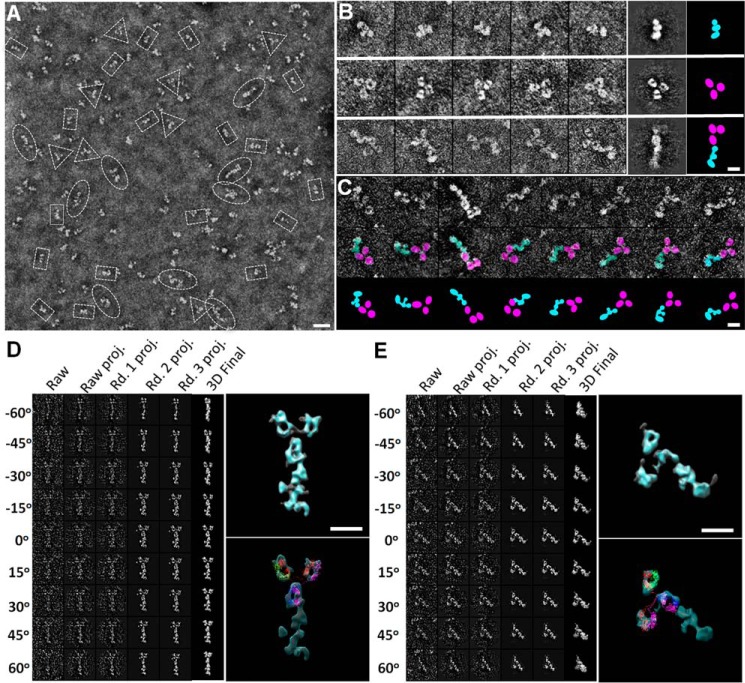
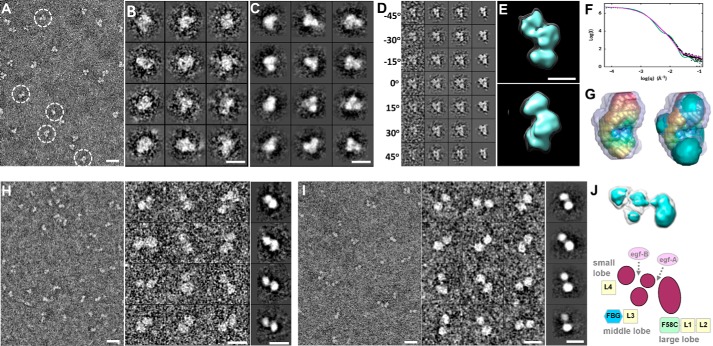
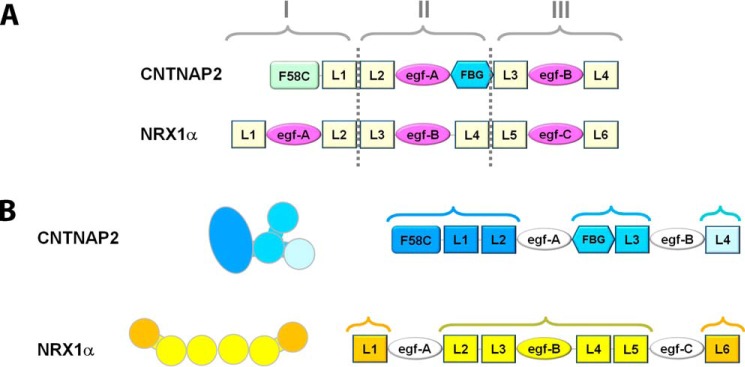
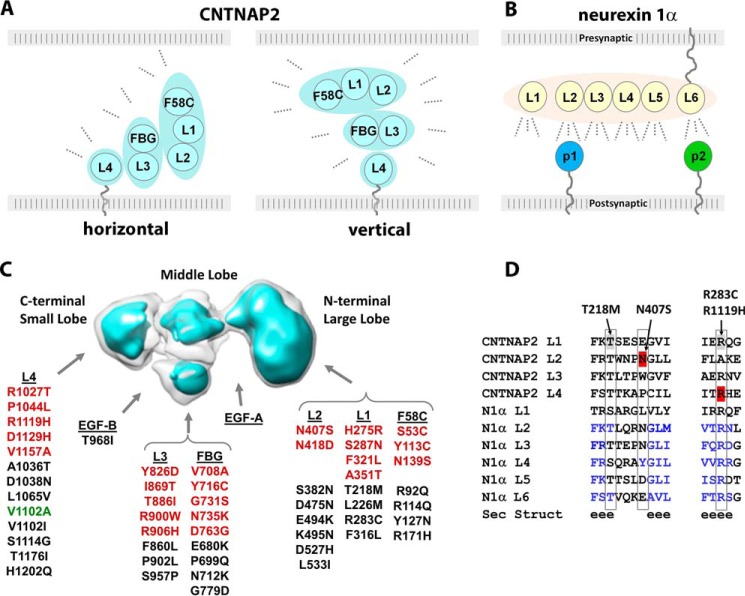
Contactin-associated protein-like 2 (CNTNAP2) is a large multidomain neuronal adhesion molecule implicated in a number of neurological disorders, including epilepsy, schizophrenia, autism spectrum disorder, intellectual disability, and language delay. We reveal here by electron microscopy that the architecture of CNTNAP2 is composed of a large, medium, and small lobe that flex with respect to each other. Using epitope labeling and fragments, we assign the F58C, L1, and L2 domains to the large lobe, the FBG and L3 domains to the middle lobe, and the L4 domain to the small lobe of the CNTNAP2 molecular envelope. Our data reveal that CNTNAP2 has a very different architecture compared with neurexin 1α, a fellow member of the neurexin superfamily and a prototype, suggesting that CNTNAP2 uses a different strategy to integrate into the synaptic protein network. We show that the ectodomains of CNTNAP2 and contactin 2 (CNTN2) bind directly and specifically, with low nanomolar affinity. We show further that mutations in CNTNAP2 implicated in autism spectrum disorder are not segregated but are distributed over the whole ectodomain. The molecular shape and dimensions of CNTNAP2 place constraints on how CNTNAP2 integrates in the cleft of axo-glial and neuronal contact sites and how it functions as an organizing and adhesive molecule.

Keywords: cell adhesion; cell surface receptor; contactin; contactin-associated protein like; neuropsychiatric disorders; protein-protein interaction; single particle analysis; structural biology; synapse; synaptic organizer.


Figures

FIGURE 1.
FIGURE 1.
CNTNAP2 and CNTN2. A, domain structure of CNTNAP2 and CNTN2. CNTNAP2 contains a coagulation factor 5/8 type C (F58C) domain; laminin, neurexin, sex hormone binding globulin (LNS or L) domains; egf-like repeats (egf); and a fibrinogen-like (FBG) domain. CNTN2 contains Ig and fibronectin type III domains (FN). Signal peptides (SP) and trans-membrane domain (TM) are indicated. B, CNTNAP2 constructs used in this study. C, CNTN2-C1 construct used in this study. CNTN1-C1 has an analogous domain organization. To improve legibility, CNTNAP2-C1 is abbreviated to CNTNAP2, CNTN2-C1 to CNTN2, and CNTN1-C1 to CNTN1 throughout the text.
FIGURE 2.
FIGURE 2.
Extracellular domains of CNTNAP2 and CNTN2. A, SDS-PAGE analysis of purified recombinant CNTNAP2 (lane 1) and CNTN2 (lane 3). Markers (in kDa) are shown in lane 2. B, size exclusion chromatography of CNTNAP2; C, size exclusion chromatography of CNTN2; D, size exclusion chromatography of standards (2,000, 200, 66, 29, and 12.4 kDa) and resulting calibration line. Samples and standards were run in triplicate. The average elution volume (EVave) and S.D. value are shown. The apparent molecular masses (Mapp) are indicated and reflect large versus small species.
FIGURE 3.
FIGURE 3.
Binding between CNTNAP2 and CNTN2 ectodomains. A, increasing concentrations of biotinylated CNTNAP2* were incubated in wells with immobilized CNTN2 in presence of 5 mm CaCl2 (■) or in wells lacking CNTN2 (▵). B, specific binding, expressed as the total binding in the presence of Ca2+ minus the binding in the absence of CNTN2. Error bars, S.E. C, binding of soluble CNTNAP2 to a CNTN2-coupled sensor by SPR. Binding curves of CNTNAP2 (0.125–10 nm) (in black) were fit to a 1:1 binding model (red). D, binding of soluble CNTN2 to a CNTNAP2-coupled sensor by SPR. Binding curves of CNTN2 (1.56–200 nm) (black) were fit to a 1:1 binding model (red). E and F, side-by-side comparison of CNTN2 and CNTN1 binding to a single CNTNAP2-coupled sensor by SPR.
FIGURE 4.
FIGURE 4.
Negative staining EM images and reference-free class averages of CNTNAP2. A, survey view of CNTNAP2 particles prepared by optimized negative staining. B, 12 representative particles of CNTNAP2. C, all 200 reference-free class averages calculated from 53,774 particles picked from 1,392 micrographs. In some class averages, a domain is fuzzy, probably due to flexibility and the dynamics of the protein (arrowheads). D, four selected reference-free class averages of the particles. E, schematic of particles corresponding to D. Scale bar, 200 Å (A) and 100 Å (B–E).
FIGURE 5.
FIGURE 5.
Three-dimensional reconstruction and conformational variability analysis of CNTNAP2. A–C, process to generate representative 3D density maps, each from an individual CNTNAP2 particle, using IPET (left). Three examples are shown. Final IPET 3D density map of each single CNTNAP2 particle is displayed in the top right panel, and Fourier shell correlation is displayed in the bottom right panel. D, eight 3D density maps each reconstructed from a single molecule from electron tomographic images using the IPET method. E, eight single-particle 3D reconstructions of CNTNAP2. Each reconstruction was refined using an IPET 3D reconstruction as an initial model obtained via a multireference refinement algorithm using the EMAN single-particle reconstruction software. F, selected referenced 2D classifications supporting the range of particle conformational variability seen in D and E. G, histograms of the angles between the small and medium lobe (α) and between the medium and large lobe (β). Envelopes in D and E are displayed at contour levels corresponding to volumes of ∼133 kDa (cyan) and 266 kDa (transparent). Scale bars, 100 Å.
FIGURE 6.
FIGURE 6.
Identification of the C-terminal end of CNTNAP2 by nanogold labeling. A, survey NS EM view of CNTNAP2 bound to 1.8-nm Ni-NTA nanogold. B, eight representative images of complexes of CNTNAP2 bound to 1.8-nm Ni-NTA nanogold. Raw particle images are shown in the first column (nanogold in black), contrast-inverted images in the second column (nanogold in white), and schematic representations in the third column (protein in cyan, gold particles in yellow). C, process to generate a representative 3D density map from an individual particle of CNTNAP2 labeled with 1.8-nm nanogold using IPET. D, final IPET 3D density map of a single CNTNAP2 particle labeled with 1.8-nm nanogold (top). To show the nanogold location with respect to the protein, we inverted the final 3D density map (shown in yellow) and overlaid it with the original 3D density map (bottom). E, survey NS-EM of CNTNAP2 bound to 5-nm Ni-NTA nanogold. F, 20 representative images of selected particles. G, the particles shown in the last column of F are overlaid with schematics of CNTNAP2 (cyan) and nanogold (yellow). H, schematic representations of CNTNAP2 bound to nanogold shown in G. I, process to generate a representative 3D density map from a targeted CNTNAP2 particle labeled with 5-nm nanogold using IPET. J, final IPET 3D density map of a single CNTNAP2 particle labeled with 5-nm nanogold (top). Bottom is shown the final 3D density map (cyan) overlaid with its inverted 3D density map (yellow) to visualize the nanogold position bound to CNTNAP2. Scale bar, 200 Å (A, E, and F), 100 Å (B, D, and J).
FIGURE 7.
FIGURE 7.
Identification of the C-terminal end of CNTNAP2 by monoclonal antibody K67/25. A, survey NS-EM view of CNTNAP2 in complex with the monoclonal antibody K67/25. The ratio of particles observed was ∼74 ± 6% CNTNAP2 (rectangles), ∼13 ± 4% antibody (triangles), and ∼13 ± 3% complex (ovals). B, representative CNTNAP2 particles (top), antibody particles (middle), and CNTNAP2-antibody complexes (bottom). The last two columns show the representative reference-free class averages and corresponding schematic. C, series of CNTNAP2-antibody complexes indicating the range of conformational heterogeneity (top) and schematic representations (bottom). D, process to generate a representative 3D density map from a targeted CNTNAP2-antibody complex using IPET. Final IPET 3D density map of a single CNTNAP2-antibody complex shown in the top right panel. Final 3D density map overlaid with an IgG antibody (Protein Data Bank code 1IGT) is shown in the bottom panel. During docking, the linkers between the Fab and Fc domains were allowed to flex. E, process to generate another representative 3D density map from a targeted CNTNAP2-antibody complex using IPET as performed in D. Scale bar, 200 Å (A) and 100 Å (B, C, D, and E).
FIGURE 8.
FIGURE 8.
Deconstruction of the CNTNAP2 extracellular domain using fragments. A, survey NS-EM view of the CNTNAP2-C2 fragment (F58C-L1-L2). B, selected raw images of CNTNAP2-C2 particles. C, selected reference-free 2D class averages of CNTNAP2-C2. D, process to generate a representative 3D density map from a targeted CNTNAP2-C2 particle using IPET. E, final IPET 3D reconstruction viewed from two perpendicular angles. F, log-log plot of the SAXS data for CNTNAP2-C2 (●), the fit from the averaged ab initio SAXS bead model (magenta line), and the calculated scattering from the CNTNAP2-C2 EM envelope contoured at 5.19σ (green line). G, left, averaged ab initio SAXS shape (rainbow-colored) calculated for 25 bead models and the range of all 25 bead models (gray). Right, superposition of the averaged SAXS shape (rainbow-colored) with the CNTNAP2-C2 EM envelope (cyan) contoured at 5.19σ. H, survey NS-EM view, selected particle images, and selected reference-free 2D class averages of CNTNAP2-C3 (FBG-L3). I, survey NS-EM view, selected particle images, and reference-free 2D class averages of CNTNAP2-C5 (L3-egf-B-L4). J, tentative domain assignment of the large, middle, and small lobes of CNTNAP2. Scale bar, 200 Å (A, H (left), and I (left)), 100 Å (B, C, H (middle and right), and I (middle and right)), and 50 Å (E).
FIGURE 9.
FIGURE 9.
CNTNAP2 and neurexin 1α possess different three-dimensional architectures. A, CNTNAP2 and neurexin 1α ectodomains color-coded according to their domain identities reveal a similar composition. Based on amino acid sequence alone, neurexins can be divided into three repeats, I, II, and III; CNTNAP2 shares common aspects. B, composition of CNTNAP2 and neurexin 1α ectodomains color-coded to indicate their three-dimensional architectural organization (see also the “Results” section).
FIGURE 10.
FIGURE 10.
Structural architecture and functional relationships of CNTNAP2. A, possible orientations of the CNTNAP2 ectodomain in the cleft of synaptic and axo-glial contacts. B, a horizontal orientation of the presynaptic neurexin 1α ectodomain at synaptic clefts promotes binding of protein partners tethered to the postsynaptic membrane (p1 and p2). C, location of amino acid substitutions in CNTNAP2 found in patient (red) and control (black) groups or both (green) as described in the “Results” section. D, sequence alignment of LNS domains from CNTNAP2 and neurexin 1α. Secondary structure prediction is shown (e is β-strand). Mutations discussed are indicated.

References

    1. Scott-Van Zeeland A. A., Abrahams B. S., Alvarez-Retuerto A. I., Sonnenblick L. I., Rudie J. D., Ghahremani D., Mumford J. A., Poldrack R. A., Dapretto M., Geschwind D. H., and Bookheimer S. Y. (2010) Altered functional connectivity in frontal lobe circuits is associated with variation in the autism risk gene CNTNAP2. Sci. Transl. Med. 2, 56ra80 - PMC - PubMed
    1. Rodenas-Cuadrado P., Ho J., and Vernes S. C. (2014) Shining a light on CNTNAP2: complex functions to complex disorders. Eur. J. Hum. Genet. 22, 171–178 - PMC - PubMed
    1. Lancaster E., and Dalmau J. (2012) Neuronal autoantigens-pathogenesis, associated disorders and antibody testing. Nat. Rev. Neurol. 8, 380–390 - PMC - PubMed
    1. Zweier C. (2012) Severe intellectual disability associated with recessive defects in CNTNAP2 and NRXN1. Mol. Syndromol. 2, 181–185 - PMC - PubMed
    1. Buchner D. A., Geisinger J. M., Glazebrook P. A., Morgan M. G., Spiezio S. H., Kaiyala K. J., Schwartz M. W., Sakurai T., Furley A. J., Kunze D. L., Croniger C. M., and Nadeau J. H. (2012) The juxtaparanodal proteins CNTNAP2 and TAG1 regulate diet-induced obesity. Mamm. Genome 23, 431–442 - PMC - PubMed

Associated data