. 2016 Sep 27;113(39):10956-61.
doi: 10.1073/pnas.1603325113. Epub 2016 Sep 12.

CD8 T cell-mediated killing of orexinergic neurons induces a narcolepsy-like phenotype in mice

Affiliations

CD8 T cell-mediated killing of orexinergic neurons induces a narcolepsy-like phenotype in mice

Raphaël Bernard-Valnet et al. Proc Natl Acad Sci U S A. .

Abstract

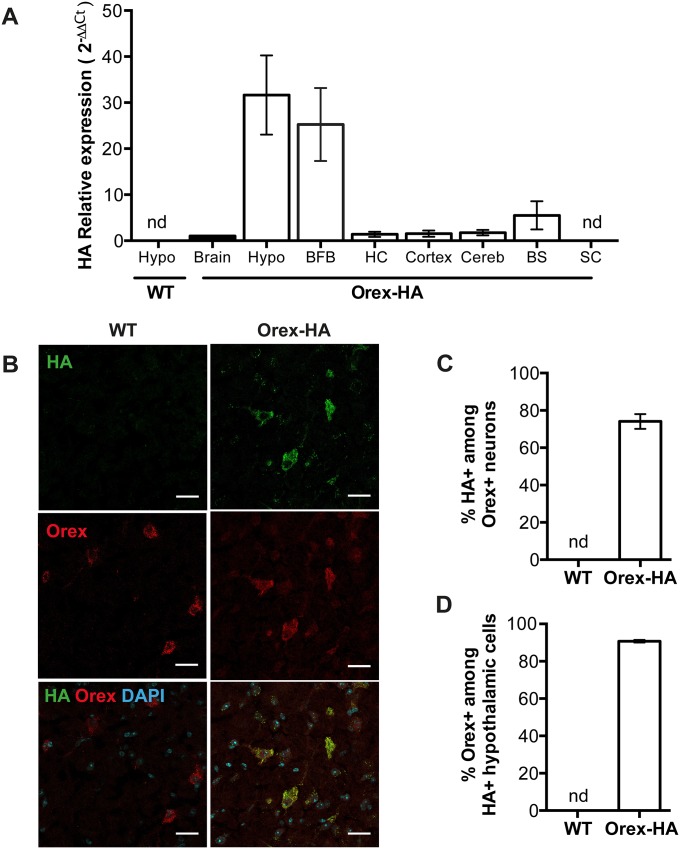
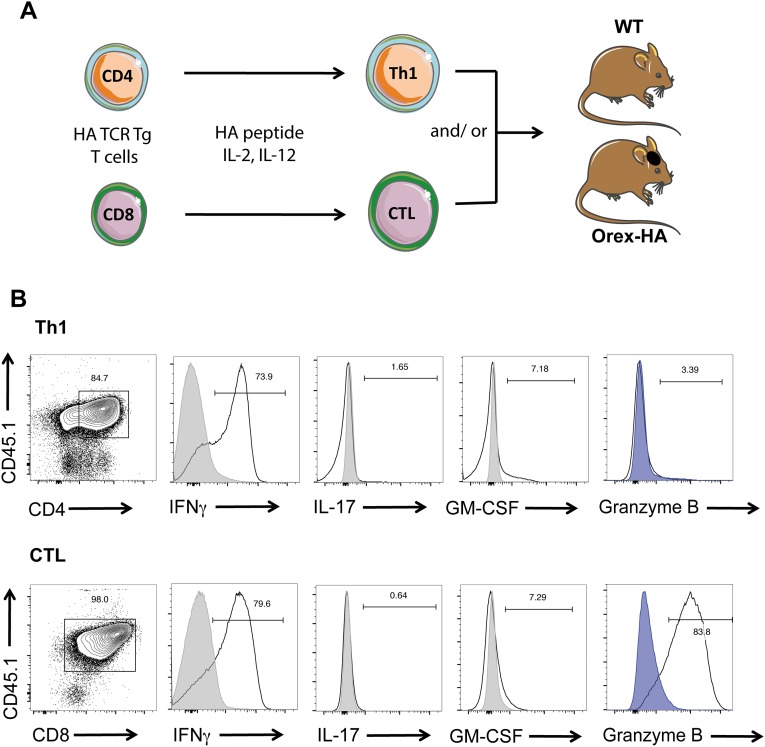
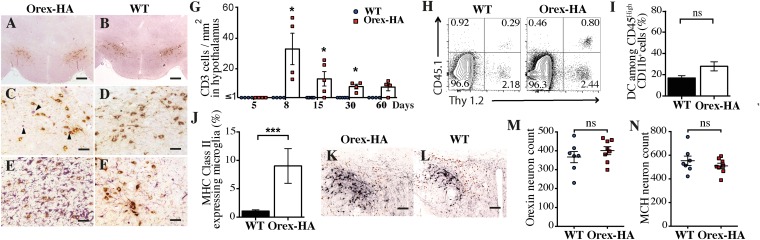
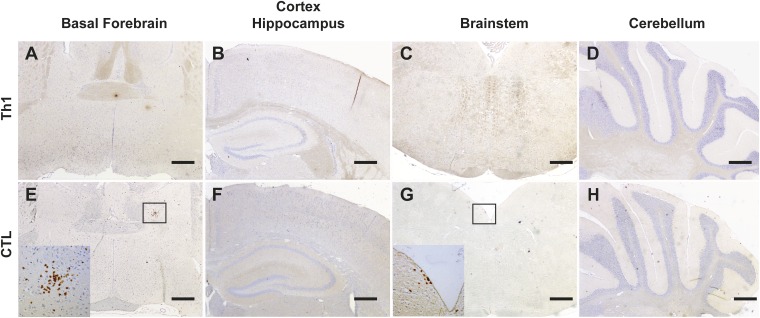
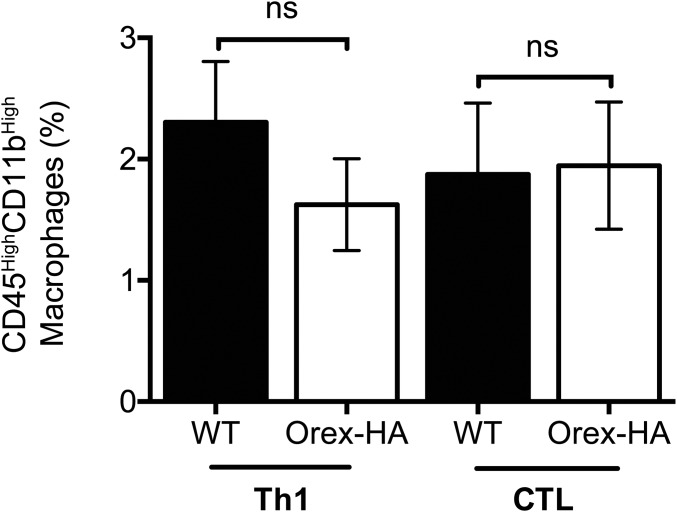
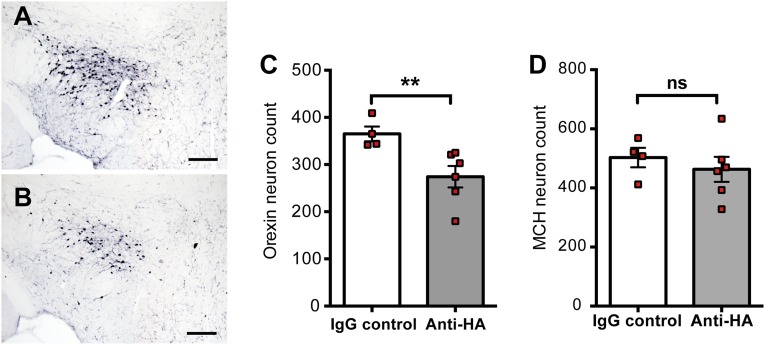
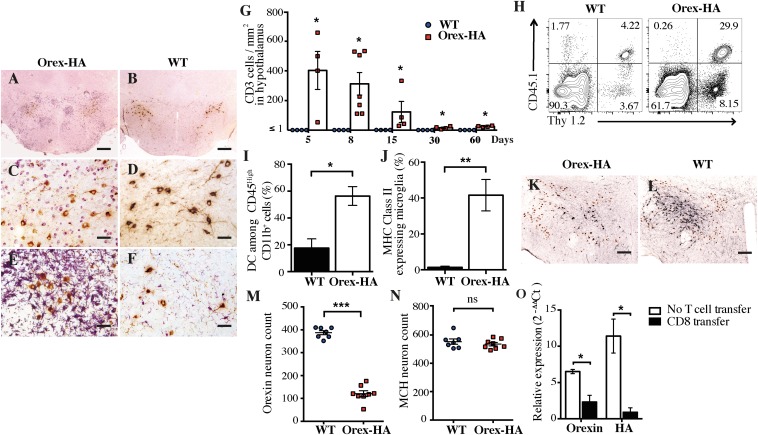
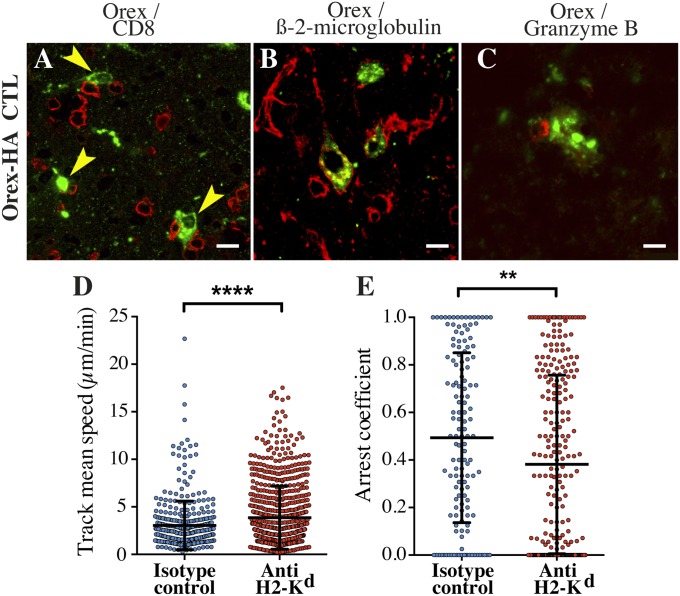
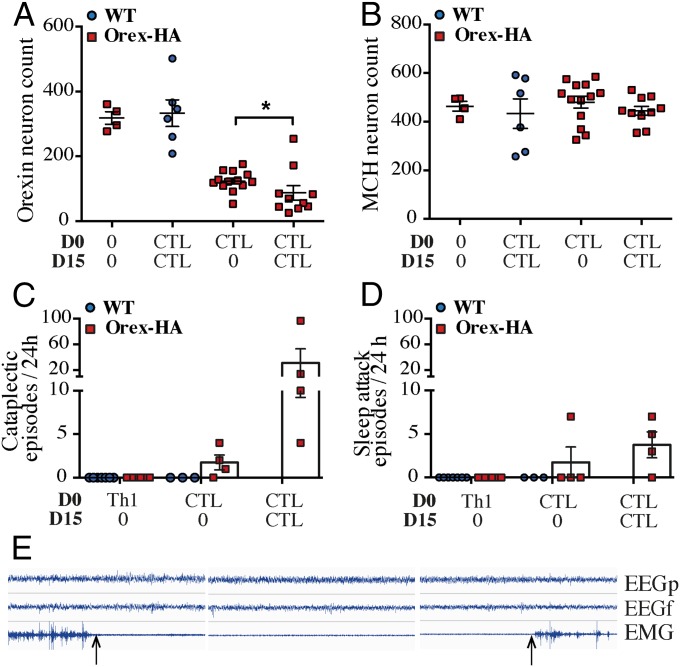
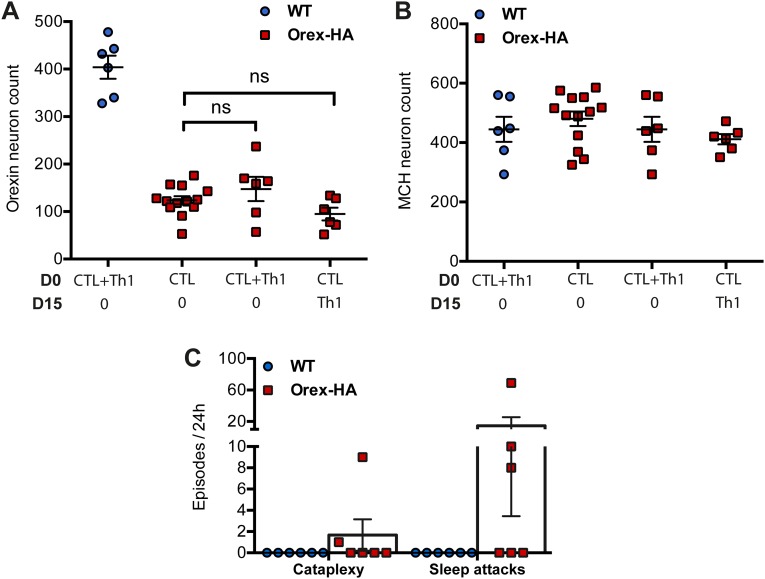
Narcolepsy with cataplexy is a rare and severe sleep disorder caused by the destruction of orexinergic neurons in the lateral hypothalamus. The genetic and environmental factors associated with narcolepsy, together with serologic data, collectively point to an autoimmune origin. The current animal models of narcolepsy, based on either disruption of the orexinergic neurotransmission or neurons, do not allow study of the potential autoimmune etiology. Here, we sought to generate a mouse model that allows deciphering of the immune mechanisms leading to orexin(+) neuron loss and narcolepsy development. We generated mice expressing the hemagglutinin (HA) as a "neo-self-antigen" specifically in hypothalamic orexin(+) neurons (called Orex-HA), which were transferred with effector neo-self-antigen-specific T cells to assess whether an autoimmune process could be at play in narcolepsy. Given the tight association of narcolepsy with the human leukocyte antigen (HLA) HLA-DQB1*06:02 allele, we first tested the pathogenic contribution of CD4 Th1 cells. Although these T cells readily infiltrated the hypothalamus and triggered local inflammation, they did not elicit the loss of orexin(+) neurons or clinical manifestations of narcolepsy. In contrast, the transfer of cytotoxic CD8 T cells (CTLs) led to both T-cell infiltration and specific destruction of orexin(+) neurons. This phenotype was further aggravated upon repeated injections of CTLs. In situ, CTLs interacted directly with MHC class I-expressing orexin(+) neurons, resulting in cytolytic granule polarization toward neurons. Finally, drastic neuronal loss caused manifestations mimicking human narcolepsy, such as cataplexy and sleep attacks. This work demonstrates the potential role of CTLs as final effectors of the immunopathological process in narcolepsy.

Keywords: CD8 T cells; autoimmunity; narcolepsy; orexin; sleep disorders.


Conflict of interest statement

The authors declare no conflict of interest.

Figures

Fig. S1.
Fig. S1.
HA is expressed in orexin+ neurons in Orex-HA mice. (A) Detection of HA mRNA expression by quantitative RT-PCR within different brain structures of Orex-HA and WT animals. BFB, basal forebrain; BS, brainstem; Cereb, cerebellum; HC, hippocampus; Hypo, hypothalamus; SC, spinal cord. Results are expressed as mean ± SEM from 5–11 mice per CNS region, from five independent experiments. nd, not detected. (B) Representative immunofluorescence analysis of HA and orexin-A expression in the hypothalamus of WT and Orex-HA animals. Nuclei are labeled with DAPI. Red and green stainings reveal orexin and HA, respectively. (Scale bars: 25 μm.) (C and D) Percentages of HA+ cells among orexin+ neurons (C) and of orexin+ neurons among HA+ cells in the hypothalamus (D). Results are expressed as mean ± SEM of 4–13 mice per group from four independent experiments. nd, not detectable.
Fig. S2.
Fig. S2.
Transfer of HA-specific Th1 and/or CTLs in Orex-HA and WT animals. (A) Naive HA-specific CD4 and CTLs isolated from TCR transgenic mice were differentiated in vitro toward Th1 cells and CTLs, respectively, before their adoptive transfer i.v. into Orex-HA or WT nontransgenic littermates. HA-specific Th1 cells (CD45.1+ CD4+) or CTLs (CD45.1+ CD8+) comprise 80–98% of the transferred cells. (B) Before injection, the quality of T-cell differentiation was verified by flow cytometry based on the expression of IFN-γ, IL-17, GM-CSF, and granzyme B after phorbol 12-myristate 13-acetate /ionomycin stimulation. Gray curves delineate staining on unstimulated T cells, and blue curves delineate staining with isotype control antibodies.
Fig. 1.
Fig. 1.
Neo-self-antigen–specific Th1 cells trigger focal hypothalamic inflammation but no loss of orexinergic neurons. (AD) Immunohistochemistry staining for CD3 (violet) and orexin-A (brown) in Orex-HA mice (A and C) and WT littermate control mice (B and D) 8 d after transfer of 3 × 10⁷ neo-self-antigen–specific Th1 cells. (E and F) Immunohistochemistry staining for Iba-1 (violet) and orexin+ neurons (brown) in Orex-HA (E) and WT (F) mice. Representative results from four or five mice per group are shown. Arrowheads in C point to infiltrating CD3+ cells. [Scale bars: 200 μm (A and B) or 50 μm (CF).] (G) Quantification of CD3+ T cells in the hypothalamus of WT or Orex-HA mice at different time points after Th1 injection. Each symbol represents an individual mouse. Results are expressed as mean ± SEM of four or five mice per group for each time point. (H) Representative FACS plots of brain-infiltrating cells from WT or Orex-HA animals at day 8 after Th1 transfer. Representative results from three independent experiments are shown. (I and J) Frequency of CD11c+ among CD45high CD11b+ cells was assessed by flow cytometry (I) and MHC class II expression on CD45dim CD11b+ Thy1.2 microglia (J). Results are expressed as mean ± SEM of 12 mice per group from three independent experiments. (K and L) At 60 d after Th1 cell transfer, double immunohistochemistry, staining for orexin+ neurons (black) and MCH+ neurons (brown) in Orex-HA mice (K) and WT controls (L). Representative results from seven or eight mice per group are shown. [Scale bars: 125 μm (K and L).] (M and N) The density of orexin+ neurons (M) and MCH+ neurons (N) in Orex-HA and WT mice is shown at day 60 after Th1 injection. Results are expressed as mean ± SEM of seven or eight mice per group from two independent experiments. Statistical analysis was performed by using the Mann–Whitney u test. ns, not significant. *P < 0.05; ***P < 0.001.
Fig. S3.
Fig. S3.
Mild or no T-cell infiltration is detected outside the hypothalamus in Orex-HA mice injected with HA-specific Th1 or CTL. Immunohistological staining of brain sections of Orex-HA mice at day 8 after Th1 (AD) or CTL transfer (EH) to detect T-cell infiltration (CD3, brown) in extrahypothalamic regions including basal forebrain (A and E), cortex, and hippocampus (B and F), brainstem (C and G), and cerebellum (D and H) is shown. Insets highlight rare CD3+ cells in the brain parenchyma. Nuclear counterstaining was performed with hematoxylin (blue). Representative results from four or five mice per group are shown. (Scale bars: 200 μm.)
Fig. S4.
Fig. S4.
T-cell infiltration in the hypothalamus is not associated with recruitment of macrophages. The proportion of macrophages (CD45High CD11bHigh) among living cells extracted from the brains of WT mice (filled bars) and Orex-HA (open bars) 8 d after Th1 or CTL transfer was assessed by flow cytometry. Results are expressed as mean ± SEM of 6–11 mice per group from three independent experiments. Statistical analysis was performed by using the Mann–Whitney u test. ns, not significant.
Fig. S5.
Fig. S5.
Persistence of inflammation within the hypothalamus after transfer of HA-specific Th1 cells or CTLs. (AD) Staining for T cells (CD3, violet) and orexin+ neurons (brown) (A and B) or microglia (Iba1; violet) and orexin+ neurons (brown) (C and D) in Orex-HA (A and C) and WT (B and D) mice, 60 d after Th1 transfer. (EH) Staining for T cells (CD3, violet) and orexin+ neurons (brown) (E and F), or microglia (Iba1; violet) and orexin+ neurons (brown) (G and H) in Orex-HA (E and G) and WT (F and H) mice, 60 d after CTL transfer. Arrowheads in A and E point to infiltrating CD3+ T cells. Representative results from four to eight mice per group are shown. (Scale bars: 50 μm.)
Fig. S6.
Fig. S6.
Anti-HA antibodies induce mild loss of orexin+ neurons in the context of Th1 inflammatory lesions. Enumeration of orexin+ neurons 60 d after transfer of 3 × 10⁷ Th1 cells in Orex-HA mice by Immunohistochemistry. (A and B) Mice received either 200 μg of control IgG (A) or anti-HA antibodies (B) every 2 d, from day 5 to day 15 after Th1 transfer. (Scale bars: 150 μm.) (C and D) Quantification of orexin+ (C) and MCH+ (D) neuronal cell bodies in the hypothalamus of Orex-HA mice that received the control IgG (white bars) or the anti-HA antibodies (gray bars). Results are expressed as mean ± SEM of four to six mice per group. Statistical analysis was performed by using the Mann–Whitney u test. **P < 0.01. ns, not significant.
Fig. 2.
Fig. 2.
Orex-HA animals develop massive hypothalamic inflammation and marked orexin neuron loss after transfer of neo-self-antigen–specific CTLs. (AD) Immunohistochemistry staining for CD3 (violet) and orexin-A (brown) in Orex-HA mice (A and C) and WT mice (B and D) 8 d after adoptive transfer of 3 × 10⁷ CTLs. (E and F) Immunohistochemistry staining of microglial (Iba1; violet) and orexin+ neurons (brown) in Orex-HA (E) and WT (F) mice. Representative results from four to seven mice per group are shown. [Scale bars: 200 μm (A and B) or 50 μm (CF).] (G) Quantification of T cells in the hypothalamus of Orex-HA and WT mice at different time points after CTL injection. Results are expressed as mean ± SEM of four to seven mice per group for each time point. (H) Representative FACS plots of brain-infiltrating cells from Orex-HA and WT littermates on day 8 after CTL transfer. (I and J) The proportion of CD11c+ among CD45high CD11b+ cells (I) and the expression of MHC class II molecules on CD45dim CD11b+ Thy1.2 cells microglia (J) were assessed by flow cytometry. Results are expressed as mean ± SEM of six to eight mice per group from three independent experiments. Statistical analyses were performed by using the Mann–Whitney u test. *P < 0.05; **P < 0.01, comparing the Orex-HA group with the respective WT controls. (K and L) At 60 d after CTL transfer, immunohistochemistry staining for orexin+ neurons (black) and MCH+ neurons (brown) in Orex-HA animals (K) and WT mice (L). [Scale bars: 125 μm (K and L).] (M and N) Quantification of orexin+ (M) and MCH+ (N) neuronal cell bodies in the hypothalamus of Orex-HA mice compared with WT animals 60 d after CTL transfer. Results are expressed as mean ± SEM of seven or eight mice per group from two independent experiments. (O) Expression of orexin and HA mRNA in the hypothalamus of Orex-HA mice that received neo-self-antigen–specific CTLs or have been left untreated. Results are expressed as mean ± SEM of four or five mice per group from two independent experiments. Statistical analyses were performed by using the Mann–Whitney u test. *P < 0.05; **P < 0.01; ***P < 0.001. ns, not significant.
Fig. 3.
Fig. 3.
CTL-mediated cytotoxicity contributes to orexin+ neuron loss in Orex-HA mice. (A and B) Representative confocal micrographs of CTLs (anti-CD8; red) and orexin+ neurons (anti–orexin-A; green) (A) or MHC class I expression (anti–β2-microglobulin; red) and orexin+ neuron (anti-orexin A; green) in Orex-HA mice (B) 8 days after CTL transfer. (C) Immunofluorescence analysis of granzyme B-containing granules (red) and orexin+ neurons (green) in Orex-HA mice. [Scale bars: 10 μm (AC).] Analysis of the behavior of CellTrace violet-labeled neo-self-antigen–specific CTLs interacting with orexinergic neurons from ZsGreen Orex-HA mice by two-photon laser scanning microscopy in ex vivo slices of hypothalamus. (D) The mean speed of labeled T cells was analyzed in the presence of anti-H2-Kd mAb (red circles; 776 cells) or isotype control IgG (blue circles; 403 cells). (E) The proportion of time spent arrested (<2 μm/min) in contact with ZsGreen+ orexinergic neurons was determined for the CTLs that have once been in contact with ZsGreen+ orexinergic neuron cell bodies. This subgroup analysis included 263 cells in the presence of anti–H2-Kd mAb and 139 cells in the presence of isotype control IgG. Circles represent individual CTLs in five mice per group from two independent experiments. Results are expressed as mean ± SD, and statistical analyses were performed by using the unpaired Student t test. **P < 0.01; ****P < 0.0001.
Fig. 4.
Fig. 4.
Repeated injections of CTLs aggravate the loss of orexin+ neurons in Orex-HA animals and lead to a narcolepsy-like phenotype. (A and B) Quantification of orexin+ neurons (A) and MCH+ neurons (B) in Orex-HA mice (red squares) that received no injection, CTLs once, or CTLs twice (15 d apart) 60 days after adoptive transfer. The results of WT mice (blue circles) that received CTLs twice (15 d apart) are also shown. Results for Orex-HA mice receiving CTLs once are already partially depicted in Fig. 2. Results are expressed as mean ± SEM of 4–13 mice per group. Statistical analyses were performed by using the Mann–Whitney u test. *P < 0.05. (C and D) Enumeration of cataplexy episodes (C) and sleep attacks (D) during 24 h in Orex-HA animals (red squares) and WT mice (blue circles) that were injected with Th1 cells or with CTLs once or twice (15 d apart). The behavioral arrests were subdivided into sleep attacks or cataplexy according to their EEG/EMG features. Results are expressed as mean ± SEM of four mice per group. (E) Example of cataplexy with typical EEG/EMG characteristics. Arrows demarcate the onset and termination of the cataplexy episode.
Fig. S7.
Fig. S7.
HA-specific Th1 cells do not potentiate the cytotoxic effect of CTLs. (A and B) Enumeration of orexin+ (A) and MCH+ (B) neurons 60 d after transfer of either CTLs alone, concomitant transfer of CTLs and Th1, or transfer of CTLs and Th1 15 d apart in Orex-HA (red squares) or WT (blue circles) mice. The type of transferred cells (and timing of injection) is indicated in the bottom of the graph. The group of Orex-HA mice receiving only CTLs is identical to that shown in Fig. 4. Results are expressed as mean ± SEM of 6–13 mice per group. Statistical analyses were performed by using one-way ANOVA, P values were adjusted for multiple comparisons by using Sidak’s test. ns, not significant. (C) Enumeration of cataplexy episodes and sleep attacks during 24 h in WT mice (blue circles) and Orex-HA animals (red squares) after concomitant transfer of CTLs and Th1 cells. Results are expressed as mean ± SEM of six mice per group from two independent experiments.

References

    1. Dauvilliers Y, Arnulf I, Mignot E. Narcolepsy with cataplexy. Lancet. 2007;369(9560):499–511. - PubMed
    1. Peyron C, et al. A mutation in a case of early onset narcolepsy and a generalized absence of hypocretin peptides in human narcoleptic brains. Nat Med. 2000;6(9):991–997. - PubMed
    1. Thannickal TC, et al. Reduced number of hypocretin neurons in human narcolepsy. Neuron. 2000;27(3):469–474. - PMC - PubMed
    1. Tafti M, et al. DQB1 locus alone explains most of the risk and protection in narcolepsy with cataplexy in Europe. Sleep. 2014;37(1):19–25. - PMC - PubMed
    1. Ollila HM, et al. HLA-DPB1 and HLA class I confer risk of and protection from narcolepsy. Am J Hum Genet. 2015;96(1):136–146. - PMC - PubMed

Publication types

LinkOut - more resources