. 2016 Sep 27;113(39):10779-84.
doi: 10.1073/pnas.1607903113. Epub 2016 Sep 12.

Real-time 3D imaging of microstructure growth in battery cells using indirect MRI

Affiliations

Real-time 3D imaging of microstructure growth in battery cells using indirect MRI

Andrew J Ilott et al. Proc Natl Acad Sci U S A. .

Abstract

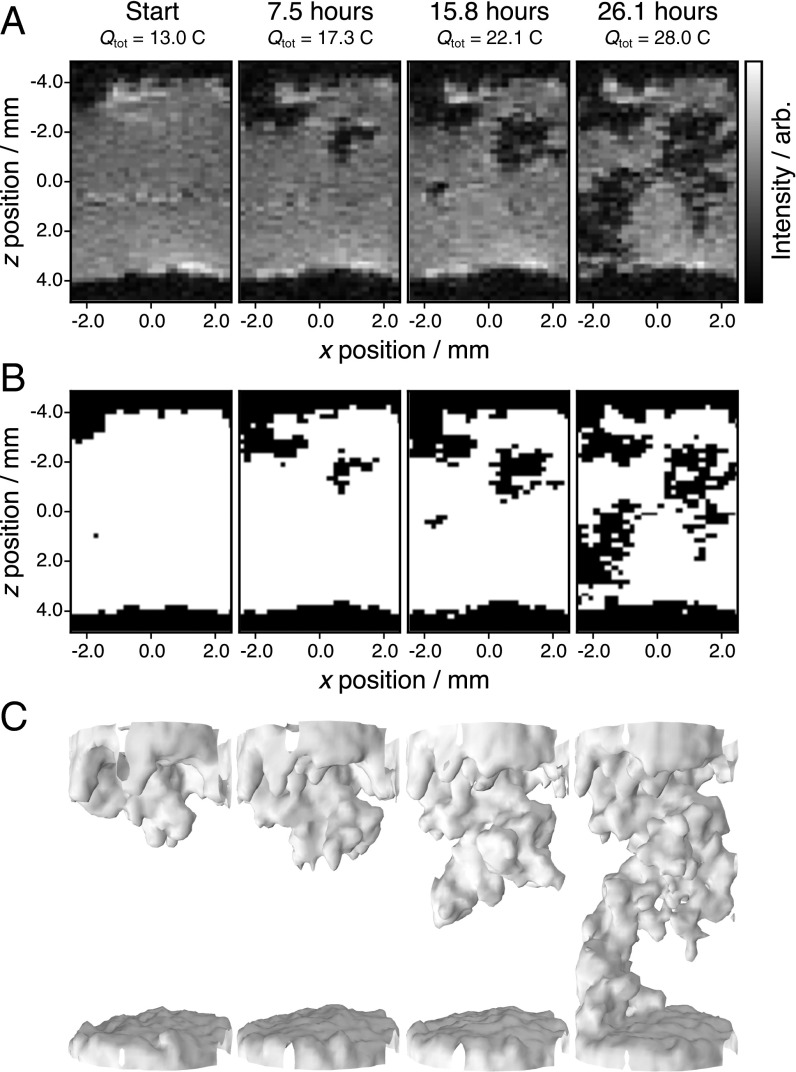
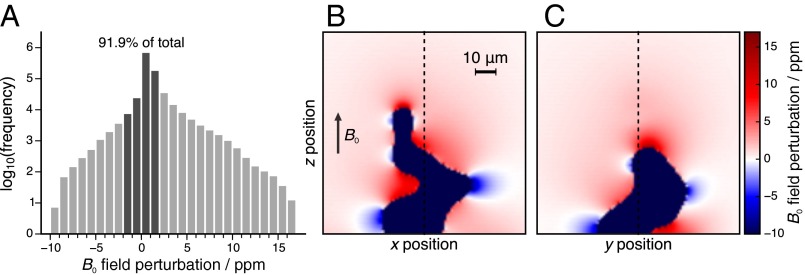
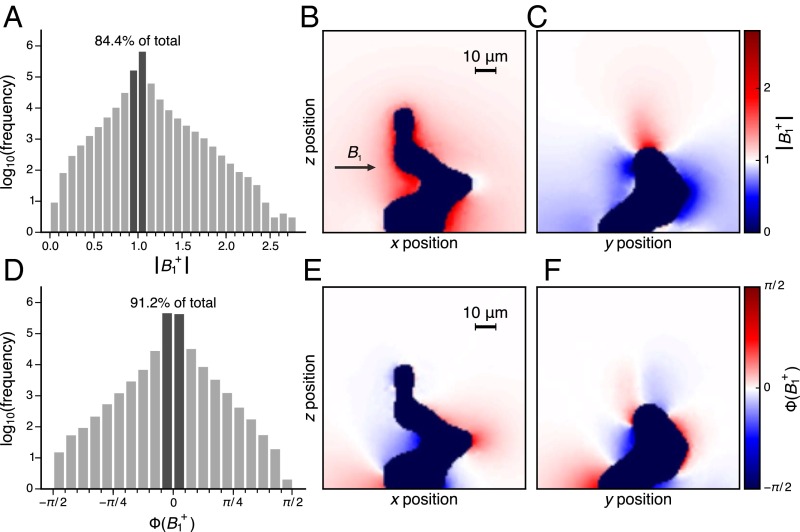
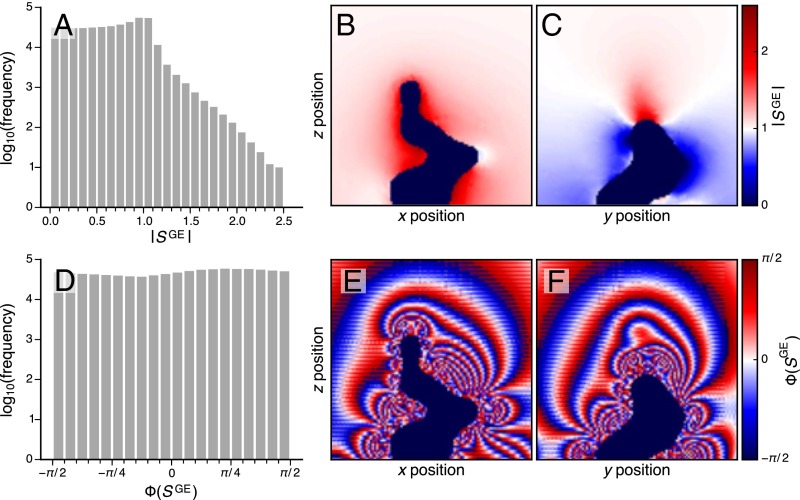
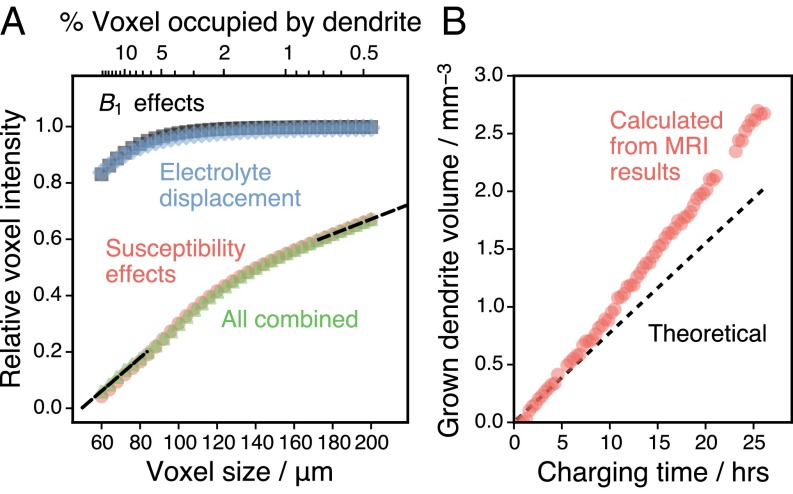
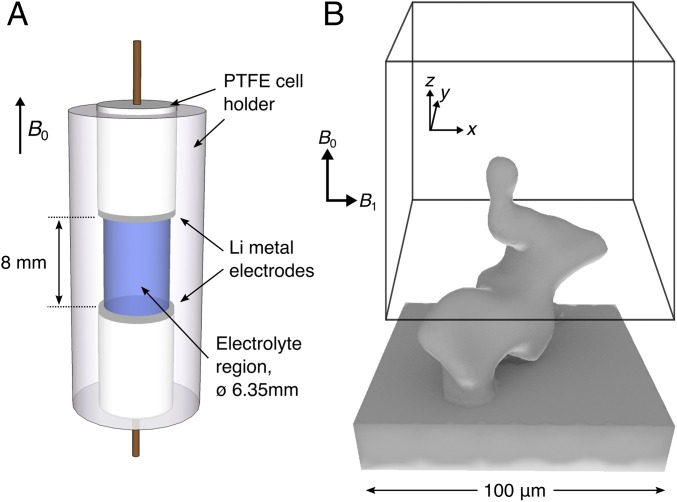
Lithium metal is a promising anode material for Li-ion batteries due to its high theoretical specific capacity and low potential. The growth of dendrites is a major barrier to the development of high capacity, rechargeable Li batteries with lithium metal anodes, and hence, significant efforts have been undertaken to develop new electrolytes and separator materials that can prevent this process or promote smooth deposits at the anode. Central to these goals, and to the task of understanding the conditions that initiate and propagate dendrite growth, is the development of analytical and nondestructive techniques that can be applied in situ to functioning batteries. MRI has recently been demonstrated to provide noninvasive imaging methodology that can detect and localize microstructure buildup. However, until now, monitoring dendrite growth by MRI has been limited to observing the relatively insensitive metal nucleus directly, thus restricting the temporal and spatial resolution and requiring special hardware and acquisition modes. Here, we present an alternative approach to detect a broad class of metallic dendrite growth via the dendrites' indirect effects on the surrounding electrolyte, allowing for the application of fast 3D (1)H MRI experiments with high resolution. We use these experiments to reconstruct 3D images of growing Li dendrites from MRI, revealing details about the growth rate and fractal behavior. Radiofrequency and static magnetic field calculations are used alongside the images to quantify the amount of the growing structures.

Keywords: Li-ion batteries; dendrite growth; in situ MRI.


Conflict of interest statement

The authors declare no conflict of interest.

Figures

Fig. 1.
Fig. 1.
In situ 1H 3D FLASH imaging results from the electrochemical cell, with each 3D image acquired in 16 min 40 s. The cell was charged at 50 μA (0.16 mA cm−2) for 72 h before these measurements and then charged at 160 μA (0.51 mA cm−2) for the times specified, with the total charge applied also given in coulombs. (A) Two-dimensional slices from four time points. (B) Segmented images of the results from A, where Ithreshold=0.2Imax. (C) Three-dimensional segmented images of the same time points with an additional Gaussian filter applied to smoothen the visualization.
Fig. 2.
Fig. 2.
Trends in the total MRI image intensity correlated with microstructure volume. The image intensity is converted to volume by assuming volume signal intensity (i.e., concentration is uniform) and then normalizing by the starting volume of the electrolyte as estimated from the image at t=0 (236 mm3). The dendrite volume is estimated by converting the total charge transferred, Q=It (current times time) to the number of moles of lithium, nLi=Q/F, where F is the Faraday constant, and then to a volume, VLi=nLiMrLi/ρLi, using the density of lithium metal, ρLi=0.534gcm3. Numerical errors associated with the experimental image intensity are within the marker size. arb., arbitrary units.
Fig. 3.
Fig. 3.
Results from the susceptibility calculations. (A) Histogram of the B0 field perturbations at every position in the 3D voxel. (B and C) B0 field maps at orthogonal slices through the simulation voxel. B0 is aligned along z as indicated in B; dotted lines on B and C show the slice positions.
Fig. 4.
Fig. 4.
Results from the rf field intensity and phase calculations. (A and D) Log-scale histograms for the amplitude and phase of B1+ across the whole voxel. (B, C, E, and F) Maps of the amplitude (B and C) and phase (E and F) of B1+ in two orthogonal slices through the voxel. B1+ propagates in the x direction as indicated in B.
Fig. 5.
Fig. 5.
Results from the signal intensity and phase calculations. (A and D) Log-scale histograms for the amplitude and phase of the detected signal across the whole voxel. (B, C, E, and F) Maps of the amplitude (B and C) and phase (E and F) of the detected signal in two orthogonal slices through the voxel.
Fig. 6.
Fig. 6.
Analysis of calculated voxel size effects. (A) Calculated signal attenuations for differently sized voxels, given relative to the maximum signal for each cell size. Contributions of different sources of signal attenuation are calculated separately (for B1 alone ωjoff=0 and for susceptibility alone B1,j+=B1,incoming+ for all j, with both conditions used to isolate displacement effects). Black dashed lines illustrate the linear extrapolation of the combined results. (B) Comparison between the calculated and theoretical dendrite volume in the battery throughout the experimental time series. Numerical errors associated with the calculated dendrite volume are within the marker size.
Fig. S1.
Fig. S1.
Comparison of signal decay due to susceptibility differences for objects of different shapes. (A) Relationship between voxel signal intensity and occupation of the voxel for a cylinder oriented at different angles, θ, with respect to the to B0 field. arb., arbitrary units. (B) The average of the cylinder orientations compared with spherical and random lithium geometries and the model dendrite geometry presented in the main text. (C) Calculation of the dendrite volume based on the experimental signal intensities using the results from B for the different shapes (legend from B applies). The theoretical dendrite volume is based on the electrochemistry and assumes that all plated lithium forms dendrites, as described in the legend of Fig. 2.
Fig. 7.
Fig. 7.
Schematics of the electrochemical cell (A) and the model dendrite used for the calculations (B), with the box drawn to illustrate a given MRI voxel position around the dendrite.

References

    1. Tarascon J-M, Armand M. Issues and challenges facing rechargeable lithium batteries. Nature. 2001;414(6861):359–367. - PubMed
    1. Sannier L, et al. Room temperature lithium metal batteries based on a new gel polymer electrolyte membrane. J Power Sources. 2005;144(1):231–237.
    1. Crowther O, West AC. Effect of electrolyte composition on lithium dendrite growth. J Electrochem Soc. 2008;155(11):A806–A811.
    1. Brissot C, Rosso M, Chazalviel J-N, Baudry P, Lascaud S. In situ study of dendritic growth in lithium/PEO-salt/lithium cells. Electrochim Acta. 1998;43(10–11):1569–1574.
    1. Orsini F, et al. In situ scanning electron microscopy (SEM) observation of interfaces within plastic lithium batteries. J Power Sources. 1998;76(1):19–29.

Publication types