

Published Erratum
doi: 10.1073/pnas.1613396113.
Epub 2016 Sep 12.
Correction for Kopp et al., Temperature-driven global sea-level variability in the Common Era
- PMID: 27621454
- PMCID: PMC5035846
- DOI: 10.1073/pnas.1613396113
Item in Clipboard
Published Erratum
Correction for Kopp et al., Temperature-driven global sea-level variability in the Common Era
Proc Natl Acad Sci U S A.
.
No abstract available
Figures
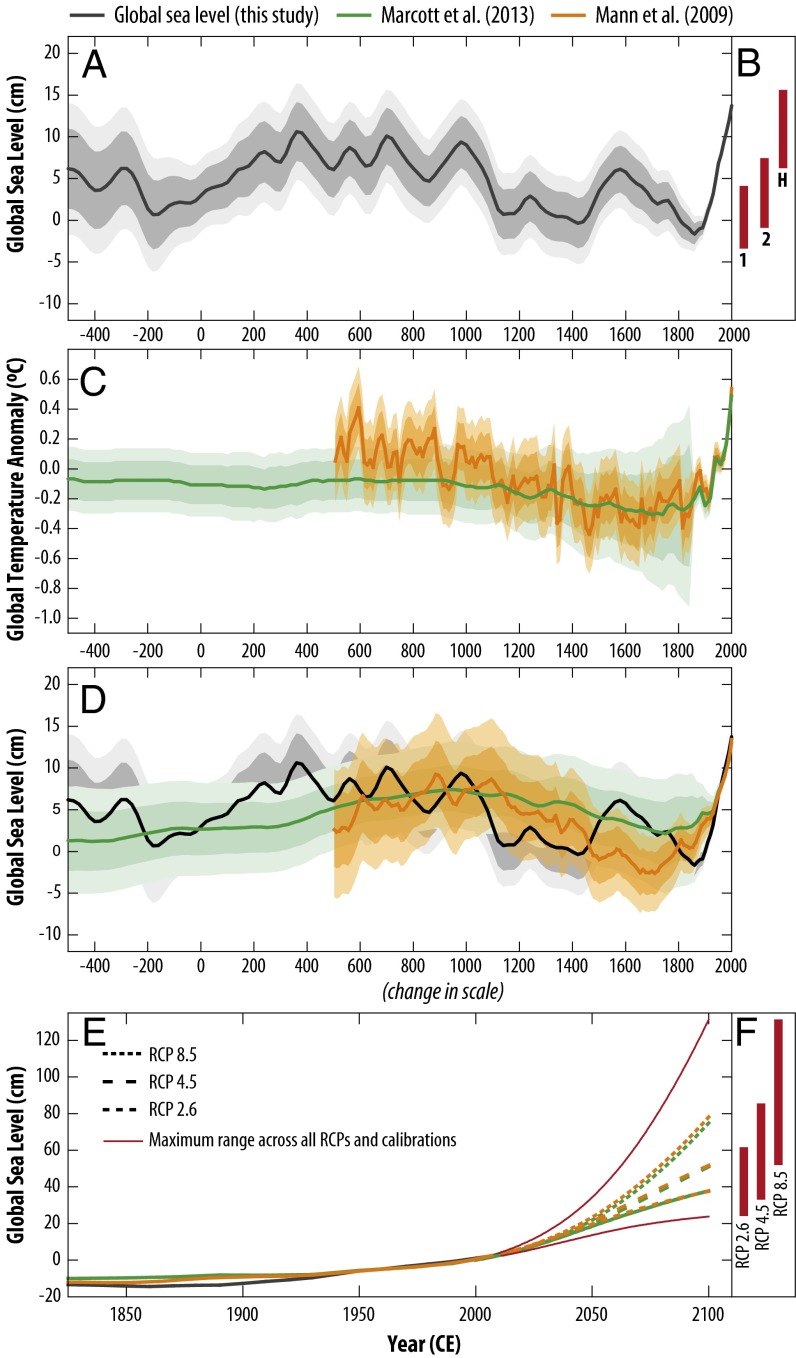
(A) Global sea level (GSL) under prior ML2,1. Note that the model is insensitive to small linear trends in GSL over the Common Era, so the relative heights of the 700–1000 CE and 20th century peaks are not comparable. (B) The 90% credible intervals for semiempirical hindcasts of 20th century sea-level change under historical temperatures (H) and counterfactual scenarios 1 and 2, using both temperature calibrations. (C) Two reconstructions of global mean temperature anomalies relative to the 1850–2000 CE mean (1, 2). (D) Semiempirical fits to the GSL curve using the two alternative temperature reconstructions. (E) As in D, including 21st century projections for RCPs 2.6, 4.5, and 8.5. Red lines show the fifth percentile of RCP 2.6 and 95th percentile of RCP 8.5. (F) The 90% credible intervals for 2100 by RCP. In A, B, and D, values are with respect to 1900 CE baseline; in E and F, values are with respect to 2000 CE baseline. Heavy shading, 67% credible; light shading, 90% credible.
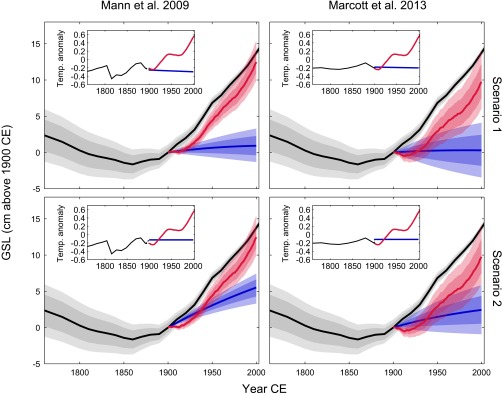
Counterfactual hindcasts of global mean sea-level rise in the absence of anthropogenic warming. Each row assumes a different counterfactual temperature scenario (see Materials and Methods), while each column represents model calibration to a different temperature reconstruction (Inset). In the temperature Insets, the black lines represent the original temperature reconstruction to 1900, the red line represents the HadCRUT4 temperature reconstruction for the 20th century, and the blue line represents the counterfactual scenario. In the main plots, the red and blue curves correspond, respectively, to the HadCRUT4 and counterfactual temperature scenarios. The difference between them can be interpreted as the anthropogenic GSL rise. Heavy shading, 67% credible; light shading, 90% credible.
Erratum for
-
Temperature-driven global sea-level variability in the Common Era.Proc Natl Acad Sci U S A. 2016 Mar 15;113(11):E1434-41. doi: 10.1073/pnas.1517056113. Epub 2016 Feb 22. Proc Natl Acad Sci U S A. 2016. PMID: 26903659 Free PMC article.
Publication types
LinkOut - more resources
Full Text Sources
Other Literature Sources
