. 2016 Aug 12;5(8):e1105430.
doi: 10.1080/2162402X.2015.1105430. eCollection 2016 Aug.

Inflammatory regulatory T cells in the microenvironments of ulcerative colitis and colon carcinoma

Affiliations

Inflammatory regulatory T cells in the microenvironments of ulcerative colitis and colon carcinoma

Ilona Kryczek et al. Oncoimmunology. .

Abstract

Foxp3(+)CD4(+) regulatory T (Treg) cells are thought to express negligible levels of effector cytokines, and inhibit immune responses and inflammation. Here, we have identified a population of IL-8(+)Foxp3(+)CD4(+) T cells in human peripheral blood, which is selectively increased in the microenvironments of ulcerative colitis and colon carcinoma. Phenotypically, this population is minimally overlapping with IL-17(+)Foxp3(+)CD4(+) T cells, and is different from IL-8(-)Foxp3(+)CD4(+) T cells in the same microenvironment. 40-60% of IL-8(+)Foxp3(+)CD4(+) T cells exhibit naive phenotype and express CD127, whereas IL-8(-)Foxp3(+)CD4(+) cells are basically memory T cells and express minimal CD127. The levels of CXCR5 expression are higher in IL-8(+)Foxp3(+) cells than in IL-8(-)Foxp3(+) cells. IL-2 and TGFβ induce IL-8(+)Foxp3(+) T cells. Exogenous Foxp3 expression promotes IL-8(+)Foxp3(+) T cells and inhibits effector cytokine IFNγ and IL-2 expression. Furthermore, Foxp3 binds to IL-8 proximal promoter and increases its activity. Functionally, IL-8(+)Foxp3(+) T cells inhibit T cell proliferation and effector cytokine production, but stimulate inflammatory cytokine production in the colon tissues, and promote neutrophil trafficking through IL-8. Thus, IL-8(+)Foxp3(+) cells may be an "inflammatory" Treg subset, and possess inflammatory and immunosuppressive dual biological activities. Given their dual roles and localization, these cells may be in a unique position to support tumor initiation and development in human chronic inflammatory environment.

Keywords: Colon carcinoma; IL-17; IL-8; Regulatory T cell; Th17; neutrophil; tumor immunity; ulcerative colitis.


Figures

Figure 1.
Figure 1.
IL-8+Foxp3+ T cells in the environments of colitis and colon carcinoma. (A–C). IL-8+Foxp3+ T cells in the environments of chronic inflammation and cancers. Single cell suspensions were made from fresh blood, colitic tissues, tumors, and adjacent tissues. The cells were subject to membrane and intracellular staining and analyzed by FACS. Results were expressed as the percent of each population in CD4+ T cells (A) or in CD4+Foxp3+ T cells (B, C). (A). Gated on CD4+CD3+ T cells. (B, C). Gated on Foxp3+CD4+CD3+ T cells. Blood: n = 10. Ulcerative colitis (UC): n = 8. Colon cancer (ca): n = 9. Ovarian cancer (ca): n = 25. (*p < 0.001, compared to blood and ovarian cancer). (D). IL-8+ cells in colitic tissues. Colon colitic tissues were stained with anti-human IL-8 (green), anti-human CD3 (white), anti-human-Foxp3 (red), and control antibody as described in “Materials and methods”, and analyzed with fluorescence microscope. One of eight representative samples is shown. 40X magnification. (E). Colon cancer-associated Treg cells release high levels of IL-8. Mononuclear cells were isolated from colon mucosa in patients with colon cancer. CD25-depleted mononuclear cells (CD25) and CD25+ mononuclear cells (CD25+) were cultured with or without anti-CD3 and anti-CD28 for 40 h. IL-8 was detected in the supernatants. Results were expressed as the mean values ± SEM. n = 5. *p < 0.001, compared to CD25 cells. (F). Colitic, but not blood Treg cells release high levels of IL-8. Treg cells were sorted from colon mucosa mononuclear cells and peripheral blood mononuclear cells. The cells were activated with anti-CD3 and anti-CD28 beads (1:8) for 40 h. IL-8 was detected in the supernatants. Results were expressed as the mean values ± SEM. n = 6. *p < 0.001, compared to blood Treg cells.
Figure 2.
Figure 2.
Phenotype and cytokine profile of IL-8+Foxp3+ T cells. Single cell suspensions were made from fresh blood or ulcerative colitic tissues. The cells were subjected to membrane and intracellular staining and analyzed by FACS. (A–C). IL-8+Foxp3+ T cells are in the naïve and memory Treg subset. The expression of CD45RA (A), CD127 (B), and CXCR5 (C), is shown in CD4+Foxp3+ T cells. One of six experiments is shown. (D, E). Effector cytokines in IL-8+ Treg cells. The expression of IFNγ (D), IL-8, and IL-17 (E) was determined by intracellular staining in IL-8+ Treg cells. Results were expressed as the percentage of cytokine expressing cells in Treg cells. Gated on CD4+Foxp3+ cells (A–C). One of eight is shown. (F). IL-8 and IL-17 transcripts in naïve and memory Treg cells. Naïve CD45RA+ and memory CD45RA Treg cells were sorted. The expression of IL-8 and IL-17 was determined by real time PCR in the sorted Treg subsets. Results were expressed as the mean relative values ± SEM. n = 5, p < 0.05.
Figure 3.
Figure 3.
Cancer and colitic Treg cells and IL-8+Foxp3+ T cells are immune suppressive. (A, B). Enrichment and sorting of Foxp3+ T cells. (A). Magnetic bead-enriched CD4+CD25 and CD4+CD25+ T cells. CD4+CD25+ and CD4+CD25 T cells were enriched with CD25 magnetic beads. The enriched CD4+CD25+ T cells contained CD25low and Foxp3+/− cells. (B). Sorted CD4+CD25bright and CD4+CD25 T cells. The CD25 and CD25bright cells were sorted from the enriched CD4+CD25 cells and CD4+CD25+ cells to high purity. The Foxp3 expression was determined by intracellular staining by sampling a small aliquot from the sorted cells. If the levels of Foxp3 were more than 95% in the sorted CD25bright cells and less than 0.5% in sorted CD25 cells, the cells were used for the immune suppressive assay and other functional experiments. (C–E). Primary Foxp3+ T cells are equally immune suppressive regardless of the sources and the levels of IL-8 expression. Treg cells were sorted from blood and colon tissues. T cell suppressive assay was performed in the presence or absence of different concentrations of Treg cells as we described. T cell activation was determined by the percentage of suppression (C), thymidine incorporation (cpm) (D), and T cell IFNγ expression (E). (*Wilcoxon signed-rank test, n = 6, *p < 0.05 compared to no Treg cells or control groups). The suppressed IFNγ expression was shown when Treg/T ratio was 1:1. (F). Inhibitory activity of IL-8+Foxp3+ T cell clones. IL-8+Foxp3, IL-8Foxp3+, and IL-8+Foxp3+ T cell clones were generated from peripheral blood cells in two donors. Suppressive assays were conducted in triplicates with normal responder T cells from three donors. Results were expressed as the mean values of CPM ± SEM. (*Wilcoxon signed-rank test, p < 0.05, compared to control). The ratio between T cell clones/responder T cells was 1:2.
Figure 4.
Figure 4.
IL-8+ Treg cells are functionally inflammatory. (A, B). Treg cells induced IL-1 and IL-6 production by normal colon epithelial cells through IL-8. Primary normal colon epithelial cells were cultured with colitic Treg-derived supernatants for 40 h in the presence or absence of anti-IL-8 antibody. IL-1β (A) and IL-6 (B) were detected in the culture supernatants by ELISA. Results were expressed as the mean values of ± SEM (n = 5, p < 0.05, compared to medium controls or anti-IL-8). (C). Treg cells mediated neutrophil migration. Neutrophils were allowed to migrate toward Treg supernatants (A, B). Anti-IL-8 antibody was added 2 h before migration assay. Results are expressed as the mean values ± SEM (n = 5, p < 0.05). Ulcerative colitis, UC.
Figure 5.
Figure 5.
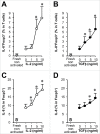
Induction of IL-8+Foxp3+ T cells. IL-2 and TGFβ induced IL-8+Foxp3+ T cells. Normal blood CD4+ T cells were stimulated with anti-CD3 and anti-CD28 in the presence of IL-2 (A, C) and TGFβ (B, D) for 3 d. The fresh and stimulated T cells were analyzed by FACS. Results were expressed as the percent of IL-8+Foxp3+ T cells in CD4+ T cells (A, B) or in Foxp3+ T cells (C, D). n = 5. *p < 0.05, compared to medium or fresh cells.
Figure 6.
Figure 6.
Foxp3 regulates the development of IL-8+ Treg cells. (A, B). Ectopic Foxp3 expression promotes IL-8 expression and suppresses effector cytokine expression. CD4+CD25 T cells were transfected with Foxp3 expressing lentiviral vector and control vector, and were stimulated with anti-CD3 and anti-CD28 for 3 d. The stimulated T cells were analyzed by FACS. Results were expressed as the percent of IL-8+Foxp3+ T cells in CD4+ T cells (A) or the percent of cytokine-expressing T cells in CD4+ T cells (B). n = 3 donors. p < 0.01 as compared to controls (scramble). Solid bars, lentiviral vector; Empty bars, control vector. (C). Foxp3 directly binds the IL-8 proximal promoter area. ChIP analysis was performed in Foxp3+ Treg cells and general T cells. Anti-human Foxp3, anti-human AcH3 (positive control), and IgG (negative control) were used. Results were shown that Foxp3 occupied at −4200 bp region of the predicted region of IL8 promoter in Treg cells. One of four experiments is shown. (D). Foxp3 increases IL-8 promoter Luciferase activity. Luciferase assay was carried out in Jurkat cells. Foxp3 or pcDNA3 vector control was expressed with IL-8-luc reporter and Renilla-pLTK-luc. Results were expressed as the mean values of relative luciferase activity ± SD from three individual experiments with duplication (*p < 0.01, compared to control). (E). IL-8 and Foxp3 expression in Treg cells. Colitic T cells were stained for CD3, CD4+, Foxp3, and IL-8, and analyzed by FACS. The levels of Foxp3 expression were positively associated with that of IL-8. One of four experiments is shown.

References

    1. Luster AD. The role of chemokines in linking innate and adaptive immunity. Curr Opin Immunol 2002; 14:129-35; PMID:11790543; http://dx.doi.org/10.1016/S0952-7915(01)00308-9 - DOI - PubMed
    1. Wood KJ, Sakaguchi S. Regulatory Lymphocytes: Regulatory T cells in transplantation tolerance. Nat Rev Immunol 2003; 3:199-210; PMID:12658268; http://dx.doi.org/10.1038/nri1027 - DOI - PubMed
    1. Von Herrath MG, Harrison LC. Regulatory Lymphocytes: Antigen-induced regulatory T cells in autoimmunity. Nat Rev Immunol 2003; 3:223-32; PMID:12658270; http://dx.doi.org/10.1038/nri1029 - DOI - PubMed
    1. Shevach EM. CD4+ CD25+ suppressor T cells: more questions than answers. Nat Rev Immunol 2002; 2:389-400; PMID:12093005 - PubMed
    1. Francois Bach J. Regulatory lymphocytes: Regulatory T cells under scrutiny. Nat Rev Immunol 2003; 3:189-98; PMID:12658267; http://dx.doi.org/10.1038/nri1026 - DOI - PubMed

Publication types

LinkOut - more resources