. 2016 Aug 3;5(8):e1192739.
doi: 10.1080/2162402X.2016.1192739. eCollection 2016 Aug.

Human CD1c(+) DCs are critical cellular mediators of immune responses induced by immunogenic cell death

Affiliations

Human CD1c(+) DCs are critical cellular mediators of immune responses induced by immunogenic cell death

Stefania Di Blasio et al. Oncoimmunology. .

Abstract

Chemotherapeutics, including the platinum compounds oxaliplatin (OXP) and cisplatin (CDDP), are standard care of treatment for cancer. Although chemotherapy has long been considered immunosuppressive, evidence now suggests that certain cytotoxic agents can efficiently stimulate antitumor responses, through the induction of a form of apoptosis, called immunogenic cell death (ICD). ICD is characterized by exposure of calreticulin and heat shock proteins (HSPs), secretion of ATP and release of high-mobility group box 1 (HMGB1). Proper activation of the immune system relies on the integration of these signals by dendritic cells (DCs). Studies on the crucial role of DCs, in the context of ICD, have been performed using mouse models or human in vitro-generated monocyte-derived DCs (moDCs), which do not fully recapitulate the in vivo situation. Here, we explore the effect of platinum-induced ICD on phenotype and function of human blood circulating DCs. Tumor cells were treated with OXP or CDDP and induction of ICD was investigated. We show that both platinum drugs triggered translocation of calreticulin and HSP70, as well as the release of ATP and HMGB1. Platinum treatment increased phagocytosis of tumor fragments by human blood DCs and enhanced phenotypic maturation of blood myeloid and plasmacytoid DCs. Moreover, upon interaction with platinum-treated tumor cells, CD1c(+) DCs efficiently stimulated allogeneic proliferation of T lymphocytes. Together, our observations indicate that platinum-treated tumor cells may exert an active stimulatory effect on human blood DCs. In particular, these data suggest that CD1c(+) DCs are critical mediators of immune responses induced by ICD.

Keywords: CD1c+ DCs; T cell proliferation; human dendritic cells; immune response; immunogenic cell death; platinum chemotherapy.


Figures
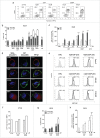
Figure 1.
Figure 1.
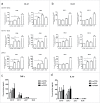
Sensitivity of tumor cell lines to platinum drugs and platinum-mediated exposure of ecto-CRT. (A, B) Frequency of apoptotic (Annexin V+ DAPI) and secondary necrotic (Annexin V+ DAPI+) BLM cells after treatment with OXP or CDDP. Human melanoma BLM cells were cultured with platinum drugs or left untreated, for 24 or 48 h. Cells were stained with Annexin-V-FITC and DAPI and analyzed by flow cytometry. Data are presented as representative contour plot (A) or mean±SEM (at least n = 2, performed in duplicates) (B). (C, E, F) CRT exposure was assessed on Annexin V+ DAPI cells after treatment with OXP or CDDP by flow cytometry. BLM cells were treated as described above. Data are relative mean±SEM (at least n = 3, in duplicates) (C). Representative histograms show CRT expression (MFI) on human colon (Caco-2) and testicular (833KE and 2102EP) cancer cell lines following 24 h of treatment with OXP or CDDP. Caco-2 were treated with 15 µM of OXP or CDDP; 833KE and 2102EP were treated with 6.3 µM OXP or 8.3 µM CDDP. Isotype (gray line), control (gray filled histogram), treatment (black thick line) (E). Exposure of CRT on murine colon cancer CT26 cells was assessed after 24 h of treatment with 15 µM of OXP or CDDP. Data are means of duplicates of one representative experiment (F). (D) CRT expression was confirmed by confocal microscopy. BLM cells were stained with an anti-CRT antibody and the membrane marker, wheat germ agglutinin (WGA). Scale bar 10 μm. (G, H) Frequency of apoptotic vs. necrotic cells (F) and CRT exposure (G) on BLM cells, after short-term (8 h) drug exposure to OXP or CDDP, at indicated doses. Results are mean±SEM (n = 3 in duplicates). Significance was determined with One-way ANOVA, *p < 0.05, ***p < 0.001, as compared to control (CTRL) cells.
Figure 2.
Figure 2.
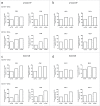
Platinum drugs induce release of immunogenic signals for DCs stimulation. (A, B, C) Surface expression of Hsp70 on BLM (A), 2102EP (B), and CT26 (C) cells, after platinum treatment, was assessed on Annexin V+ DAPI cells by flow cytometry. Cells were cultured with OXP or CDDP at indicated doses, for 24 (2102EP and CT26) or 48 h (BLM). Data are presented as mean (n = 2) (D, E, F). Extracellular ATP was measured by luciferase assay, in supernatants of cells cultured as described above. Results represent relative means±SEM (at least n = 2, done in duplicates). (G, H, I) Elisa detection of HMGB1 release in supernatant of cells cultured as described above. Data are means±SEM (at least n = 2). Significance was determined with One-way ANOVA, *p < 0.05, **p < 0.01, ***p < 0.001, as compared to control (CTRL) cells.
Figure 3.
Figure 3.
Platinum-treatment increases phagocytosis of tumor cells by human DC subsets. (A, B) BLM-GFP cells were treated with 15 µM OXP or CDDP for 48 h and co-cultured with CD1c+ DCs (pre-labeled with PKH26) for 3 h. Representative confocal image (A) and quantification (B) of BLM-DC interactions. A total of five images per sample were taken and the number of interactions was normalized over the number of DC and BLM cells present in the image. Data represent mean±SEM of one representative experiment. (C) Percentage of uptake (48 h co-culture, 37°C, gray bar) of 15 µM OXP or CDDP treated-BLM cells by CD1c+ DCs versus binding (4°C, white bar). Values are relative to binding of control (CTRL) BLM cells and show mean (n = 2). (D) Representative contour plot of control (CTRL) or platinum treated-BLM cells uptake by CD1c+ DCs upon 24 or 48 h of co-culture. (E, F) Percentage of phagocytosis of BLM (E), 833 KE, 2102 EP, Caco2 (F) human tumor cell lines by different DC subsets (CD16+, CD1c+, and pDCs). BLM and Caco-2 were treated with 15 µM of OXP or CDDP for 48 h; 833KE and 2102EP were treated with 6.3 µM OXP or 8.3 µM CDDP for 24 h. CTRL (white bar) or treated tumor cells (gray or black bars) were co-cultured with DCs for 48 h and extend of uptake was assessed by flow cytometry. The graph shows the mean±SEM (at least n = 2, in duplicate). Significance was determined by Two-way ANOVA, **p < 0.01, ***p < 0.001, as compared to CTRL cells.
Figure 4.
Figure 4.
Human DCs take up platinum-treated tumor cells in a CRT-dependent manner. (A) Percentage of uptake of 15 µM OXP or CDDP treated-BLM cells by CD1c+ DCs. Control or treated tumor cells were co-cultured with DCs in the presence of isotype (white bar), CRT blocking peptide (gray bar) or irrelevant tumor antigen (gp100) peptide (black bar) for 2 h. Extent of uptake was assessed by flow cytometry. Data show means of duplicates of one representative experiment. (B) Representative histograms showing CD91 expression on human monocytes (CD14+) and DCs (CD16+, CD1c+, and pDCs). Isotype (gray filled histogram), anti-CD91 (black thick line). (C) Heatmap of relative mRNA expression levels of genes in human DC subsets. Heatmap shows the normalized expression of genes (Z-scores) in CD16+, CD1c+, and pDCs. Data are represented from three healthy donors. (D) Representative contour plot of CTRL or CDDP (15 µM, 48 h) treated-BLM cells uptake by CD1c+ DCs upon functional blocking of CD91 on DCs. BLM cells and DCs were co-cultured overnight in the presence of isotype control or CD91-blocking antibody. Percentage of phagocytosis was assessed by flow cytometry.
Figure 5.
Figure 5.
Phagocytosis of platinum-treated BLM cells induces maturation of human DC subsets. (A, B) The expression of maturation markers on DC subsets (CD16+, CD1c+, and pDCs) following 48 h of co-culture with control or platinum treated BLM cells. DC stimulated with TLR ligands (4 µg/mL R848 for pDCs and 2 µg/mL poli(I:C) for CD16+ and CD1c+) were used as positive controls. The expression levels were determined by flow cytometry and depicted as GeoMFI values, relative to those of the co-culture with control tumor cells (coCTRL). The graphs show the mean±SEM (n = 7). Significance was determined by One-way ANOVA, *p < .05, **p < 0.01, ***p < 0.001. (C, D) TNF-α and IL-10 production was analyzed in supernatants of overnight co-cultured pretreated-BLM and DCs by a multiplex FlowCytomix kit. Data are mean±SEM (n = 5). Significance was determined by 2-tailed t-test, *p < .05.
Figure 6.
Figure 6.
Phagocytosis of platinum-treated testicular cancer cells induces maturation of human DC subsets. The expression of maturation markers on DC subsets (CD16+, CD1c+, and pDCs) following 48 h of co-culture with control or platinum treated 2102EP (A, B) or 833KE (C, D) cells. The expression levels were determined by flow cytometry and depicted as GeoMFI values, relative to those of the co-culture with control tumor cells (coCTRL). The graphs show the mean (n = 2).
Figure 7.
Figure 7.
Human CD1c+ DCs mediate T cell activation against chemotherapy treated-tumor cells. The ability of CD16+, CD1c+, and pDCs to induce T cell proliferation upon co-culture with control (white), OXP (gray), or CDDP (black) treated-tumor cells was determined in a mixed lymphocyte reaction. FACS sorted DCs were co-cultured with allogeneic CFSE-labeled peripheral blood lymphocytes (PBLs) for 5 d. (A) PBL proliferation was measured as the percentage of CD3+ cells showing CFSE dilution and expressed relative to CD3+ cells cultured in medium. (B) Percentage of proliferated CD3+ cells. Data are mean±SEM of at least triplicates of n = 3 (BLM) or one representative (833KE and 2102EP) experiments. Significance was determined by Two-way ANOVA, **p < 0.01.

References

    1. Chabner BA, Roberts TG. Chemotherapy and the war on cancer. Nat Rev Cancer 2005; 5:65-72; PMID:15630416; http://dx.doi.org/ 10.1038/nrc1529 - DOI - PubMed
    1. Zitvogel L, Apetoh L, Ghiringhelli F, Kroemer G. Immunological aspects of cancer chemotherapy. Nat Rev Immunol 2008; 8:59-73; PMID:18097448; http://dx.doi.org/ 10.1038/nri2216 - DOI - PubMed
    1. Lesterhuis WJ, Haanen JBAG, Punt CJA. Cancer immunotherapy – revisited. Nat Rev Drug Discov 2011; 10:591-600; PMID:21804596; http://dx.doi.org/ 10.1038/nrd3500 - DOI - PubMed
    1. Hato SV, Khong A, de Vries IJM, Lesterhuis WJ. Molecular Pathways: The Immunogenic Effects of Platinum-Based Chemotherapeutics. Clin Cancer Res 2014; 20:2831-7; PMID:24879823; http://dx.doi.org/ 10.1158/1078-0432.CCR-13-3141 - DOI - PubMed
    1. Tesniere A, Schlemmer F, Boige V, Kepp O, Martins I, Ghiringhelli F, Aymeric L, Michaud M, Apetoh L, Barault L et al.. Immunogenic death of colon cancer cells treated with oxaliplatin. Oncogene 2009; 29:482-91; PMID:19881547; http://dx.doi.org/ 10.1038/onc.2009.356 - DOI - PubMed

Publication types

LinkOut - more resources