TARP vaccination is associated with slowing in PSA velocity and decreasing tumor growth rates in patients with Stage D0 prostate cancer
- PMID: 27622067
- PMCID: PMC5007958
- DOI: 10.1080/2162402X.2016.1197459
TARP vaccination is associated with slowing in PSA velocity and decreasing tumor growth rates in patients with Stage D0 prostate cancer
Abstract
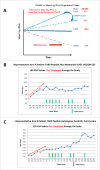
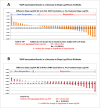
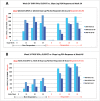
T-cell receptor alternate reading frame protein (TARP) is a 58-residue protein over-expressed in prostate and breast cancer. We investigated TARP peptide vaccination's impact on the rise in PSA (expressed as Slope Log(PSA) or PSA Doubling Time (PSADT)), validated tumor growth measures, and tumor growth rate in men with Stage D0 prostate cancer. HLA-A*0201 positive men were randomized to receive epitope-enhanced (29-37-9V) and wild-type (27-35) TARP peptides administered as a Montanide/GM-CSF peptide emulsion or as an autologous peptide-pulsed dendritic cell vaccine every 3 weeks for a total of five vaccinations with an optional 6th dose of vaccine at 36 weeks based on immune response or PSADT criteria with a booster dose of vaccine for all patients at 48 and 96 weeks. 41 patients enrolled with median on-study duration of 75 weeks at the time of this analysis. Seventy-two percent of patients reaching 24 weeks and 74% reaching 48 weeks had a decreased Slope Log(PSA) compared to their pre-vaccination baseline (p = 0.0012 and p = 0.0004 for comparison of overall changes in Slope Log(PSA), respectively). TARP vaccination also resulted in a 50% decrease in median tumor growth rate (g): pre-vaccine g = 0.0042/day, post-vaccine g = 0.0021/day (p = 0.003). 80% of subjects exhibited new vaccine-induced TARP-specific IFNγ ELISPOT responses but they did not correlate with decreases in Slope Log(PSA). Thus, vaccination with TARP peptides resulted in significant slowing in PSA velocity and reduction in tumor growth rate in a majority of patients with PSA biochemical recurrence.
Keywords: PSA biochemical recurrence; Prostate cancer; TARP; therapeutic cancer vaccine.
Figures


References
-
- American Cancer Society. Cancer Facts & Figures 2014 . Atlanta: American Cancer Society; 2014. p.2, p.10; http://www.cancer.org/research/cancerfactsstatistics/cancerfactsfigures2....
-
- Epstein JI, Allsbrook WC Jr, Amin MB, Egevad LL, Committee IG. 2005 International Society of Urological Pathology (ISUP) Consensus conference on gleason grading of prostatic carcinoma. Am J Surg Pathol 2005; 29:1228-42; PMID:16096414; http://dx.doi.org/10.1097/01.pas.0000173646.99337.b1 - DOI - PubMed
-
- Heidenreich A, Bellmunt J, Bolla M, Joniau S, Mason M, Matveev V, Mottet N, Schmid HP, van der Kwast T, Wiegel T et al.. EAU guidelines on prostate cancer. Part 1: screening, diagnosis, and treatment of clinically localized disease. Eur Urol 2011; 59:61-71; PMID:21056534; http://dx.doi.org/10.1016/j.eururo.2010.10.039 - DOI - PubMed
-
- Essand M, Vasmatzis G, Brinkmann U, Duray P, Lee B, Pastan I. High expression of a specific T-cell receptor gamma transcript in epithelial cells of the prostate. Proc Natl Acad Sci U S A 1999; 96:9287-92; PMID:10430935; http://dx.doi.org/10.1073/pnas.96.16.9287 - DOI - PMC - PubMed
-
- Wolfgang CD, Essand M, Vincent JJ, Lee B, Pastan I. TARP: a nuclear protein expressed in prostate and breast cancer cells derived from an alternate reading frame of the T cell receptor gamma chain locus. Proc Natl Acad Sci U S A 2000; 97:9437-42; PMID:10931945; http://dx.doi.org/10.1073/pnas.160270597 - DOI - PMC - PubMed
Publication types
LinkOut - more resources
Full Text Sources
Other Literature Sources
Molecular Biology Databases
Research Materials
Miscellaneous
