

Cross-Country Individual Participant Analysis of 4.1 Million Singleton Births in 5 Countries with Very High Human Development Index Confirms Known Associations but Provides No Biologic Explanation for 2/3 of All Preterm Births
- PMID: 27622562
- PMCID: PMC5021369
- DOI: 10.1371/journal.pone.0162506
Cross-Country Individual Participant Analysis of 4.1 Million Singleton Births in 5 Countries with Very High Human Development Index Confirms Known Associations but Provides No Biologic Explanation for 2/3 of All Preterm Births
Abstract
Background: Preterm birth is the most common single cause of perinatal and infant mortality, affecting 15 million infants worldwide each year with global rates increasing. Understanding of risk factors remains poor, and preventive interventions have only limited benefit. Large differences exist in preterm birth rates across high income countries. We hypothesized that understanding the basis for these wide variations could lead to interventions that reduce preterm birth incidence in countries with high rates. We thus sought to assess the contributions of known risk factors for both spontaneous and provider-initiated preterm birth in selected high income countries, estimating also the potential impact of successful interventions due to advances in research, policy and public health, or clinical practice.
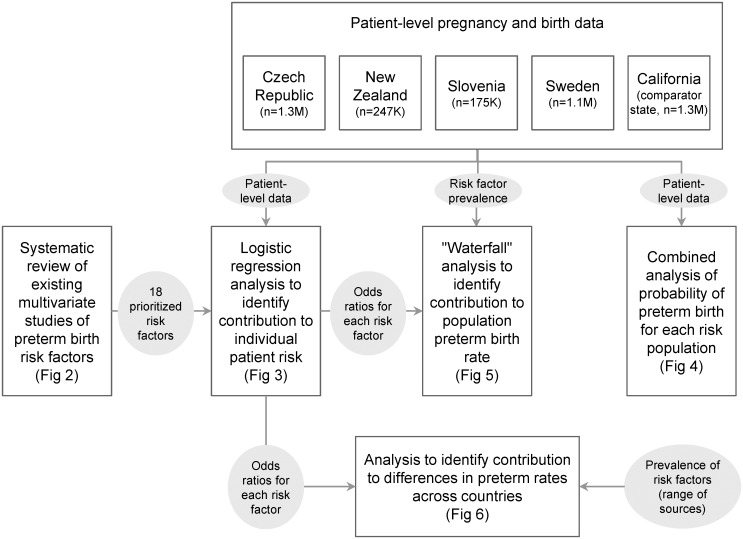
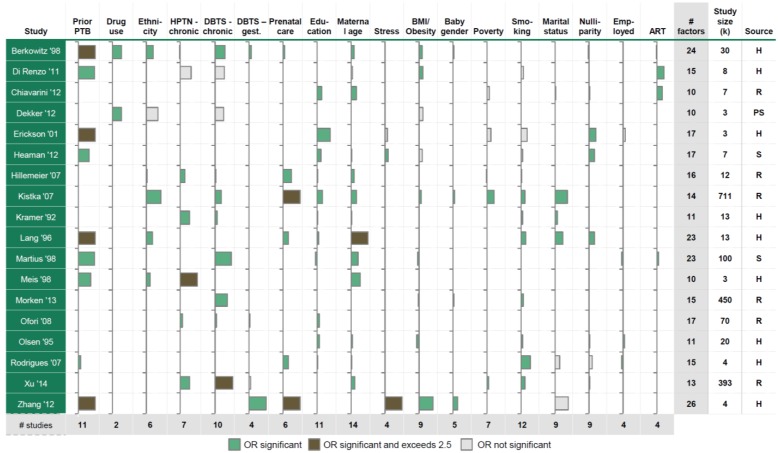
Methods: We analyzed individual patient-level data on 4.1 million singleton pregnancies from four countries with very high human development index (Czech Republic, New Zealand, Slovenia, Sweden) and one comparator U.S. state (California) to determine the specific contribution (adjusting for confounding effects) of 21 factors. Both individual and population-attributable preterm birth risks were determined, as were contributors to cross-country differences. We also assessed the ability to predict preterm birth given various sets of known risk factors.
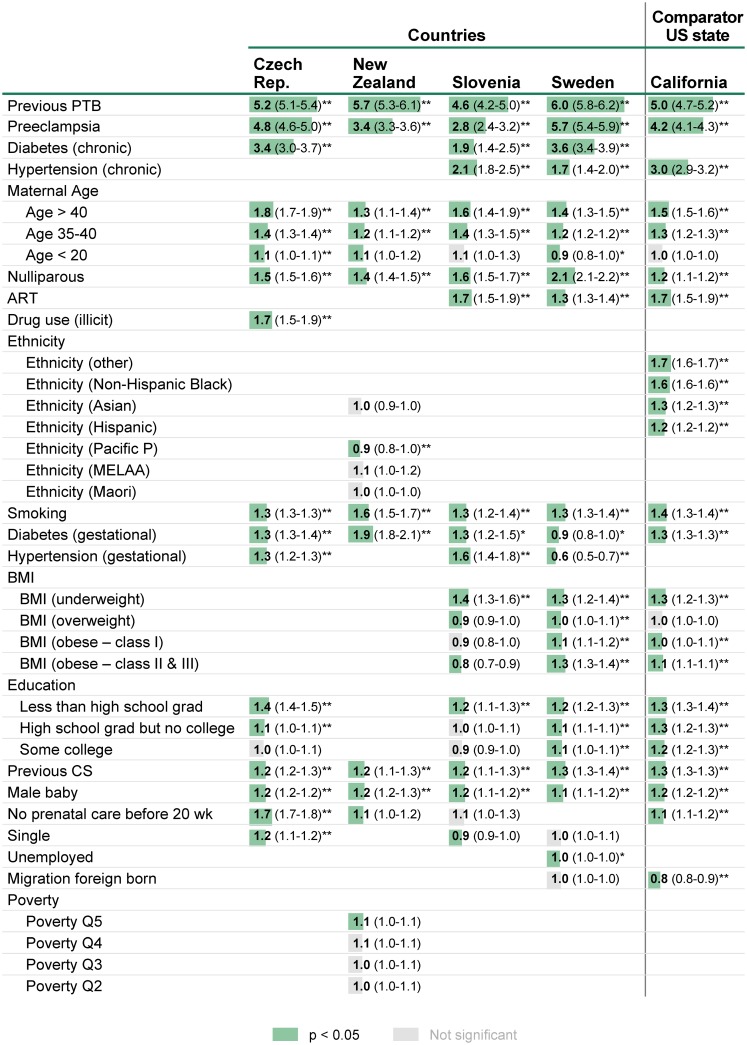
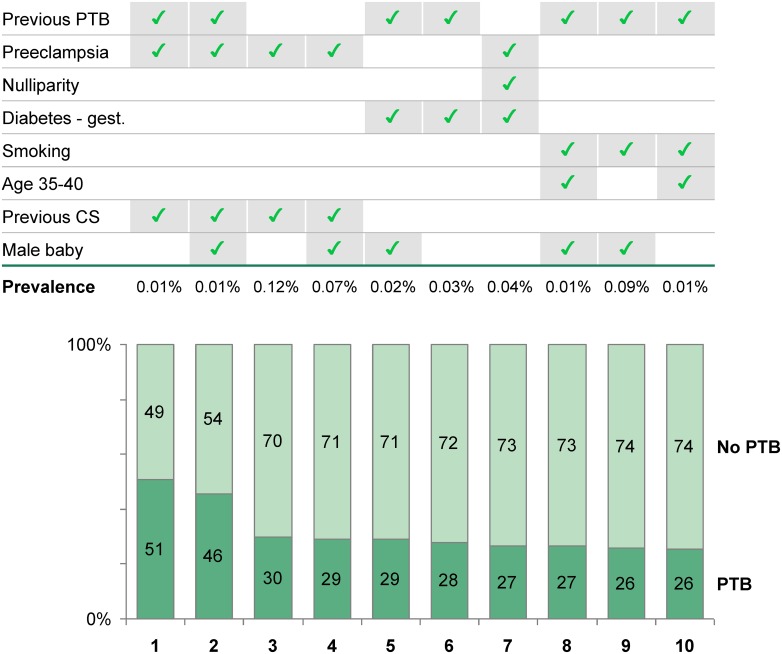
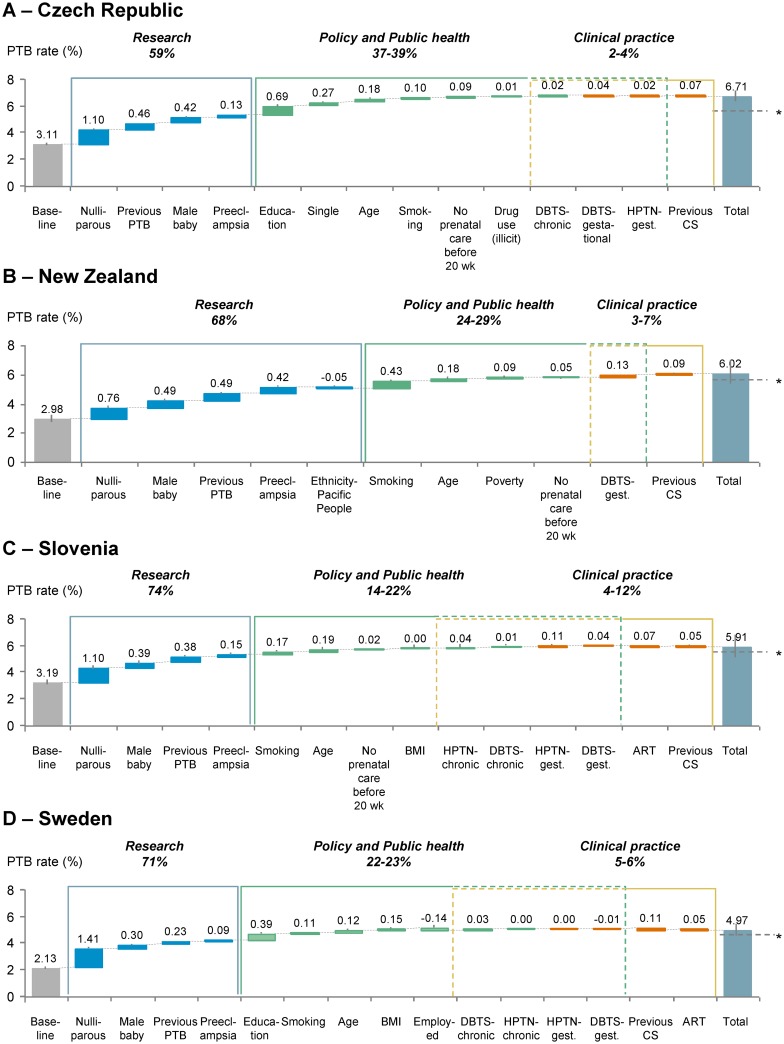
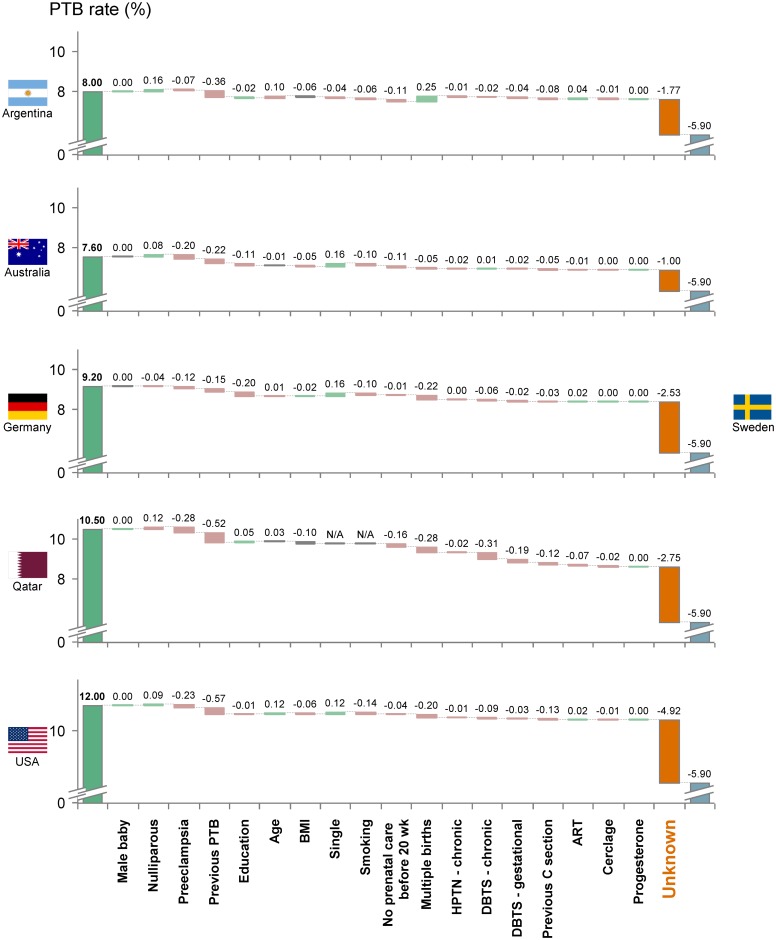
Findings: Previous preterm birth and preeclampsia were the strongest individual risk factors of preterm birth in all datasets, with odds ratios of 4.6-6.0 and 2.8-5.7, respectively, for individual women having those characteristics. In contrast, on a population basis, nulliparity and male sex were the two risk factors with the highest impact on preterm birth rates, accounting for 25-50% and 11-16% of excess population attributable risk, respectively (p<0.001). The importance of nulliparity and male sex on population attributable risk was driven by high prevalence despite low odds ratios for individual women. More than 65% of the total aggregated risk of preterm birth within each country lacks a plausible biologic explanation, and 63% of difference between countries cannot be explained with known factors; thus, research is necessary to elucidate the underlying mechanisms of preterm birth and, hence, therapeutic intervention. Surprisingly, variation in prevalence of known risk factors accounted for less than 35% of the difference in preterm birth rates between countries. Known risk factors had an area under the curve of less than 0.7 in ROC analysis of preterm birth prediction within countries. These data suggest that other influences, as yet unidentified, are involved in preterm birth. Further research into biological mechanisms is warranted.
Conclusions: We have quantified the causes of variation in preterm birth rates among countries with very high human development index. The paucity of explicit and currently identified factors amenable to intervention illustrates the limited impact of changes possible through current clinical practice and policy interventions. Our research highlights the urgent need for research into underlying biological causes of preterm birth, which alone are likely to lead to innovative and efficacious interventions.
Conflict of interest statement
The Boston Consulting Group (BCG) consults with large nonprofit organizations on global health issues. Authors from BCG (DMF, JL, SCS) were employed under contract with the March of Dimes Foundation and FIGO. This does not alter our adherence to PLOS ONE policies on sharing data and materials.
Figures
Similar articles
-
In Pursuit of Progress Toward Effective Preterm Birth Reduction.Obstet Gynecol. 2017 Apr;129(4):715-719. doi: 10.1097/AOG.0000000000001923. Obstet Gynecol. 2017. PMID: 28277357
-
Assisted reproductive technology surveillance--United States, 2011.MMWR Surveill Summ. 2014 Nov 21;63(10):1-28. MMWR Surveill Summ. 2014. PMID: 25412164
-
Preventing preterm births: analysis of trends and potential reductions with interventions in 39 countries with very high human development index.Lancet. 2013 Jan 19;381(9862):223-34. doi: 10.1016/S0140-6736(12)61856-X. Epub 2012 Nov 16. Lancet. 2013. PMID: 23158883 Free PMC article.
-
Epidemiology of late preterm and early term births - An international perspective.Semin Fetal Neonatal Med. 2019 Feb;24(1):3-10. doi: 10.1016/j.siny.2018.09.001. Epub 2018 Sep 18. Semin Fetal Neonatal Med. 2019. PMID: 30309813 Review.
-
Preventing preterm birth and neonatal mortality: exploring the epidemiology, causes, and interventions.Semin Perinatol. 2010 Dec;34(6):408-15. doi: 10.1053/j.semperi.2010.09.005. Semin Perinatol. 2010. PMID: 21094415 Review.
Cited by
-
Preterm Birth: Screening and Prediction.Int J Womens Health. 2023 Dec 21;15:1981-1997. doi: 10.2147/IJWH.S436624. eCollection 2023. Int J Womens Health. 2023. PMID: 38146587 Free PMC article. Review.
-
Polybrominated diphenyl ethers in early pregnancy and preterm birth: Findings from the NICHD Fetal Growth Studies.Int J Hyg Environ Health. 2022 Jun;243:113978. doi: 10.1016/j.ijheh.2022.113978. Epub 2022 May 12. Int J Hyg Environ Health. 2022. PMID: 35569252 Free PMC article.
-
Potential differences in occurrence of preterm births according to quality of relationship between mothers and fathers of the children.Cent Eur J Public Health. 2022 Jun;30(Supplement):S63-S67. doi: 10.21101/cejph.a7242. Cent Eur J Public Health. 2022. PMID: 35841228
-
Polycystic ovary syndrome and extremely preterm birth: A nationwide register-based study.PLoS One. 2021 Feb 4;16(2):e0246743. doi: 10.1371/journal.pone.0246743. eCollection 2021. PLoS One. 2021. PMID: 33539479 Free PMC article.
-
Association of Prepregnancy Risk Factors With Racial Differences in Preterm Birth Rates.Am J Prev Med. 2023 Dec;65(6):1184-1186. doi: 10.1016/j.amepre.2023.07.007. Epub 2023 Aug 6. Am J Prev Med. 2023. PMID: 37552145 Free PMC article. No abstract available.
References
-
- March of Dimes P, Save the Children, WHO. Born too soon: the global action report on preterm birth. 2012.
-
- Blencowe H, Cousens S, Oestergaard MZ, Chou D, Moller A-B, Narwal R, et al. National, regional, and worldwide estimates of preterm birth rates in the year 2010 with time trends since 1990 for selected countries: a systematic analysis and implications. The Lancet. 2012;379(9832):2162–72. - PubMed
-
- Liu L, Oza S, Hogan D, Perin J, Rudan I, Lawn JE, et al. Global, regional, and national causes of child mortality in 2000–13, with projections to inform post-2015 priorities: an updated systematic analysis. The Lancet. 2015;385(9966):430–40. - PubMed
-
- In: Behrman RE, Butler AS, editors. Preterm Birth: Causes, Consequences, and Prevention The National Academies Collection: Reports funded by National Institutes of Health. Washington (DC)2007. - PubMed
-
- Chang HH, Larson J, Blencowe H, Spong CY, Howson CP, Cairns-Smith S, et al. Preventing preterm births: analysis of trends and potential reductions with interventions in 39 countries with very high human development index. Lancet. 2013;381(9862):223–34. 10.1016/S0140-6736(12)61856-X - DOI - PMC - PubMed
Publication types
MeSH terms
LinkOut - more resources
Full Text Sources
Other Literature Sources
