

Selective Internal Radiation Therapy With Yttrium-90 Glass Microspheres: Biases and Uncertainties in Absorbed Dose Calculations Between Clinical Dosimetry Models
- PMID: 27623307
- PMCID: PMC5085875
- DOI: 10.1016/j.ijrobp.2016.07.021
Selective Internal Radiation Therapy With Yttrium-90 Glass Microspheres: Biases and Uncertainties in Absorbed Dose Calculations Between Clinical Dosimetry Models
Abstract
Purpose: To quantify differences that exist between dosimetry models used for 90Y selective internal radiation therapy (SIRT).
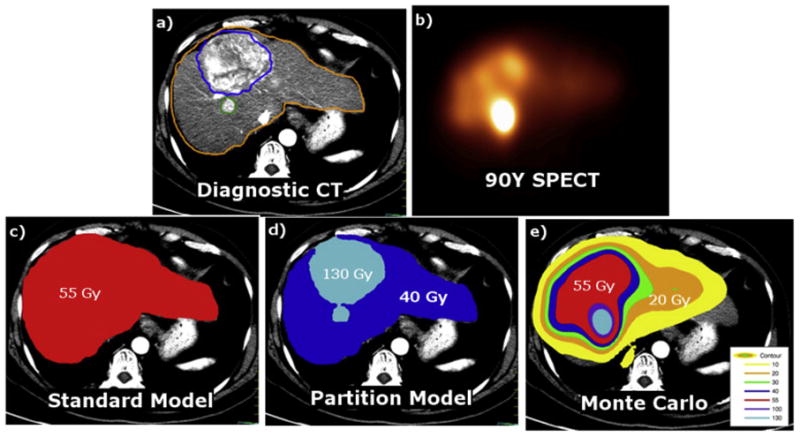
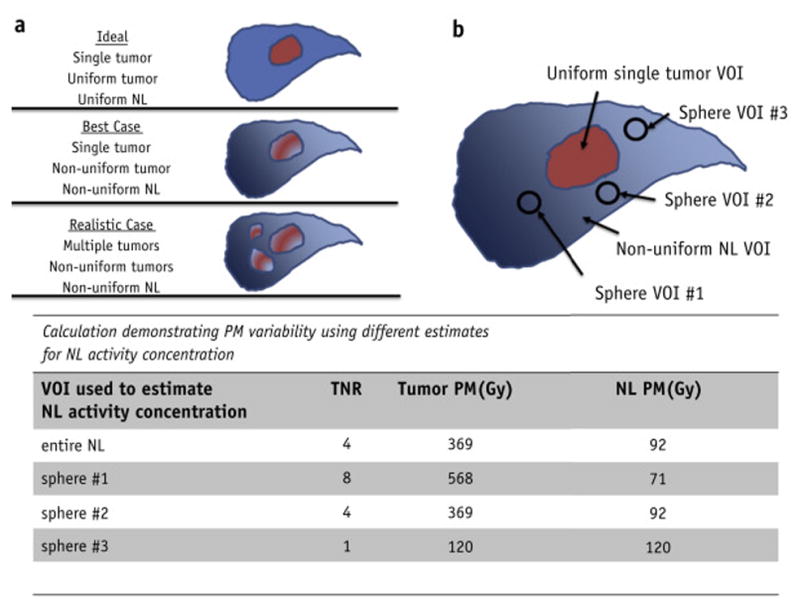
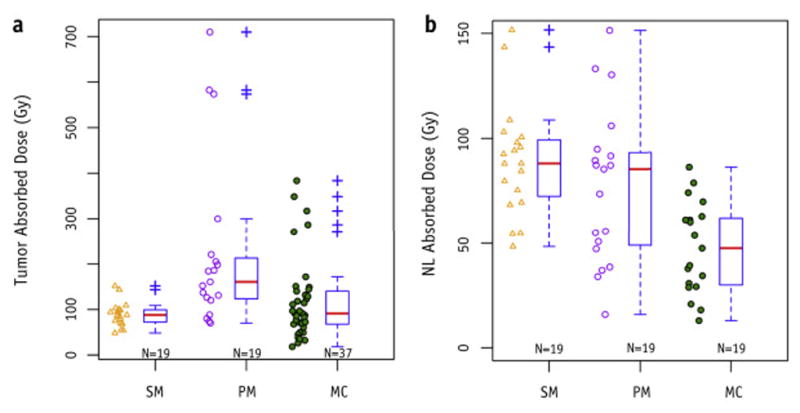
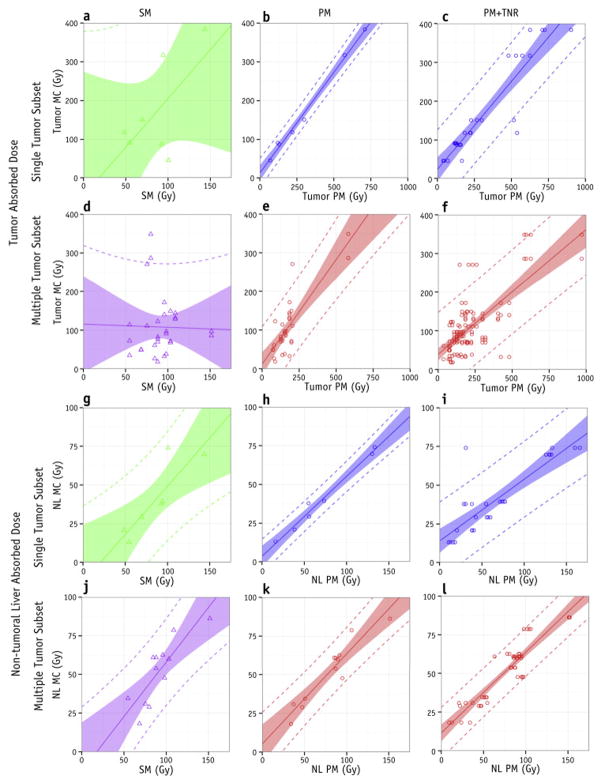
Methods and materials: Retrospectively, 37 tumors were delineated on 19 post-therapy quantitative 90Y single photon emission computed tomography/computed tomography scans. Using matched volumes of interest (VOIs), absorbed doses were reported using 3 dosimetry models: glass microsphere package insert standard model (SM), partition model (PM), and Monte Carlo (MC). Univariate linear regressions were performed to predict mean MC from SM and PM. Analysis was performed for 2 subsets: cases with a single tumor delineated (best case for PM), and cases with multiple tumors delineated (typical clinical scenario). Variability in PM from the ad hoc placement of a single spherical VOI to estimate the entire normal liver activity concentration for tumor (T) to nontumoral liver (NL) ratios (TNR) was investigated. We interpreted the slope of the resulting regression as bias and the 95% prediction interval (95%PI) as uncertainty. MCNLsingle represents MC absorbed doses to the NL for the single tumor patient subset; other combinations of calculations follow a similar naming convention.
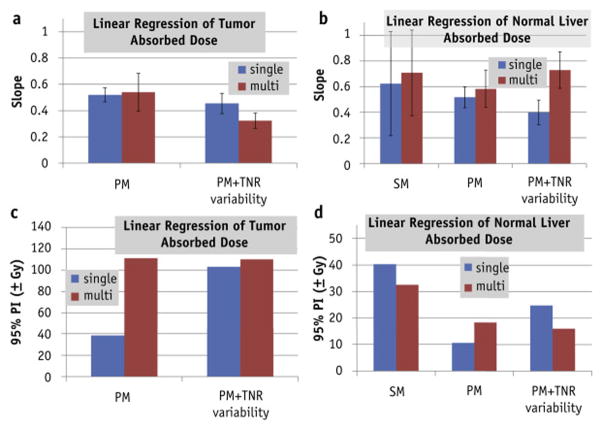
Results: SM was unable to predict MCTsingle or MCTmultiple (p>.12, 95%PI >±177 Gy). However, SMsingle was able to predict (p<.012) MCNLsingle, albeit with large uncertainties; SMsingle and SMmultiple yielded biases of 0.62 and 0.71, and 95%PI of ±40 and ± 32 Gy, respectively. PMTsingle and PMTmultiple predicted (p<2E-6) MCTsingle and MCTmultiple with biases of 0.52 and 0.54, and 95%PI of ±38 and ± 111 Gy, respectively. The TNR variability in PMTsingle increased the 95%PI for predicting MCTsingle (bias = 0.46 and 95%PI = ±103 Gy). The TNR variability in PMTmultiple modified the bias when predicting MCTmultiple (bias = 0.32 and 95%PI = ±110 Gy).
Conclusions: The SM is unable to predict mean MC tumor absorbed dose. The PM is statistically correlated with mean MC, but the resulting uncertainties in predicted MC are large. Large differences observed between dosimetry models for 90Y SIRT warrant caution when interpreting published SIRT absorbed doses. To reduce uncertainty, we suggest the entire NL VOI be used for TNR estimates when using PM.
Copyright © 2016 Elsevier Inc. All rights reserved.
Conflict of interest statement
Notification: AM receives research support from BTG and Sirtex.
Figures
References
-
- Dezarn WA, Cessna JT, DeWerd LA, et al. Recommendations of the American Association of Physicists in Medicine on dosimetry, imaging, and quality assurance procedures for [sup 90]Y microsphere brachytherapy in the treatment of hepatic malignancies. Medical Physics. 2011;38(8):4824–4845. doi: 10.1118/1.3608909. - DOI - PubMed
-
- Ho S, Lau WY, Leung TW, et al. Partition model for estimating radiation doses from yttrium-90 microspheres in treating hepatic tumours. Eur J Nucl Med. 1996;23(8):947–952. - PubMed
Publication types
MeSH terms
Substances
Grants and funding
LinkOut - more resources
Full Text Sources
Other Literature Sources
Medical
Research Materials
Miscellaneous
