. 2016 Dec;30(12):4214-4226.
doi: 10.1096/fj.201600445RR. Epub 2016 Sep 13.

Insulin receptor substrate-1 time-dependently regulates bone formation by controlling collagen Iα2 expression via miR-342

Affiliations

Insulin receptor substrate-1 time-dependently regulates bone formation by controlling collagen Iα2 expression via miR-342

Yue Guo et al. FASEB J. 2016 Dec.

Abstract

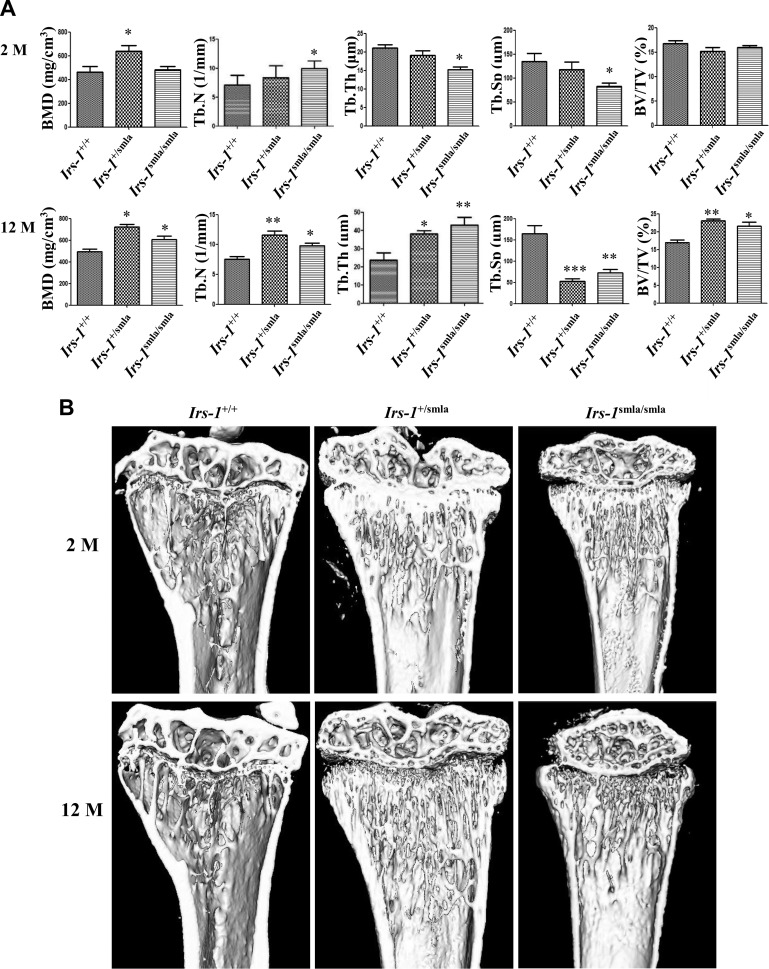
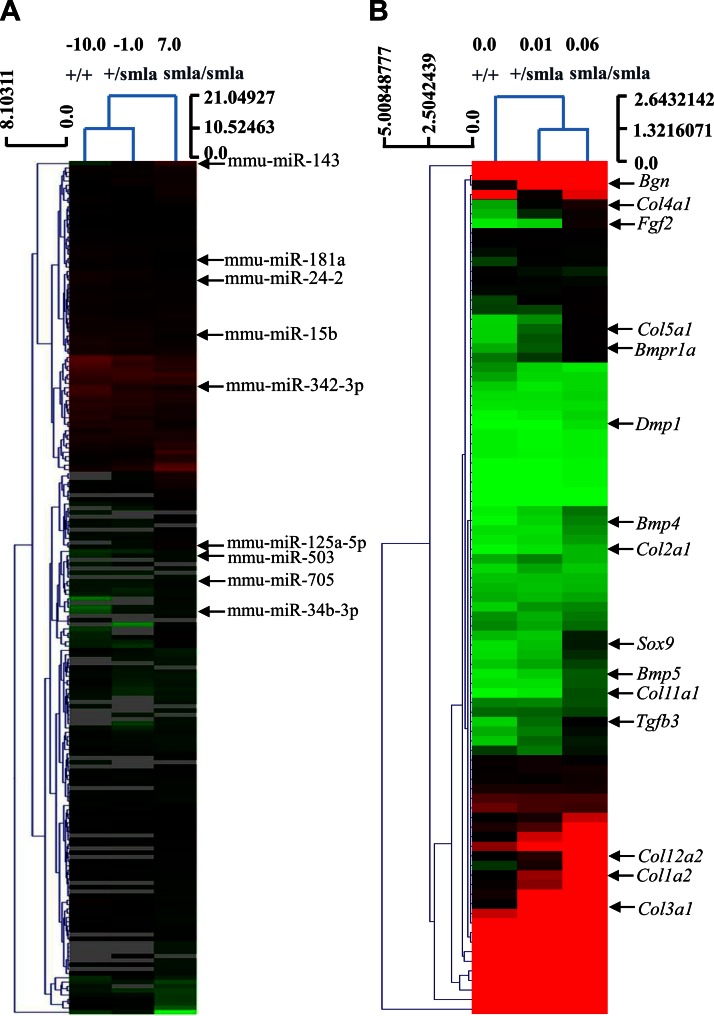
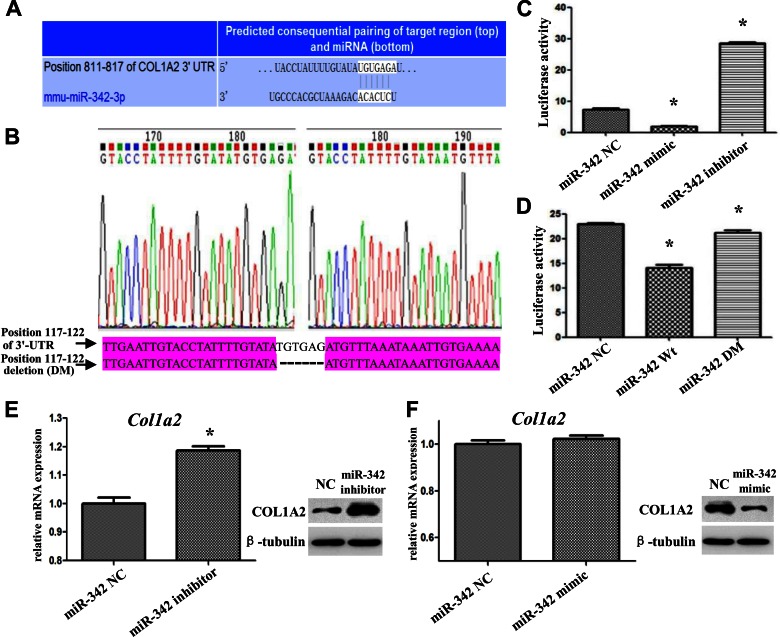
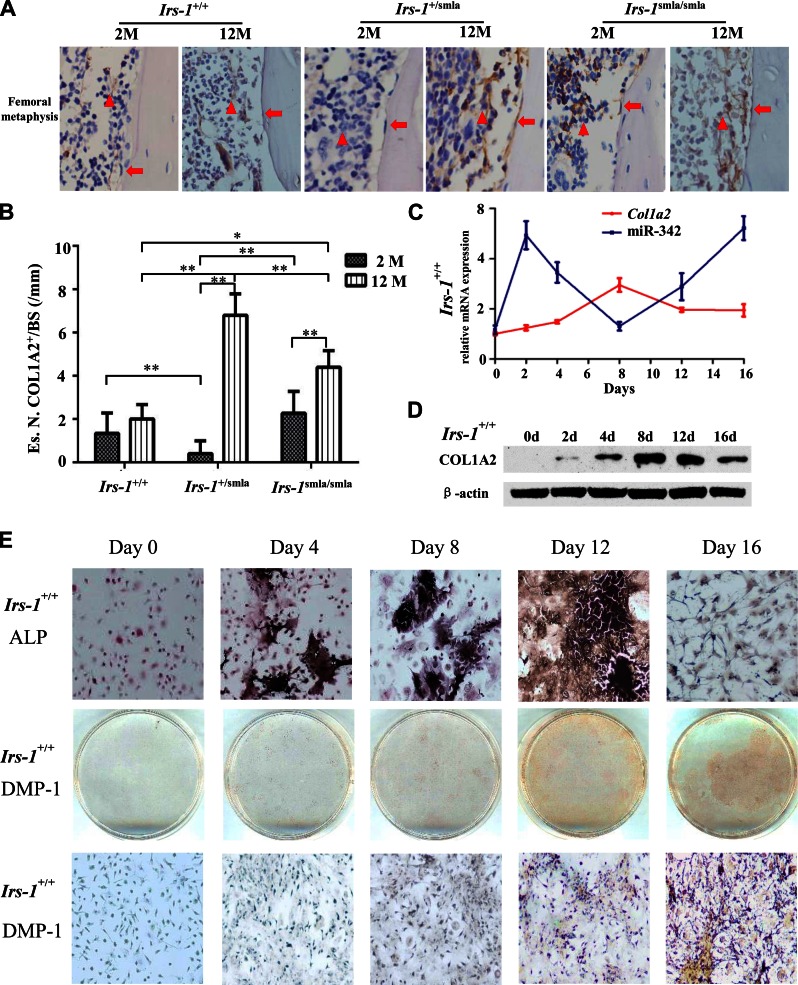
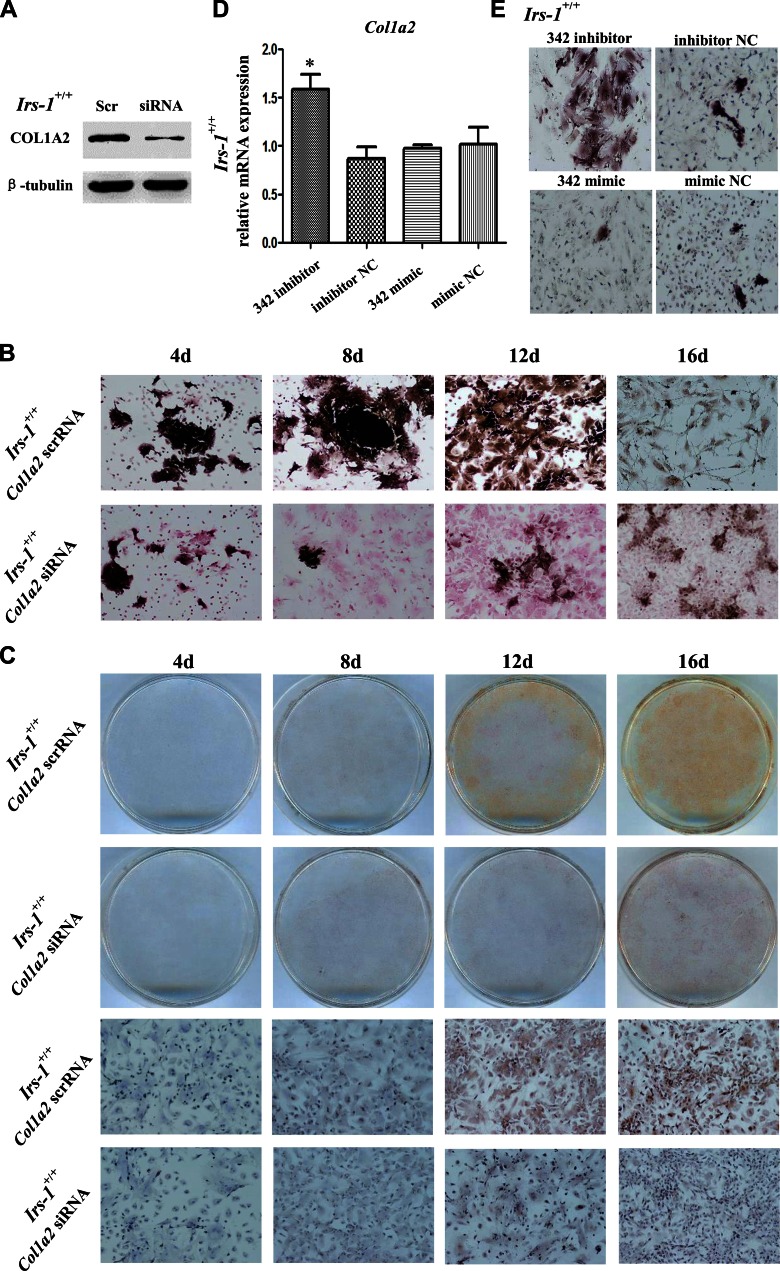
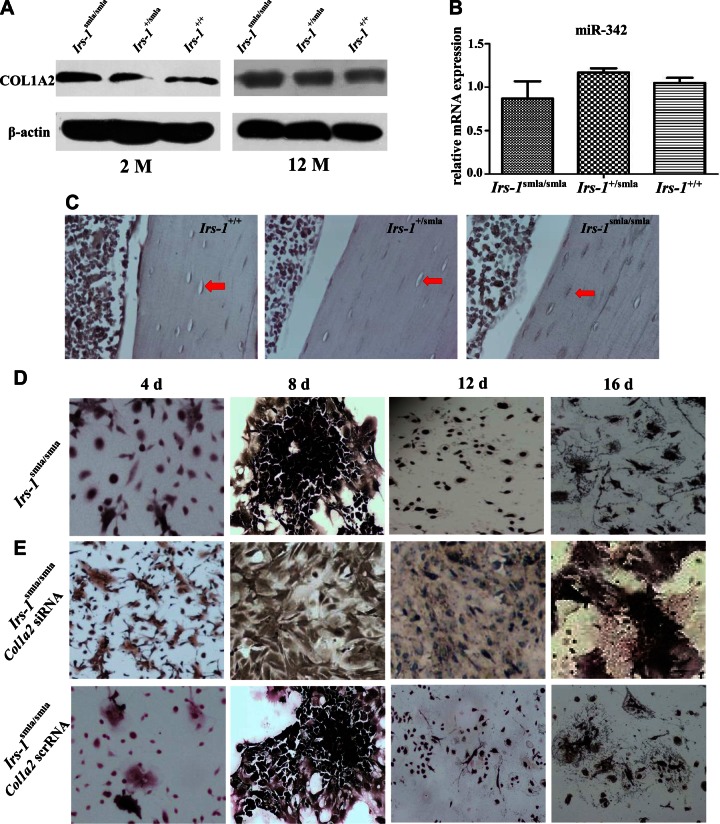
Insulin promotes bone formation via a well-studied canonical signaling pathway. An adapter in this pathway, insulin-receptor substrate (IRS)-1, has been implicated in the diabetic osteopathy provoked by impaired insulin signaling. To further investigate IRS-1's role in the bone metabolism, we generated Irs-1-deficient Irs-1smla/smla mice. These null mice developed a spontaneous mutation that led to an increase in trabecular thickness (Tb.Th) in 12-mo-old, but not in 2-mo-old mice. Analyses of the bone marrow stromal cells (BMSCs) from these mice revealed their differential expression of osteogenesis-related genes and miRNAs. The expression of miR-342, predicted and then proven to target the gene encoding collagen type Iα2 (COL1A2), was reduced in BMSCs derived from Irs-1-null mice. COL1A2 expression was then shown to be age dependent in osteoblasts and BMSCs derived from Irs-1smla/smla mice. After the induction of osteogenesis in BMSCs, miR-342 expression correlated inversely with that of Col1a2 Further, Col1a2-specific small interfering RNA (siRNA) reduced alkaline phosphatase (ALP) activity and inhibited BMSC differentiation into osteocyte-like cells, both in wild-type (WT) and Irs-1smla/smla mice. Conversely, in Irs-1smla/smla osteocytes overexpressing COL1A2, ALP-positive staining was stronger than in WT osteocytes. In summary, we uncovered a temporal regulation of BMSC differentiation/bone formation, controlled via Irs-1/miR-342 mediated regulation of Col1a2 expression.-Guo, Y., Tang, C.-Y., Man, X.-F., Tang, H.-N., Tang, J., Wang, F., Zhou, C.-L., Tan, S.-W., Feng, Y.-Z., Zhou, H.-D. Insulin receptor substrate-1 time-dependently regulates bone formation by controlling collagen Iα2 expression via miR-342.

Keywords: bone formation; collagen 1α2; insulin receptor substrate; miR-342.


Figures

Figure 1.
Figure 1.
Bone histomorphometric analyses and images of Irs-1smla/smla mice by μCT. A) Results of histomorphometric analyses in 2- and 12-mo-old mice. Compared with age-matched WT Irs-1+/+ mice, 2-mo-old Irs-1smla/smla mice demonstrated comparable BMD and BV/TV, increased Tb.N, and decreased Tb.Th and Tb.Sp. In 12-mo-old Irs-1smla/smla mice, BMD, Tb.N, Tb.Th, and BV/TV were all increased, but Tb.Sp was decreased compared with age-matched WT mice. B) Representative 3-D rendered μCT images of proximal tibiae from different groups. Compared with the WT group, dramatic bone gain was identified in 12-mo-old Irs-1smla/smla trabeculae. *P < 0.05; **P < 0.01, compared to WT mice. Data are means ± sd.
Figure 2.
Figure 2.
Differential expression of osteogenesis-related genes and miRNAs in BMSCs isolated from Irs-1smla/smla mice. A) Heat map shows differentially expressed miRNAs in BMSCs from Irs-1+/+, Irs-1+/smla, and Irs-1smla/smla mice. B) Heat map shows differentially expressed osteogenesis-related genes in BMSCs from Irs-1+/+, Irs-1+/smla, and Irs-1smla/smla mice.
Figure 3.
Figure 3.
Validation that murine miR-342 targets and controls the expression of Col1a2. A) Bioinformatics prediction of the binding region of mouse miR-342 (mmu-miR-342-3p) within the Col1a2 3′-UTR. B) Sequence comparison of the Col1a2 3′-UTR (WT) and the core sequence DM. These fragments were amplified, isolated, and inserted into the luciferase expression vector, pmirGLO, to examine luciferase reporter activity. C) In HEK293T cells transfected with WT Col1a2, an miR-342 mimic inhibited luciferase activity, and an miR-342 inhibitor enhanced luciferase activity. D) In HEK293 cells transfected with the DM, the miR-342 mimic lost the ability to inhibit luciferase activity. E, F) In osteogenic cells, the miR-342 inhibitor increased Col1a2 RNA (E, left) and protein (E, right) expression, but an miR-342 mimic reduced Col1a2 protein expression (F, right). *P < 0.05, compared to NC. Data are means ± sd.
Figure 4.
Figure 4.
Time-dependent expression of Col1a2 and miR-342 in Irs-1smla/smla mice and in bone marrow cells induced to osteogenic differentiation in vitro. A) Immunohistochemical analyses of bone tissue shows COL1A2 expression (brown stain) in BMSCs (triangles), and osteoblasts (arrows) from Irs-1+/+, Irs-1+/smla, and Irs-1smla/smla mice at 2 mo (left) and 12 mo (right) of age. At 2 mo of age, Irs-1smla/smla mice showed a higher COL1A2 expression in BMSCs than Irs-1+/+ mice. However, by 12 mo of age, COL1A2 expression levels were higher in osteoblasts from Irs-1smla/smla mice than in osteoblasts from Irs-1+/+ mice. B) Representative images of COL1A2 immunohistochemical stains with quantification of the osteoblast number on endosteal bone surface of the distal femora of 2-mo-old (2 M) and 12-mo-old (12 M) C57BL/6 mice. Es.N. COL1A2+/BS, number of COL1A2+ cells per endosteal bone surface (n = 5 per group). *P < 0.05, **P < 0.01, by 1-way ANOVA. C) Time course of Col1a2 mRNA and miR-342 expression during osteogenic induction in BMSCs isolated from WT mice. Col1a2 expression increased gradually, peaked after d 8, then decreased. Conversely, miR-342 expression increased up to d 2, reached a nadir after d 8, then increased. D) COL1A2 protein expression also increased gradually during osteogenic induction of BMSCs from WT mice, then, after d 8, protein levels decreased to d 16. E) During BMSCs osteogenic induction, ALP expression (black stain) increased, peaked on d 12, and then decreased. Expression of the osteocyte marker, DMP-1, was detected on d 12 and 16.
Figure 5.
Figure 5.
A Col1a2-specific siRNA and miR-342 mimic inhibited BMSC differentiation into osteoblasts and osteocyte-like cells. BMSCs from WT mice were transfected with either a Col1a2 siRNA/scrRNA or miR-342 mimic/inhibitor, then subjected to osteogenic differentiation. A) The Col1a2 siRNA, but not control (scrRNA), transfections inhibited the expression of COL1A2. B) ALP staining showed that control-transfected BMSCs (scrRNA) differentiated into small, asteroid osteocyte-like cells, but the transfection of a Col1a2 siRNA inhibited differentiation, even after 16 d of induction. C) DMP-1 staining (brown) was observed in control-transfected cells but not in Col1a2 siRNA-transfected cells. D, E) Transfections with an miR-342 inhibitor increased Col1a2 mRNA expression (D) and ALP content (E) in BMSCs.
Figure 6.
Figure 6.
The relationship of COL1A2 expression in BMSCs, ALP staining in osteocytes, and in the capacity for in vitro osteogenesis in BMSCs derived from Irs-1smla/smla, Irs-1+/smla, and Irs-1+/+ mice. A) Western blots showing that compared to BMSCs from Irs-1+/smla and Irs-1+/+ mice, COL1A2 expression was clearly elevated in BMSCs from Irs-1smla/smla mice at 2 mo but not at 12 mo of age. B) Real-time PCR assays shows that the expression levels of miR-342 showed no significant statistical differences among Irs-1smla/smla, Irs-1+/smla, and Irs-1+/+ mice. C) ALP staining was also increased in osteocytes from Irs-1smla/smla mice compared to osteocytes from Irs-1+/smla and Irs-1+/+ mice. D) BMSCs from the Irs-1smla/smla mice showed low ALP staining after 4 d of osteogenesis induction and then differentiated into osteocyte-like cells after 12 d of osteogenesis induction. These osteocyte-like cells showed a more intense ALP staining than those from WT mice (see Fig. 4E). E) When BMSCs from the Irs-1smla/smla mice were transfected with a Col1a2 siRNA, they lost the ability to differentiate into osteocyte-like cells, even after 16 d of induction.

References

    1. Wang T., Wang Y., Menendez A., Fong C., Babey M., Tahimic C. G., Cheng Z., Li A., Chang W., Bikle D. D. (2015) Osteoblast-specific loss of IGF1R Signaling results in impaired endochondral bone formation during fracture healing. J. Bone Miner. Res. 30, 1572–1584 - PMC - PubMed
    1. Fowlkes J. L., Bunn R C., Thrailkill K. M. (2011) Contributions of the insulin/insulin-like growth factor-1 axis to diabetic osteopathy. J. Diabetes Metab. 1, S1–003 - PMC - PubMed
    1. Thrailkill K., Bunn R. C., Lumpkin C. Jr., Wahl E., Cockrell G., Morris L., Kahn C. R., Fowlkes J., Nyman J. S. (2014) Loss of insulin receptor in osteoprogenitor cells impairs structural strength of bone. J. Diabetes Res. 2014, 703589 - PMC - PubMed
    1. Dhaliwal R., Cibula D., Ghosh C., Weinstock R. S., Moses A. M. (2014) Bone quality assessment in type 2 diabetes mellitus. Osteoporos. Int. 25, 1969–1973 - PubMed
    1. Mathen P. G., Thabah M. M., Zachariah B., Das A. K. (2015) Decreased bone mineral density at the femoral neck and lumbar spine in South Indian patients with type 2 diabetes. J. Clin. Diagn. Res. 9, OC08–OC12 - PMC - PubMed

MeSH terms