

Mathematical modelling of lymphatic filariasis elimination programmes in India: required duration of mass drug administration and post-treatment level of infection indicators
- PMID: 27624157
- PMCID: PMC5022201
- DOI: 10.1186/s13071-016-1768-y
Mathematical modelling of lymphatic filariasis elimination programmes in India: required duration of mass drug administration and post-treatment level of infection indicators
Abstract
Background: India has made great progress towards the elimination of lymphatic filariasis. By 2015, most endemic districts had completed at least five annual rounds of mass drug administration (MDA). The next challenge is to determine when MDA can be stopped. We performed a simulation study with the individual-based model LYMFASIM to help clarify this.
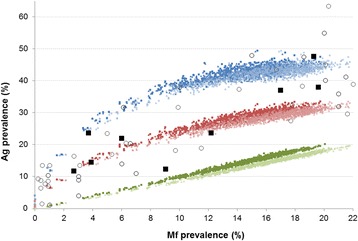
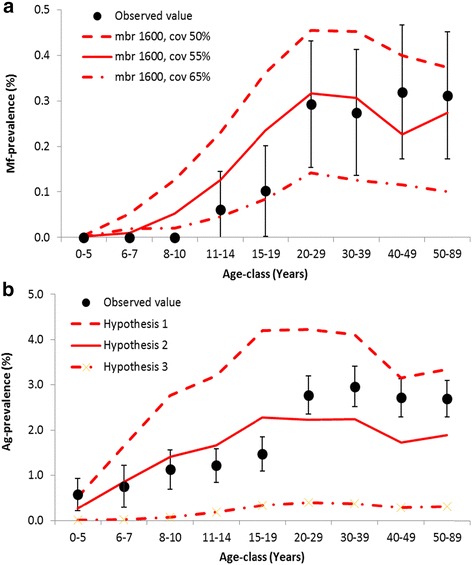
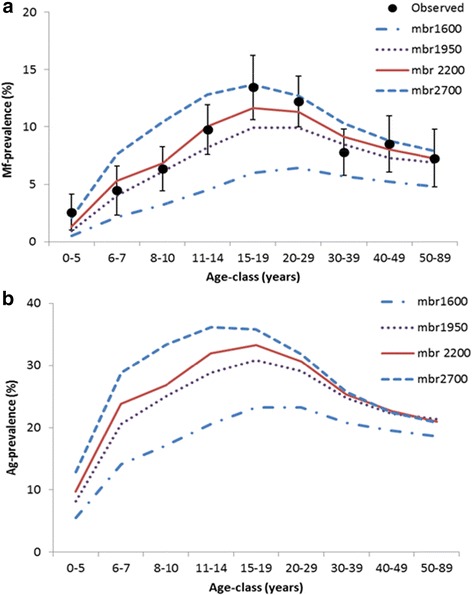
Methods: We used a model-variant for Indian settings. We considered different hypotheses on detectability of antigenaemia (Ag) in relation to underlying adult worm burden, choosing the most likely hypothesis by comparing the model predicted association between community-level microfilaraemia (Mf) and antigenaemia (Ag) prevalence levels to observed data (collated from literature). Next, we estimated how long MDA must be continued in order to achieve elimination in different transmission settings and what Mf and Ag prevalence may still remain 1 year after the last required MDA round. The robustness of key-outcomes was assessed in a sensitivity analysis.
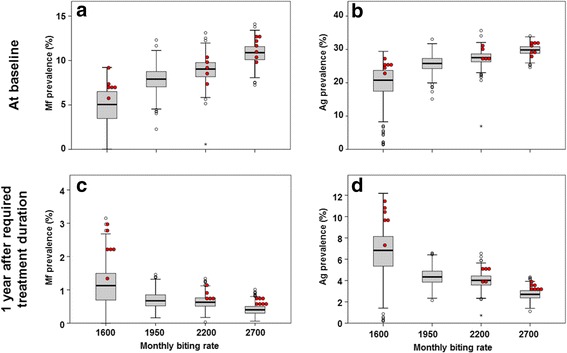
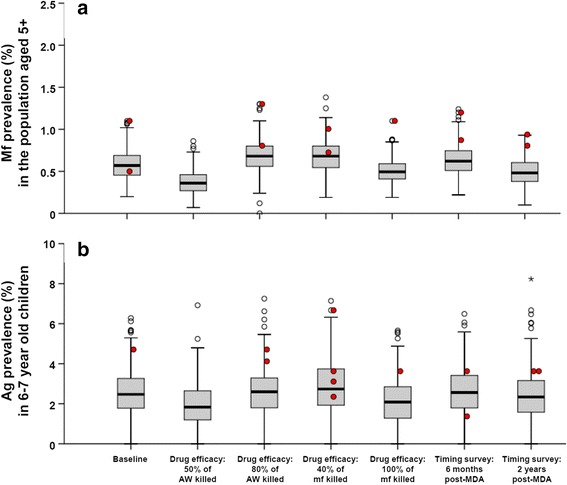
Results: Our model matched observed data qualitatively well when we assumed an Ag detection rate of 50 % for single worm infections, which increases with the number of adult worms (modelled by relating detection to the presence of female worms). The required duration of annual MDA increased with higher baseline endemicity and lower coverage (varying between 2 and 12 rounds), while the remaining residual infection 1 year after the last required treatment declined with transmission intensity. For low and high transmission settings, the median residual infection levels were 1.0 % and 0.4 % (Mf prevalence in the 5+ population), and 3.5 % and 2.0 % (Ag prevalence in 6-7 year-old children).
Conclusion: To achieve elimination in high transmission settings, MDA must be continued longer and infection levels must be reduced to lower levels than in low-endemic communities. Although our simulations were for Indian settings, qualitatively similar patterns are also expected in other areas. This should be taken into account in decision algorithms to define whether MDA can be interrupted. Transmission assessment surveys should ideally be targeted to communities with the highest pre-control transmission levels, to minimize the risk of programme failure.
Keywords: Culex quinquefasciatus; Diethylcarbamazine and albendazole; Elimination; India; Individual-based model; Lymphatic filariasis; MDA duration; Mass treatment; Post-MDA residual infection; Prevalence; Wuchereria bancrofti.
Figures

Similar articles
-
The impact of six rounds of single-dose mass administration of diethylcarbamazine or ivermectin on the transmission of Wuchereria bancrofti by Culex quinquefasciatus and its implications for lymphatic filariasis elimination programmes.Trop Med Int Health. 2003 Dec;8(12):1082-92. doi: 10.1046/j.1360-2276.2003.01138.x. Trop Med Int Health. 2003. PMID: 14641843 Clinical Trial.
-
Effect of annual mass administration of diethylcarbamazine and albendazole on bancroftian filariasis in five villages in south India.Trans R Soc Trop Med Hyg. 2011 Aug;105(8):431-7. doi: 10.1016/j.trstmh.2011.04.006. Epub 2011 May 23. Trans R Soc Trop Med Hyg. 2011. PMID: 21601901
-
The effect of six rounds of single dose mass treatment with diethylcarbamazine or ivermectin on Wuchereria bancrofti infection and its implications for lymphatic filariasis elimination.Trop Med Int Health. 2002 Sep;7(9):767-74. doi: 10.1046/j.1365-3156.2002.00935.x. Trop Med Int Health. 2002. PMID: 12225508 Clinical Trial.
-
Model-based analysis of trial data: microfilaria and worm-productivity loss after diethylcarbamazine-albendazole or ivermectin-albendazole combination therapy against Wuchereria bancrofti.Trop Med Int Health. 2006 May;11(5):718-28. doi: 10.1111/j.1365-3156.2006.01606.x. Trop Med Int Health. 2006. PMID: 16640625 Review.
-
Albendazole alone or in combination with microfilaricidal drugs for lymphatic filariasis.Cochrane Database Syst Rev. 2019 Jan 8;1(1):CD003753. doi: 10.1002/14651858.CD003753.pub4. Cochrane Database Syst Rev. 2019. PMID: 30620051 Free PMC article.
Cited by
-
NYD-OP7/PLC regulatory signaling pathway regulates deltamethrin resistance in Culex pipiens pallens (Diptera: Culicidae).Parasit Vectors. 2018 Jul 16;11(1):419. doi: 10.1186/s13071-018-3011-5. Parasit Vectors. 2018. PMID: 30012184 Free PMC article.
-
Are Alternative Strategies Required to Accelerate the Global Elimination of Lymphatic Filariasis? Insights From Mathematical Models.Clin Infect Dis. 2018 Jun 1;66(suppl_4):S260-S266. doi: 10.1093/cid/ciy003. Clin Infect Dis. 2018. PMID: 29860286 Free PMC article.
-
Modelling Anti-Ov16 IgG4 Antibody Prevalence as an Indicator for Evaluation and Decision Making in Onchocerciasis Elimination Programmes.PLoS Negl Trop Dis. 2017 Jan 23;11(1):e0005314. doi: 10.1371/journal.pntd.0005314. eCollection 2017 Jan. PLoS Negl Trop Dis. 2017. PMID: 28114304 Free PMC article.
-
Lymphatic filariasis endgame strategies: Using GEOFIL to model mass drug administration and targeted surveillance and treatment strategies in American Samoa.PLoS Negl Trop Dis. 2023 May 18;17(5):e0011347. doi: 10.1371/journal.pntd.0011347. eCollection 2023 May. PLoS Negl Trop Dis. 2023. PMID: 37200375 Free PMC article.
-
Lymphatic filariasis transmission 10 years after stopping mass drug administration in the Gomoa west district of Ghana.Int J Infect Dis. 2025 Mar;152:107790. doi: 10.1016/j.ijid.2025.107790. Epub 2025 Jan 20. Int J Infect Dis. 2025. PMID: 39842689 Free PMC article.
References
-
- World Health Organization . Elimination of lymphatic filariasis as a public health problem - resolution of the executive board of the WHO (WHA50.29) Geneva: Fiftieth World Health Assembly; 1997.
-
- World Health Organization . Global Programme to Eliminate Lymphatic filariasis: monitoring and epidemiological assessment of mass drug administration. A manual for national elimination programmes. Geneva: World Health Organization; 2011.
-
- WHO Regional Office for South-East Asia . The regional strategic plan for elimination of lymphatic filariasis 2010–2015. New Delhia: World Health Organization, Regional Office for South-East Asia; 2010.
Publication types
MeSH terms
Substances
LinkOut - more resources
Full Text Sources
Other Literature Sources
