. 2016 Nov 11;291(46):23965-23977.
doi: 10.1074/jbc.M116.743633. Epub 2016 Sep 13.

Biophysical Characterization of a Thermoalkaliphilic Molecular Motor with a High Stepping Torque Gives Insight into Evolutionary ATP Synthase Adaptation

Affiliations

Biophysical Characterization of a Thermoalkaliphilic Molecular Motor with a High Stepping Torque Gives Insight into Evolutionary ATP Synthase Adaptation

Duncan G G McMillan et al. J Biol Chem. .

Abstract

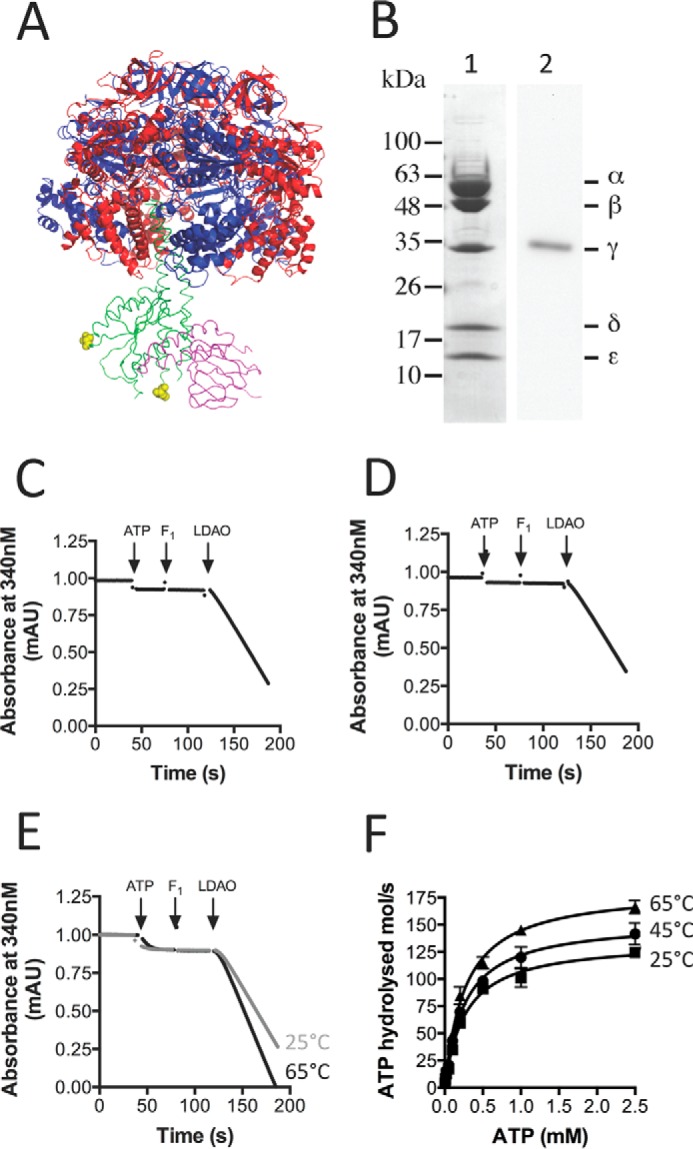
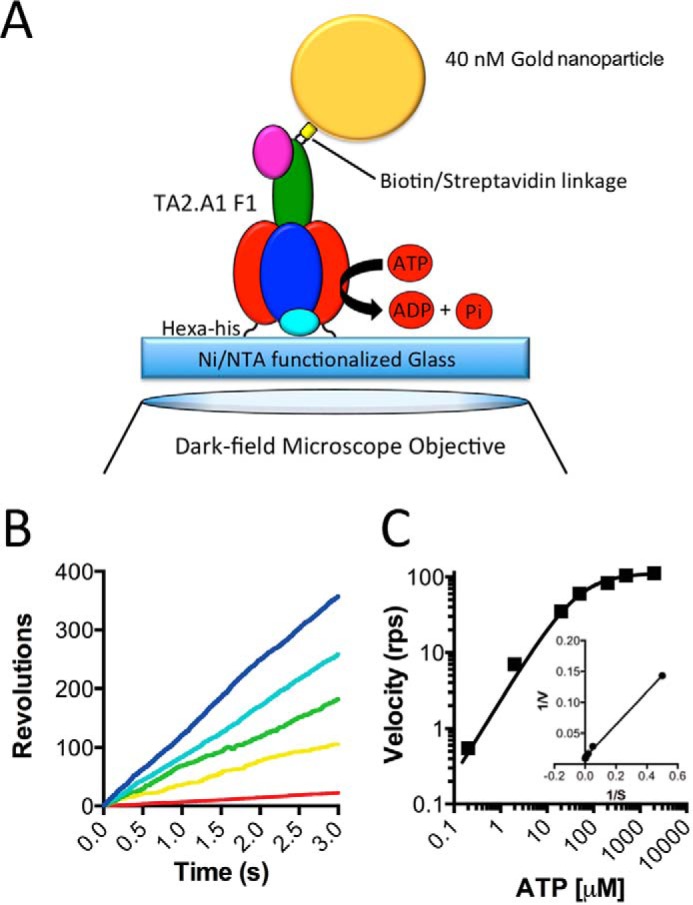
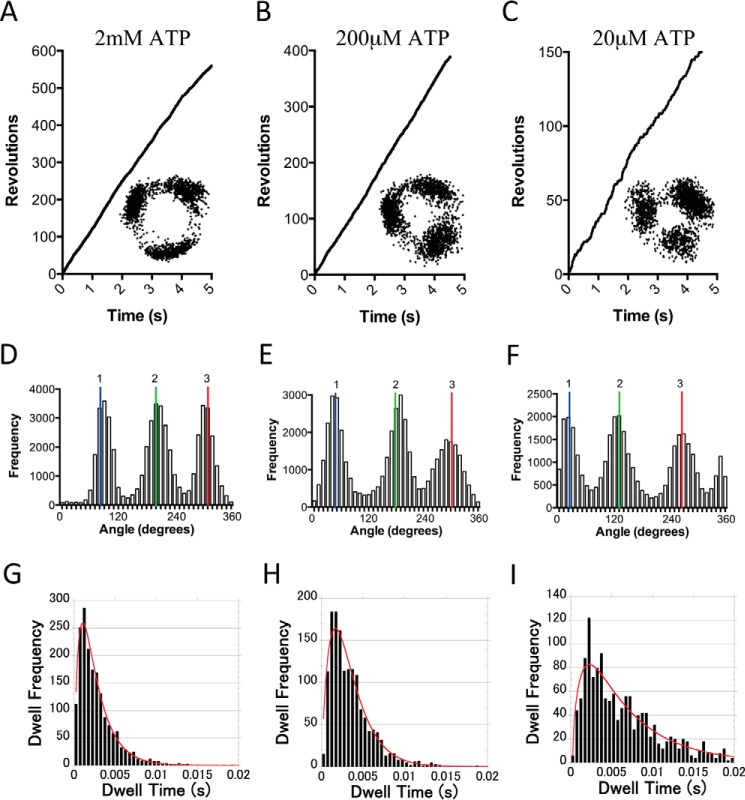
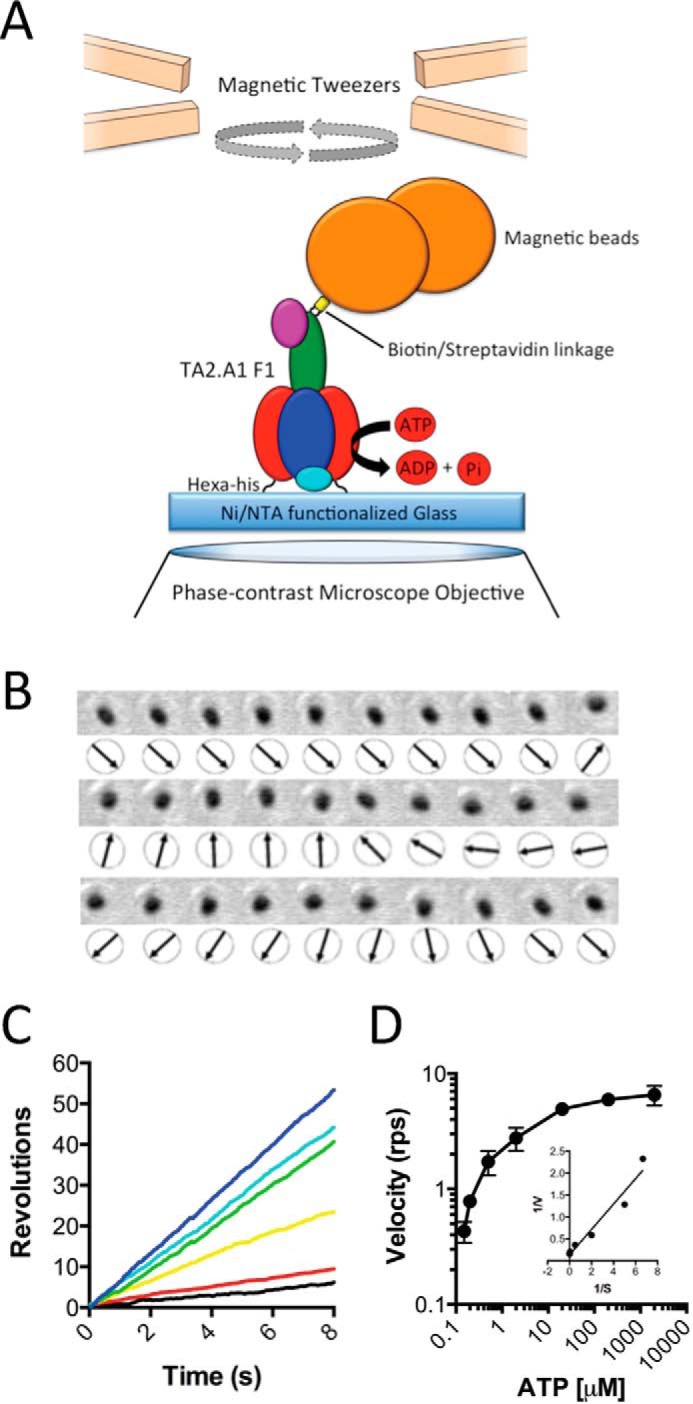
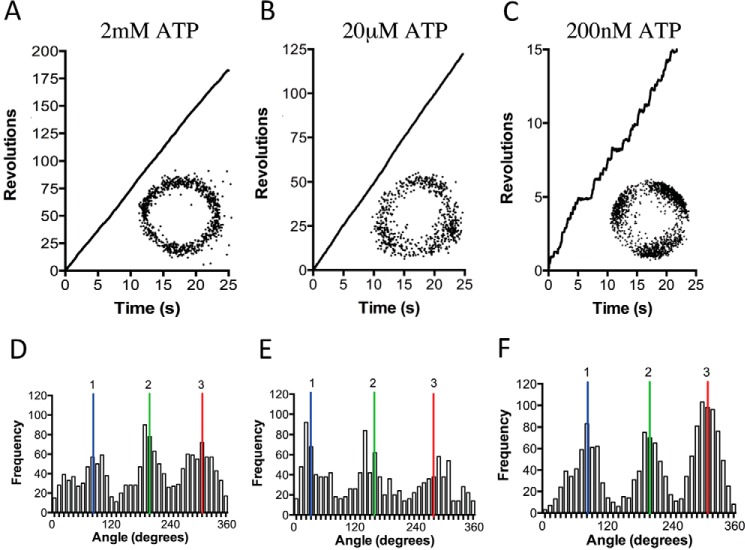
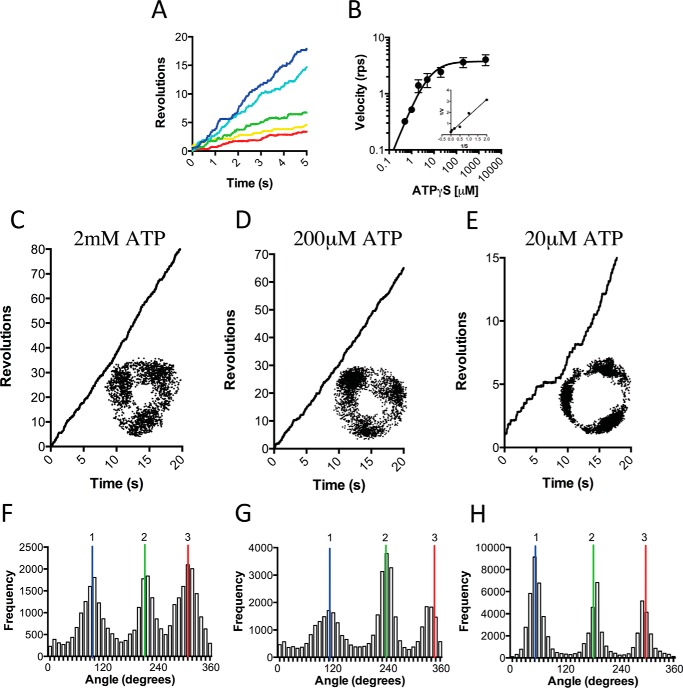
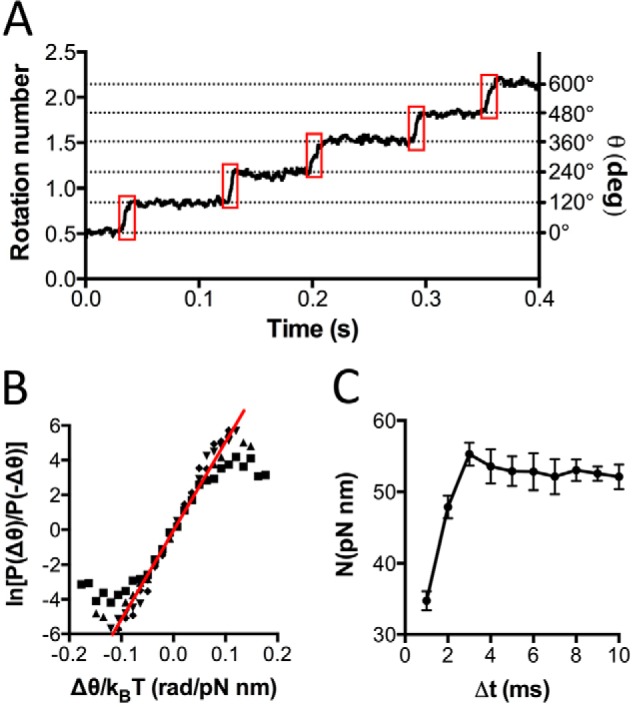
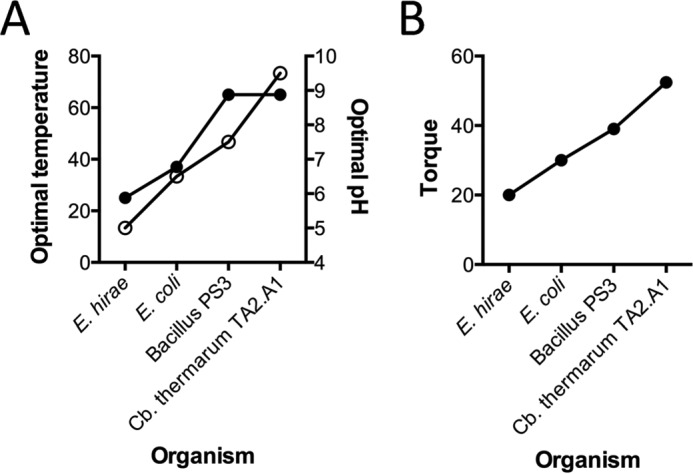
F1F0 ATP synthases are bidirectional molecular motors that translocate protons across the cell membrane by either synthesizing or hydrolyzing ATP. Alkaliphile ATP synthases are highly adapted, performing oxidative phosphorylation at high pH against an inverted pH gradient (acidin/alkalineout). Unlike mesophilic ATP synthases, alkaliphilic enzymes have tightly regulated ATP hydrolysis activity, which can be relieved in the presence of lauryldimethylamine oxide. Here, we characterized the rotary dynamics of the Caldalkalibacillus thermarum TA2.A1 F1 ATPase (TA2F1) with two forms of single molecule analysis, a magnetic bead duplex and a gold nanoparticle. TA2F1 rotated in a counterclockwise direction in both systems, adhering to Michaelis-Menten kinetics with a maximum rotation rate (Vmax) of 112.4 revolutions/s. TA2F1 displayed 120° unitary steps coupled with ATP hydrolysis. Torque measurements revealed the highest torque (52.4 piconewtons) derived from an F1 molecule using fluctuation theorem. The implications of high torque in terms of extreme environment adaptation are discussed.

Keywords: ATP synthase; F1F0-ATPase; adaptation; enzyme kinetics; enzyme mechanism; respiratory chain; rotation; single molecule biophysics; thermoalkaliphile; torque.


Figures

FIGURE 1.
FIGURE 1.
Purification, labeling, and biochemical features of TA2F1γ2c. A, schematic representation of the TA2F1 structure (Protein Data Bank code 2QE7 (53)) showing the relative positions of the two introduced cysteine residues (γH107C/γS210C; in yellow Corey-Pauling-Koltun modeling; hence TA2F1γ2c) located in the γ-subunit (green). The ϵ-subunit is pink, and the α- and β-subunits are shown in blue and red, respectively. This model was constructed and rendered using PyMOL (Schrödinger, LLC). B, lane 1, SDS-PAGE analysis of the purified, biotin-labeled TA2F1γ2c ATPase resolved on a 12% polyacrylamide gel and stained with Coomassie Brilliant Blue. B, lane 2, prior to Western blotting analysis, biotin-labeled TA2F1γ2c ATPase was separated by SDS-PAGE (12%). TA2F1γ2c was subsequently transferred onto a polyvinylidene difluoride membrane and immunoblotted using a streptavidin-alkaline phosphatase conjugate directed against the biotin-modified γ-subunit of TA2F1γ2c. 10 μg of protein was used in all separations. C and D, representative plots showing the effect of 0.1% LDAO on biotin-labeled TA2F1γ2c (C) or TA2F1 WT (D) ATPase activity at 45 °C. E, representative plots showing the effect of 0.1% LDAO on biotin-labeled TA2F1γ2c ATPase activity at 25 (gray line) and 65 °C (black line). Arrows indicate the points during the time traces where various assay components were added. F, effect of ATP concentration and temperature on biotin-labeled TA2F1γ2c ATP hydrolysis activity in the presence of 0.1% LDAO. All measurements were at pH 8.0, and three replicates were performed using 5 μg of protein per measurement with the ATP-regenerating assay described under “Experimental Procedures.” mAU, milliabsorbance units. Error bars represent S.E.
FIGURE 2.
FIGURE 2.
Effect of ATP concentration on TA2F1γ2c rotation rate with a gold nanoparticle. A, schematic representation of the experimental setup for a single molecule rotation assay of the TA2F1γ2c gold nanoparticle probe. The stator α3β3δ subcomplex of TA2F1γ2c was fixed onto the nickel-NTA glass surface with the hexahistidine tag at the N terminus of each β-subunit. A streptavidin-coated 40-nm gold nanoparticle was attached to biotinylated cysteine residues in the γ-subunit rotor (γH107C/γS210C). B and C, effect of ATP concentration on rotation of TA2F1γ2c using the system displayed in A. B, displayed are representative rotation traces recorded at 10,000 fps with a variety of ATP concentrations: 2 mm (blue), 200 μm (cyan), 50 μm (green), 20 μm (yellow), and 2 μm (red). C, displayed are the average rotation rates of 15 molecules at the concentrations of ATP indicated on the graph. Error bars represent S.E. C, inset, Lineweaver-Burke plot of data from C used to define the Vmax of 112.4 ± 4.3 revolutions s−1 (rps) and Km of 46.85 ± 3.69 μm.
FIGURE 3.
FIGURE 3.
Rotation of TA2F1 reveals three distinct dwell states separated by 120°. A–C, representative rotation traces recorded using gold nanoparticle as a rotation probe at a variety of ATP concentrations: 2 mm (A), 200 μm (B), and 20 μm (C). Insets from A–C show the x-y trajectories of the centroid of the rotating gold nanoparticle from the respective traces. D–F are distributions of rotary angles shown in A–C. G–I are distributions of duration times of dwells at each 120° step composed of dwells from 15 molecules from rotation traces analyzed collectively at the same ATP concentrations as in A–C. 1, 2 and 3 are the three dwell positions separated by 120°. The bin width across all plots was 0.5 ms, and the red curves show the fitting with a triple exponential model: m1 × (exp(−1/m2 × m0) − exp(−1/m3 × m0) − exp(−1/m4 × m0)); m1 = 150, m2 = 0.002, m3 = 0.0005, and m4 = 0.0005. For G, τ1 = 2.2 ± 0.2 ms, τ2 = 0.42 ± 0.04 ms, and τ3 =0.42 ± 0.24 ms (n = 1835). For H, τ1 = 2.6 ± 0.3 ms, τ2 = 0.32 ± 0.04 ms, and τ3 = 0.98 ± 0.27 ms (n = 1500). For I, τ1 = 6.2 ± 0.9 ms, τ2 = 0.68 ± 0.07 ms, and τ3 = 0.7 ± 0.18 ms (n = 1500). Fitting was conducted with KaleidaGraph version 4.5.
FIGURE 4.
FIGURE 4.
Effect of ATP concentration on TA2F1 rotation rate with magnetic beads. A, schematic representation of the experimental setup for a single molecule rotation assay of TA2F1γ2c with a magnetic bead as a probe. The stator α3β3δ subcomplex of TA2F1γ2c was fixed onto the nickel-NTA glass surface with the hexahistidine tag at the N terminus of each β-subunit. A streptavidin-coated 200-nm magnetic bead was attached to biotinylated cysteine residues in the γ-subunit rotor (γH107C/γS210C). B, frame-by-frame montage of a single rotating magnetic bead directly showing rotation states. C and D, effect of ATP concentration on rotation of TA2F1γ2c using the system displayed in A. C, displayed are representative rotation traces recorded at 30 fps with a variety of ATP concentrations: 2 mm (blue), 200 μm (cyan), 20 μm (green), 2 μm (yellow), 200 nm (red), and 150 nm (black). D, displayed are the average rotation rates of 15 molecules at the concentrations of ATP indicated. Error bars represent S.D. D, inset, Lineweaver-Burke plot of data from D used to define the Vmax of 6.5 ± 0.4 revolutions s−1 (rps) and Km of 2.72 ± 0.45 μm. The rotation assay was conducted as described under “Experimental Procedures.”
FIGURE 5.
FIGURE 5.
Effect of ATP concentration on TA2F1 dwell state distribution with a magnetic bead. A–C, representative rotation traces recorded using a magnetic particle as a rotation probe at a variety of ATP concentrations: 2 mm (A), 20 μm (B), and 200 nm (C). Insets from A–C show the x-y trajectories of the centroid of the rotating particles from the respective traces. D–F show the distributions of rotary angles shown in A–C. 1, 2 and 3 are the three dwell positions separated by 120°. The traces, plots, and trajectories are representative of 15 molecules. The rotation assay was conducted as described under “Experimental Procedures.”
FIGURE 6.
FIGURE 6.
Effect of ATPγS concentration on TA2F1 rotation rate with a magnetic bead. Shown is the effect of ATPγS concentration on rotation of TA2F1γ2c using the system displayed in Fig. 4A. A, displayed are representative rotation traces recorded at 1000 fps with a variety of ATPγS concentrations: 2 mm (blue), 200 μm (cyan), 20 μm (green), 2 μm (yellow), and 1 μm (red). B, displayed are the average rotation rates of 15 molecules at the concentrations of ATP indicated. Error bars represent S.D. B, inset, Lineweaver-burke plot of data from B used to define the Vmax of 4.02 ± 0.3 revolutions s−1 (rps) and Km of 5.61 ± 1.33 μm. C–E, representative rotation traces recorded using a magnetic particle as a rotation probe at a variety of ATPγS concentrations: 2 mm (C), 200 μm (D), and 20 μm (E). Insets from C–E show the x-y trajectories of the centroid of the rotating particles from the respective traces. F–H are distributions of rotary angles shown in C–E. 1, 2 and 3 are the three dwell positions separated by 120°. The traces, plots, and trajectories are representative of 15 molecules. The rotation assay was conducted as described under “Experimental Procedures.”
FIGURE 7.
FIGURE 7.
Rotary torque of TA2F1 is the highest determined by fluctuation theorem. A, typical time course of TA2F1γ2c rotation with 2 mm ATPγS filmed at 5000 fps. Boxed in red are the stepping regions of the trace, θ(t), used to determine the torque. The steps were determined by eye. B and C, 10 TA2F1 rotation traces were collectively analyzed. B, ln[P(Δθ)/P(−Δθ)] as a function of Δθ/kBT. The red line shows the average torque of the 10 molecules. The slope revealed a rotary torque of 52.4 ± 4 pNnm/radian (rad) in the case of Δt = 6 ms. C, NFT as a function of Δt for the recording rate of 5000 fps. Torque from 5 to 10 ms was regarded as consistent enough to judge the rotary torque of TA2F1. deg, degrees. Error bars represent S.E.
FIGURE 8.
FIGURE 8.
Comparison of bacterial growth conditions in relation to ATPase torque. Shown is a comparison of mild acidophilic (E. hirae), mesophilic (E. coli), thermophilic (Bacillus PS3), and thermoalkaliphilic (C. thermarum TA2.A1) A, optimal temperature and pH of growth conditions (temperature, solid symbols, left y axis; pH, empty circles, right y axis). B, torque of the ATPase. The torque value here for EF1 was derived using a method similar to that used for TF1 and TA2F1 in this study. For methodology details and appropriate references, see Table 1.

References

    1. Yoshida M., Muneyuki E., and Hisabori T. (2001) ATP synthase—a marvellous rotary engine of the cell. Nat. Rev. Mol. Cell Biol. 2, 669–677 - PubMed
    1. Dimroth P., von Ballmoos C., and Meier T. (2006) Catalytic and mechanical cycles in F-ATP synthases. Fourth in the Cycles Review Series. EMBO Rep. 7, 276–282 - PMC - PubMed
    1. Abrahams J. P., Leslie A. G., Lutter R., and Walker J. E. (1994) Structure at 2.8 Å resolution of F1-ATPase from bovine heart mitochondria. Nature 370, 621–628 - PubMed
    1. Weber J., and Senior A. E. (1997) Catalytic mechanism of F1-ATPase. Biochim. Biophys. Acta 1319, 19–58 - PubMed
    1. Morales-Rios E., Montgomery M. G., Leslie A. G., and Walker J. E. (2015) Structure of ATP synthase from Paracoccus denitrificans determined by X-ray crystallography at 4.0 Å resolution. Proc. Natl. Acad. Sci. U.S.A. 112, 13231–13236 - PMC - PubMed

MeSH terms

Substances

Associated data

LinkOut - more resources