. 2016 Sep 14:7:12700.
doi: 10.1038/ncomms12700.

The oncometabolite 2-hydroxyglutarate activates the mTOR signalling pathway

Affiliations

The oncometabolite 2-hydroxyglutarate activates the mTOR signalling pathway

Mélissa Carbonneau et al. Nat Commun. .

Abstract

The identification of cancer-associated mutations in the tricarboxylic acid (TCA) cycle enzymes isocitrate dehydrogenases 1 and 2 (IDH1/2) highlights the prevailing notion that aberrant metabolic function can contribute to carcinogenesis. IDH1/2 normally catalyse the oxidative decarboxylation of isocitrate into α-ketoglutarate (αKG). In gliomas and acute myeloid leukaemias, IDH1/2 mutations confer gain-of-function leading to production of the oncometabolite R-2-hydroxyglutarate (2HG) from αKG. Here we show that generation of 2HG by mutated IDH1/2 leads to the activation of mTOR by inhibiting KDM4A, an αKG-dependent enzyme of the Jumonji family of lysine demethylases. Furthermore, KDM4A associates with the DEP domain-containing mTOR-interacting protein (DEPTOR), a negative regulator of mTORC1/2. Depletion of KDM4A decreases DEPTOR protein stability. Our results provide an additional molecular mechanism for the oncogenic activity of mutant IDH1/2 by revealing an unprecedented link between TCA cycle defects and positive modulation of mTOR function downstream of the canonical PI3K/AKT/TSC1-2 pathway.


Figures

Figure 1
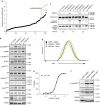
Figure 1. Activation of mTOR signalling by 2HG-producing IDH1/2 gain-of-function mutations.
(a) IDH1/2 and PTEN mutations are mutually exclusive in low-grade gliomas and glioblastomas. Data were obtained from The Cancer Genome Atlas (TCGA). Each vertical lane represents one patient; green lines depict the presence of a mutation. Statistical analysis was performed using the Fisher's exact test. (b) mTOR pathway activation in MEFs p53−/− cells expressing wt versus mutant IDH. Flag-tagged IDH was retrovirally transduced into MEFs p53−/− cells, and whole-cell lysates were harvested at 9 days post selection. Asterisk denotes a nonspecific band recognized by the antibody. (c) Intracellular accumulation of 2HG on IDH1/2 mutant expression as in b. 2HG levels were normalized against glutamate levels. Asterisks denote a statistical difference between IDH1/2 mutated cells and empty vector cells, two-sided t-test P<0.0001 (graph represents three independent experiments). Error bars represent standard deviation. (d) Increased cell size associated with mutated IDH1/2 expression. FSC measurement in FACS analysis demonstrates the shift in cell size in MEFs p53−/− cells expressing IDH1R123H (green line) or IDH2R172K (blue line) compared with empty vector-infected cells (black line). A total 250,000 cells were counted for each condition and graph is representative of four independent experiments. (e) Inhibition of mTORC1 rescues the increased cell size in IDH2R172K mutant cells. MEFs p53−/− cells expressing IDH2R172K or empty vector were treated with 25 nM rapamycin for 16 h before FACS analysis. A total 250,000 cells were counted for each condition. (f) Rapamycin or Torin1 treatment prevents mTORC1 activation in cells expressing IDH1/2 mutants. MEFs p53−/− cells expressing IDH1/2 mutants were treated with 100 nM rapamycin or 250 nM Torin1 for 24 h and whole-cell lysates blotted for markers of mTORC1 activation. (g) 2HG stimulates the mTOR pathway. MEFs p53−/− were treated with 2 mM of octyl-2HG for 4 h, and whole-cell extracts analysed by western blot. (h) Octyl-2HG treatment increases cell size. MEFs p53−/− cells were treated with 1 mM octyl-2HG for 8 h before FCS analysis by FACS. A total 25,000 cells were counted for each condition and graph is representative of two independent experiments.
Figure 2
Figure 2. Targeted-siRNA screen reveals KDM4A as an α-KG-dependent enzyme modulating mTOR activity.
(a) siRNA screen of αKG-dependent enzymes for the involvement in mTOR signalling in HeLa cells. The experiments were performed in triplicate and the results of all experiments were plotted. The levels of phosphorylated S6 on serines 240/244 were normalized to total S6 protein. (b) KDM4A knockdown increases mTORC1/2 signalling. Depletion of KDM4A by lentiviral infection in HeLa cells using three different shRNAs. Whole-cell lysates were blotted for mTORC1/2 activation. (c) Depletion of KDM4A protects against apoptosis induced by serum deprivation. HeLa cells expressing a control shRNA or shRNAs targeting KDM4A were grown in media containing the indicated concentrations of serum for 24 h. Cell lysates were then analysed by western blotting. (d) KDM4A depletion increases cell size in an mTORC1-dependent manner. MEFs p53−/− were treated with siKDM4A and, where indicated, with DMSO or 25 nM rapamycin, for 16 h before FSC measurements by FACS. A total 200,000 cells were counted for each condition. (e) Dose-dependent inhibition of KDM4A by R-2HG in in vitro demethylation assay (graph represents two independent experiments). (f) 2HG does not further stimulate mTORC1 in KDM4A-depleted HeLa cells. HeLa cells transfected with siGFP or siKDM4A were serum starved for 16 h before stimulation with 2 mM octyl-2HG for 4 h.
Figure 3
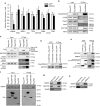
Figure 3. KDM4A interacts with the mTORC1/2 complex.
(a) Relative mRNA levels of negative and positive regulators of the PTEN/AKT/mTOR pathway following KDM4A depletion. Quantifications of mRNAs by RT–qPCR were normalized against β-actin (ActB) mRNA. Asterisks denote a statistical difference between siKDM4A-treated cells and siGFP control cells, two-sided t-test P<0.05 (graph represents two independent experiences). Error bars represent standard deviation. (b) Co-immunoprecipitation of endogenous mTORC1/2 complex members with Flag-KDM4A in 293T transfected cells. (c) Comparison of mTORC1/2-associated proteins with Flag-tagged mTOR or KDM4A. The 293T cells were transfected with either Flag-eYFP, Flag-KDM4A or Flag-mTOR, and protein lysates were subjected to anti-Flag immunoprecipitation. (d) Co-immunoprecipitation of Flag-KDM4A and HA-DEPTOR in 293T cells. (e) Endogenous KDM4A co-immunoprecipitates with Flag-DEPTOR. (f) DEPTOR PDZ domain associates with endogenous KDM4A. Flag immunoprecipitation of flag-tagged full length or fragments of DEPTOR. The samples were not sonicated in this experiment to confirm that the interaction is independent of nucleus disruption. (g) Endogenous KDM4A and DEPTOR associate in 293E cells. (h) Endogenous KDM4A and DEPTOR co-immunoprecipitate in NHA-hTERT cells.
Figure 4
Figure 4. Functional implication of IDH1/2 mutations in central neuron system-derived cells.
(a) KDM4A depletion reduces DEPTOR levels. HeLa cells were transduced with lentivirus expressing sh_KDM4A.3, sh_KDM4A.5, sh_KDM4A.7 or sh_Control and whole-cell lysates were blotted to determine DEPTOR levels. (b) The demethylase activity of KDM4A is required to block β-TrCP1-dependent ubiquitination of DEPTOR in vivo. HA IP was performed on 293E cells transfected with the indicated plasmids. (c) Quantification of DEPTOR ubiquitination by β-TrCP1 in the presence or absence of wild-type KDM4A or mutants. DEPTOR ubiquitination was quantified in three independent experiments using ImageJ. Asterisks denote a statistical difference, two-sided t-test, *P<0.05; **P<0.01. Error bars represent standard deviation. NS, not significant, P>0.05. (d) IDH1R132H expression diminishes DEPTOR levels. Flag-IDH1R132H was introduced in p53−/− MEFs by retroviral transduction and whole-cell lysates immunoblotted. (e) Inhibition of endogenous mutated IDH1R132C decreases mTOR activity in a KDM4A-dependent manner. HT1080 cells were transduced with lentivirus expressing sh_KDM4A.3 or sh_Control. The cells were treated with 3 μM AGI-5198 twice every day for 5 days and whole-cell lysates blotted for markers of mTOR activation. (f) Expression of mutant IDH1 in NHA-hTERT increases mTOR signalling. IDH1WT-Flag or IDH1R132H genes were introduced in astrocytes through retroviral infection and cell lysates were blotted for mTORC2 activation. (g) IDH1R132H overexpression increases 2HG production in astrocytes. Intracellular 2HG levels were normalized to glutamate. Asterisk denotes a statistical difference between IDH1R132H and empty vector cells, two-sided t-test P<0.0001 (graph represents three independent experiments). Error bars represent standard deviation. (h) Treatment of NHA-hTERT with octyl-2HG activates mTOR signalling. The cells were treated for 8 h with 1 mM octyl-2HG. The experiment shown is a representative of triplicates. (i) Non-canonical mTOR activation in IDH1/2WT and IDH1R132H human astrocytomas. Scale bar, 50 μm. Representative samples from IDH1/2WT (n=3) and IDH1R132H (n=3) human astrocytomas are shown.
Figure 5
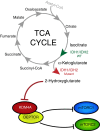
Figure 5. Non-canonical regulation of mTOR activity by 2HG-mediated inhibition of KDM4A.
Simplified schematic model for mTOR activation following KDM4A inhibition by IDH1/2 gain-of-function mutations.

References

    1. Hanahan D. & Weinberg R. A. Hallmarks of cancer: the next generation. Cell 144, 646–674 (2011). - PubMed
    1. Yan H. et al.. IDH1 and IDH2 mutations in gliomas. N. Engl. J. Med. 360, 765–773 (2009). - PMC - PubMed
    1. Mardis E. R. et al.. Recurring mutations found by sequencing an acute myeloid leukemia genome. N. Engl. J. Med. 361, 1058–1066 (2009). - PMC - PubMed
    1. Dang L. et al.. Cancer-associated IDH1 mutations produce 2-hydroxyglutarate. Nature 462, 739–744 (2009). - PMC - PubMed
    1. Ward P. S. et al.. The common feature of leukemia-associated IDH1 and IDH2 mutations is a neomorphic enzyme activity converting alpha-ketoglutarate to 2-hydroxyglutarate. Cancer Cell 17, 225–234 (2010). - PMC - PubMed

Publication types

MeSH terms

Substances