. 2016 Nov;15(21):2943-2957.
doi: 10.1080/15384101.2016.1231280. Epub 2016 Sep 13.

Mitotic cells form actin-based bridges with adjacent cells to provide intercellular communication during rounding

Affiliations

Mitotic cells form actin-based bridges with adjacent cells to provide intercellular communication during rounding

Tone A Fykerud et al. Cell Cycle. 2016 Nov.

Abstract

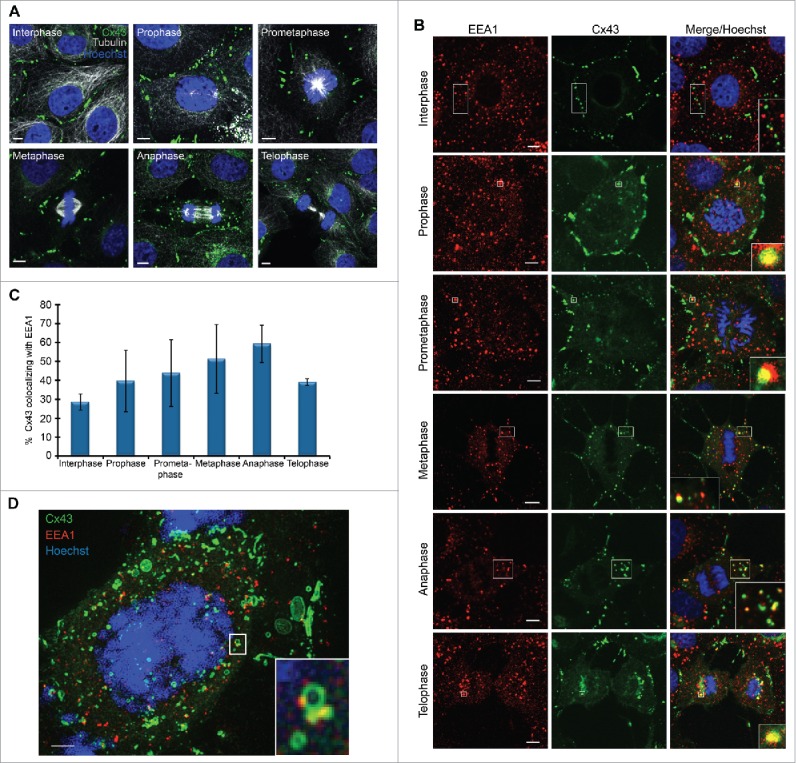
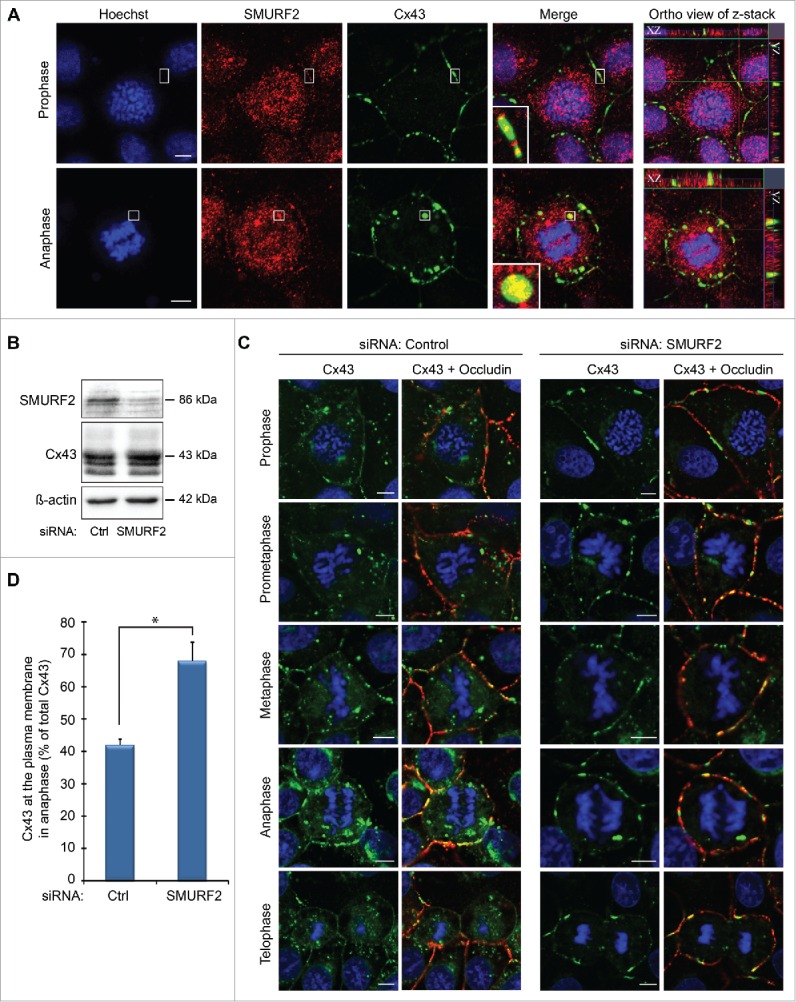
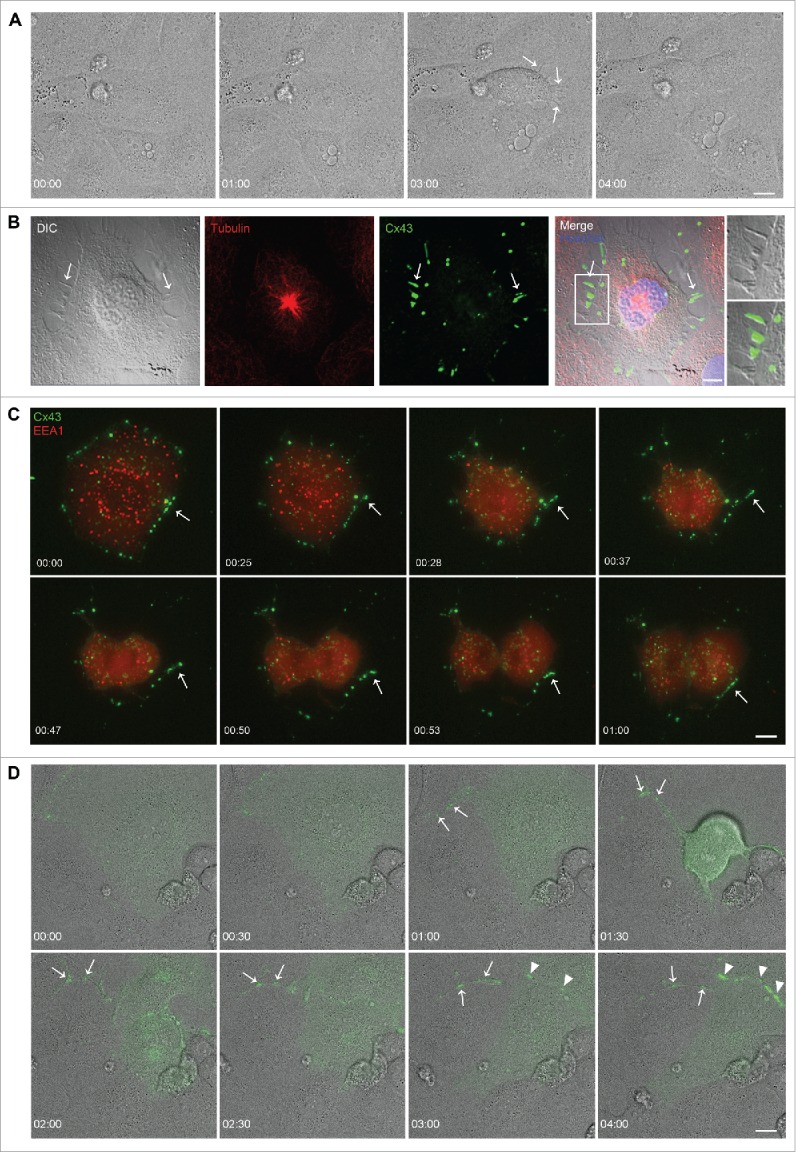
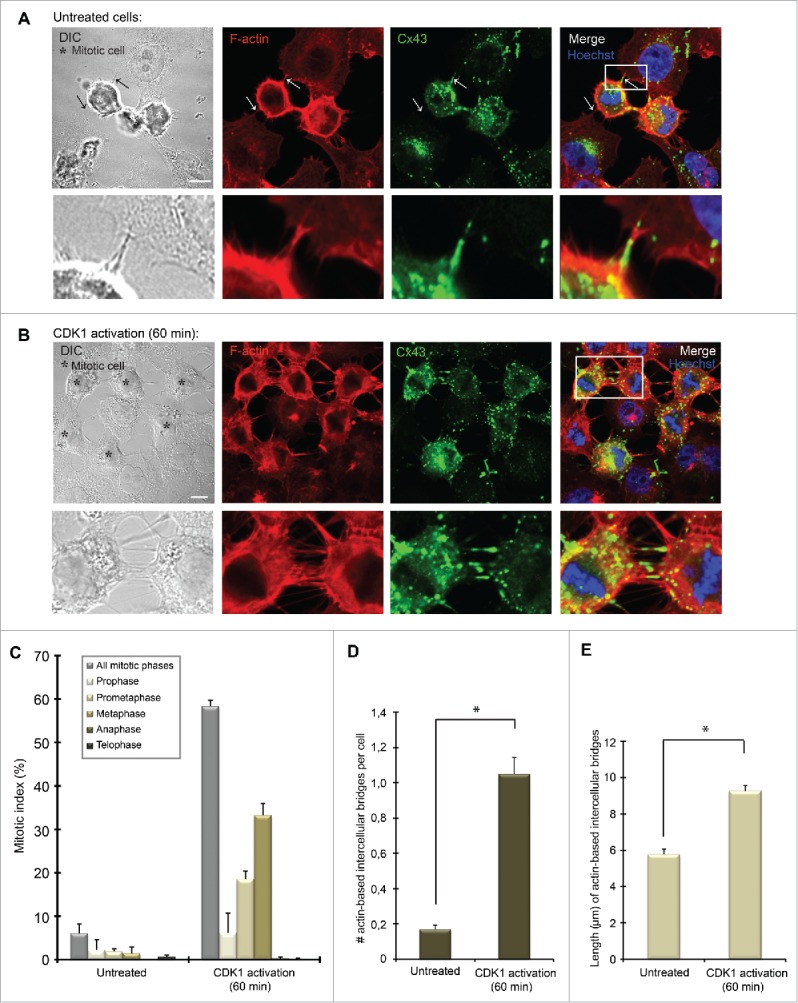
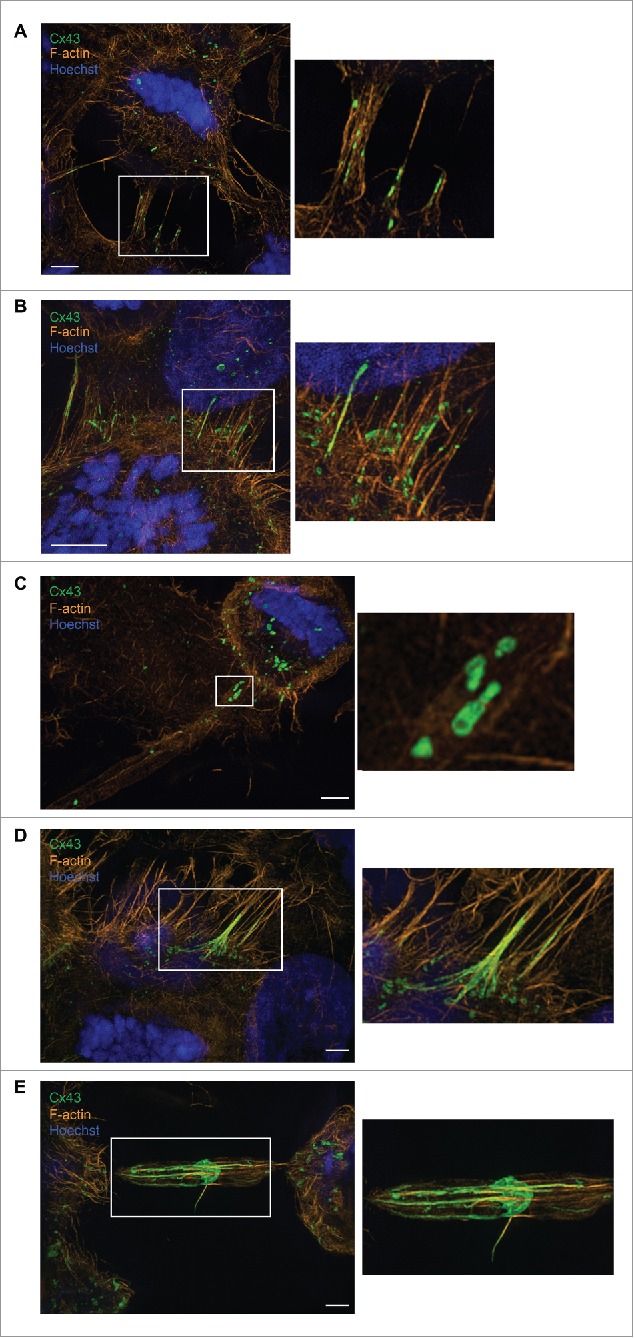
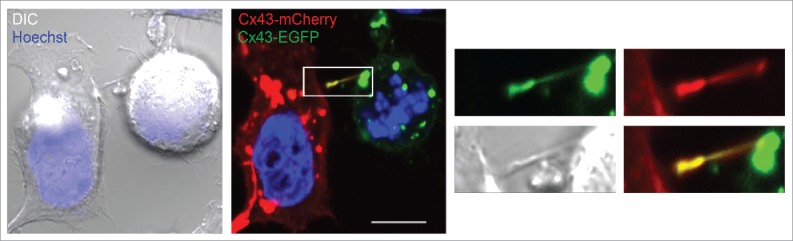
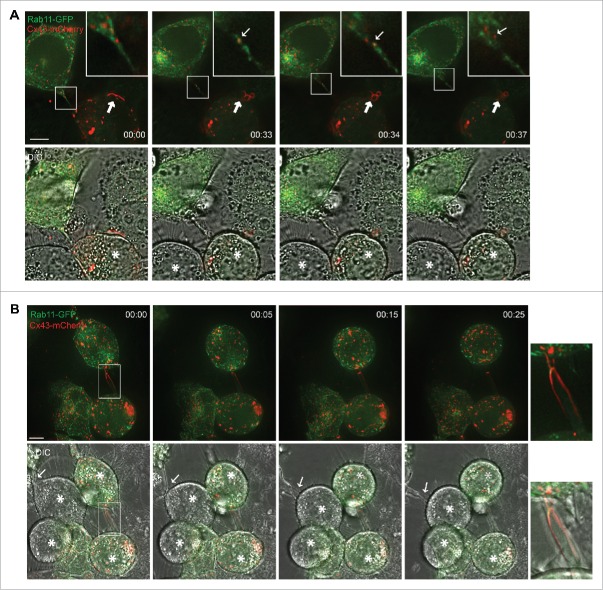
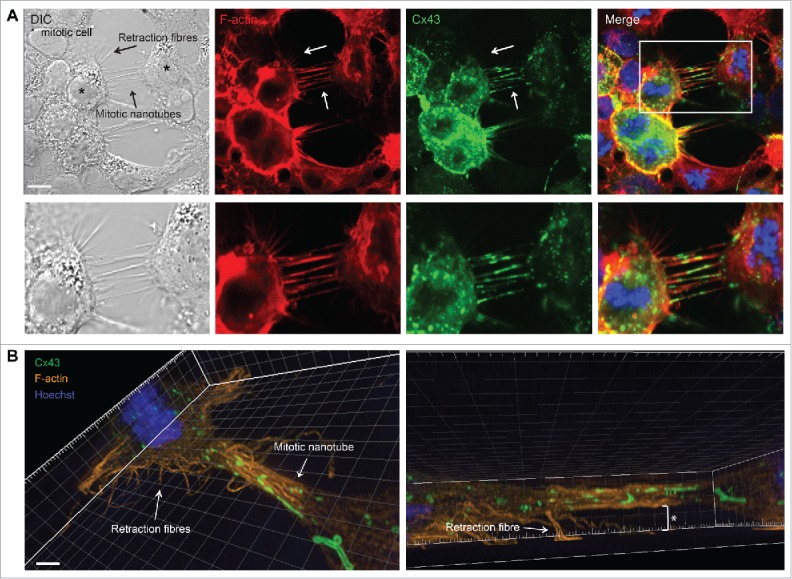
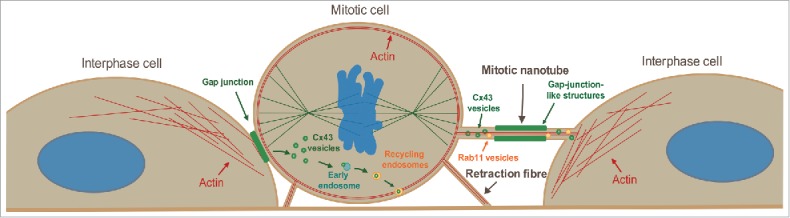
In order to achieve accurate chromosome segregation, eukaryotic cells undergo a dramatic change in morphology to obtain a spherical shape during mitosis. Interphase cells communicate directly with each other by exchanging ions and small molecules via gap junctions, which have important roles in controlling cell growth and differentiation. As cells round up during mitosis, the gap junctional communication between mitotic cells and adjacent interphase cells ceases. Whether mitotic cells use alternative mechanisms for mediating direct cell-cell communication during rounding is currently unknown. Here, we have studied the mechanisms involved in the remodeling of gap junctions during mitosis. We further demonstrate that mitotic cells are able to form actin-based plasma membrane bridges with adjacent cells during rounding. These structures, termed "mitotic nanotubes," were found to be involved in mediating the transport of cytoplasm, including Rab11-positive vesicles, between mitotic cells and adjacent cells. Moreover, a subpool of the gap-junction channel protein connexin43 localized in these intercellular bridges during mitosis. Collectively, the data provide new insights into the mechanisms involved in the remodeling of gap junctions during mitosis and identify actin-based plasma membrane bridges as a novel means of communication between mitotic cells and adjacent cells during rounding.

Keywords: actin; cell junctions; connexin; gap junction; mitosis; tunneling nanotubes.


Figures

Figure 1.
Figure 1.
A subpool of Cx43 undergoes increased endocytosis during mitosis. IAR20 cells were fixed and stained with (A) anti-Cx43 (green) and anti-tubulin (white) or (B) anti-Cx43 (green) and anti-EEA1 (red) antibodies. Cells were then visualized by fluorescence confocal microscopy, and representative images of single confocal planes showing the subcellular localization of Cx43 in the various mitotic phases were acquired using fluorescence confocal microscopy. The nuclei were stained with Hoechst (blue). Cell-cycle stages were defined by DNA staining with Hoechst. Scale bars, 5 µm. Inserts in (B) show enlarged views of subcellular structures displaying colocalization between Cx43 and EEA1. Scale bars, 5 µm. (C) The colocalization between Cx43 and EEA1 in interphase cells and in cells in the various mitotic phases was quantified in z-stacks obtained by confocal microscopy, using the IMARIS software. Values shown are the mean ± SD of three independent experiments. (D) The subcellular localization of Cx43 and EEA1 in mitotic cells was analyzed by SIM. A max projection of 57 z-stacks obtained by SIM revealed a large pool of Cx43-positive intracellular vesicles in mitotic cells. Insert shows an enlarged view of an apparent fusion between Cx43-positive vesicles (green) and early endosomes (red). Examples of z-positions from the max projection in which Cx43 and EEA1 colocalize are shown in Fig. S1. Scale bar, 2 µm.
Figure 2.
Figure 2.
SMURF2 regulates Cx43 gap junction remodelling during mitosis. (A) IAR20 cells were fixed, co-stained against Cx43 (green) and SMURF2 (red), and representative images of single confocal planes were acquired using fluorescence confocal microscopy. Cell-cycle stages were defined by DNA staining with Hoechst. Scale bars, 5 µm. (B) IAR20 cells were either transfected with non-targeting siRNA as a control or with siRNA sequences against SMURF2. After 48 hours of transfection, cell lysates were prepared and equal amounts of total cell protein were subjected to SDS-PAGE. Cx43 and SMURF2 were detected by western blotting, using anti-Cx43 and anti-SMURF2 antibodies, respectively. The blots were stripped and reprobed with anti-β-actin antibodies. (C) IAR20 cells were either transfected with non-targeting siRNA as a control or with siRNA sequences against SMURF2. After 48 hours of transfection, the cells were fixed, co-stained against Cx43 (green) and occludin (red), and representative images of single confocal planes were acquired using fluorescence confocal microscopy. The mitotic phases were determined based on DNA staining with Hoechst. Scale bars, 5 µm. (D) To quantify the percentage Cx43 in the plasma membrane compared to total Cx43, 4 to 8 cells in anaphase from 3 independent experiments were analyzed in control siRNA-transfected cells and SMURF2 siRNA-transfected cells. Values shown are the mean ± SEM *P < 0.001.
Figure 3.
Figure 3.
A subpool of Cx43 localizes in plasma membrane bridges between mitotic cells and adjacent cells. (A) IAR20 cells were subjected to DIC live cell imaging, and images were collected every minute over a period of 5.5 hours. Arrows indicate plasma membrane bridges that are formed between a mitotic cell and adjacent interphase cells as the mitotic cell rounds up. Scale bar, 10 µm. For the corresponding time-lapse movie, see Movie 1. (B) IAR20 cells were fixed, stained against tubulin (red) and Cx43 (green), and representative images of single confocal planes were acquired using fluorescence confocal microscopy. Arrows indicate plasma membrane bridges between a mitotic cell and an adjacent cell, as detected by DIC. Insets show enlarged view of representative membrane bridges. Scale bar, 10 µm. (C) IAR20 cells co-expressing Cx43-EGFP and Tomato-EEA1-CT were subjected to live cell imaging, and images were collected every minute over a 60 minutes period. Representative images of single confocal planes at various time points as indicated are shown. Arrows indicates a Cx43 pool that appears to localize in a plasma membrane bridge formed between a mitotic cell and an adjacent cell, which appears to rapidly reassemble into gap junction-like structures in the plasma membrane after the completion of mitosis. Scale bar, 10 µm. For the corresponding time-lapse movie, see Movie 2. (D) IAR20 cells transfected with Cx43-EGFP were subjected to live cell imaging including DIC. Images were collected every minute over a period of 5.5 hours. Representative images of single confocal planes at various time points as indicated are shown. Arrows indicates a Cx43 pool that localizes in a plasma membrane bridge formed between a mitotic cell and an adjacent cell. Arrowheads indicate gap junctions that are formed between the two daughter cells following mitotic exit. Scale bar, 10 µm. For the corresponding time-lapse movie, see Movie 3.
Figure 4.
Figure 4.
Characterization of plasma membrane bridges between mitotic cells and adjacent cells in non-synchronized and synchronized HeLa cells. Hela-Cx43 cells were (A) left untreated or (B) treated with RO-3306 (10 µM) for 18 hours followed by wash-out of RO-3306 and incubation in normal cell culture medium for 60 minutes. The cells were then fixed and stained against Cx43 using anti-Cx43 antibodies (green) and against F-actin using fluorophore-conjugated Phalloidin (red). The nuclei were stained using Hoechst. Representative images of single confocal planes acquired using fluorescence confocal microscopy are shown. Insets show enlarged view of representative intercellular membrane bridges. The arrow to the right in A indicates an intercellular plasma membrane bridge containing Cx43, whereas the arrow to the left indicates an intercellular plasma membrane bridge negative for Cx43. Scale bars, 10 µm. (C) The graph shows the mitotic index of control Hela-Cx43 cells and cells subjected to RO-3306 treatment for 18 hours followed by wash-out of the drug and incubation for 60 minutes in normal cell culture medium. The mitotic cells were identified and categorized according to mitotic phases on the basis of DNA staining with Hoechst, using fluorescence confocal microscopy. The mitotic index was calculated as the ratio of the number of cells undergoing mitosis to the total number of all cells (n = 628 for untreated cells, n = 614 for cells subjected to CDK1 activation for 1 hour). The number (D) and average length (E) of actin-based intercellular bridges between cells (including both interphase cells and mitotic cells) were quantified in untreated cells (n = 485) and in cells synchronized in mitosis by RO-3306 treatment (n = 259), using fluorescence confocal microscopy. Values shown are the mean ± SEM from three independent experiments. *P < 0.01.
Figure 5.
Figure 5.
Super-resolution microscopy analysis of actin-based plasma membrane bridges between mitotic cells and adjacent cells. (A-E) Hela-Cx43 cells were treated with 10 µM RO-3306 for 18 hours followed by wash-out of RO-3306 and incubation in normal cell culture medium for 60 minutes. The cells were then fixed and stained against Cx43 using anti-Cx43 antibodies (green) and against F-actin using fluorophore-conjugated Phalloidin (red). The nuclei were stained using Hoechst. The cells were analyzed by SIM, and the images acquired were then subjected to 3-dimensional reconstruction using IMARIS. Scale bars, 3 µm.
Figure 6.
Figure 6.
Analysis of Cx43 in actin-based plasma membrane bridges between mitotic cells and adjacent cells. HeLa-Cx43 cells were transiently transfected with either Cx43-EGFP (green) or with Cx43-mCherry (red) for 24 hours. The two cell populations were then trypsinized, mixed and reseeded for an additional 24 hours. The cells were treated with RO-3306 (10 µM) for 18 hours followed by wash-out of RO-3306 and incubation in normal cell culture medium for 60 minutes. The cells were then fixed and the nuclei were stained with Hoechst. The cells were visualized by fluorescence confocal microscopy. Representative images of single confocal planes are shown. Yellow color indicates colocalization between Cx43-EGFP and Cx43-mCherry. Scale bar, 10 µm.
Figure 7.
Figure 7.
Vesicles containing Rab11 and Cx43 are transported between mitotic cells and adjacent cells via the actin-based plasma membrane bridges. HeLa-Cx43 cells co-transfected with plasmids encoding Cx43-mCherry (red) and Rab11-GFP (green) were treated with RO-3306 (10 µM) for 18 hours, followed by RO-3306 wash-out and incubation in normal cell culture medium for 15 minutes. The cells were then subjected to live cell imaging, and z-stack images were taken every 50 second over a period of 40 minutes. Representative images of single confocal planes at various time points as indicated are shown. (A) The images demonstrate the trafficking of Rab11- and Cx43-positive vesicles between the mitotic cell and one of its neighboring cells via an actin-based plasma membrane bridge. Insets show vesicle transport in the mitotic nanotube in higher magnification. Small arrow shows a vesicle positive for both Rab11 and Cx43, which is transported between the mitotic cell and an adjacent interphase cell. Mitotic cells are indicated by asterisks. Large arrow indicates a gap junction in the process of being internalized and forming annular gap junctions during cell rounding. Scale bar, 7 µm. For the corresponding time-lapse movie, see Movie 4. (B) The actin-based plasma membrane bridges sometimes contained large gap junction-like structures (insets). Mitotic cells are indicated by asterisks. Arrows indicate the formation of a plasma-membrane bridge between a mitotic cell and an adjacent cell. Scale bar, 7 µm. For the corresponding time-lapse movie, see Movie 5.
Figure 8.
Figure 8.
Morphological and molecular comparison between retraction fibers and mitotic nanotubes. Hela-Cx43 cells were treated with RO-3306 (10 µM) for 18 hours followed by wash-out of RO-3306 and incubation in normal cell culture medium for 60 minutes. The cells were then fixed and stained against Cx43 using anti-Cx43 antibodies (green) and F-actin was stained using fluorophore-conjugated Phalloidin (red). The nuclei were stained using Hoechst. (A) The cells were then visualized by fluorescence confocal microscopy. Representative images of single confocal planes are shown. Scale bars, 10 µm. (B) The cells were imaged by SIM, followed by 3-dimensional reconstruction of images using the IMARIS software. The asterisk indicates the distance between the mitotic nanotube and the substratum. Scale bars, 2 µm.
Figure 9.
Figure 9.
Model on the regulation of Cx43 during mitosis. Based on the data presented in this study, we propose that mitotic cells are able to form actin-based plasma membrane bridges with adjacent cells during rounding, termed mitotic nanotubes. These structures are involved in mediating trafficking of vesicles to and from the mitotic cells and may act as plasma membrane reservoirs during cell rounding. We also propose that Cx43 is subjected to two different fates during mitosis. One subpool undergoes increased endocytosis and subsequent sorting to early endosomes and recycling endosomes. Cx43 may then undergo recycling to the plasma membrane and form de novo functional gap junctions at the mitotic exit. A second pool of Cx43 localizes in the mitotic nanotubes formed between the mitotic cell and its neighboring cells. At the completion of mitosis, both the Cx43 that localizes in the mitotic nanotubes as well as the Cx43 pool that has been internalized may reassemble to form new gap junctions between cells.

Similar articles

Cited by

References

    1. Cadart C, Zlotek-Zlotkiewicz E, Le BM, Piel M, Matthews HK. Exploring the function of cell shape and size during mitosis. Dev Cell 2014; 29:159-169; PMID:24780736; http://dx.doi.org/10.1016/j.devcel.2014.04.009 - DOI - PubMed
    1. Boucrot E, Kirchhausen T. Endosomal recycling controls plasma membrane area during mitosis. Proc Natl Acad Sci U S A 2007; 104:7939-7944; PMID:17483462; http://dx.doi.org/10.1073/pnas.0702511104 - DOI - PMC - PubMed
    1. Erickson CA, Trinkaus JP. Microvilli and blebs as sources of reserve surface membrane during cell spreading. Exp Cell Res 1976; 99:375-384; PMID:1269533; http://dx.doi.org/10.1016/0014-4827(76)90595-4 - DOI - PubMed
    1. Porter K, Prescott D, Frye J. Changes in surface morphology of Chinese hamster ovary cells during the cell cycle. J Cell Biol 1973; 57:815-836; PMID:4735453; http://dx.doi.org/10.1083/jcb.57.3.815 - DOI - PMC - PubMed
    1. Boucrot E, Kirchhausen T. Mammalian cells change volume during mitosis. PLoS One 2008; 3:e1477; PMID:18213385; http://dx.doi.org/10.1371/journal.pone.0001477 - DOI - PMC - PubMed