. 2016 Sep 27;113(39):11046-51.
doi: 10.1073/pnas.1612826113. Epub 2016 Sep 13.

High-throughput single-cell gene-expression profiling with multiplexed error-robust fluorescence in situ hybridization

Affiliations

High-throughput single-cell gene-expression profiling with multiplexed error-robust fluorescence in situ hybridization

Jeffrey R Moffitt et al. Proc Natl Acad Sci U S A. .

Abstract

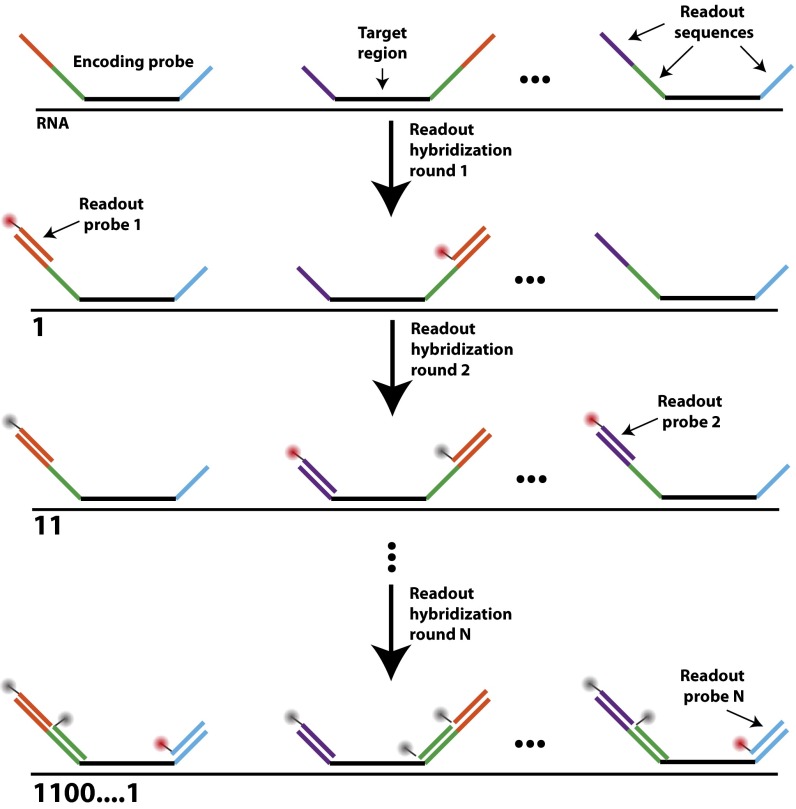
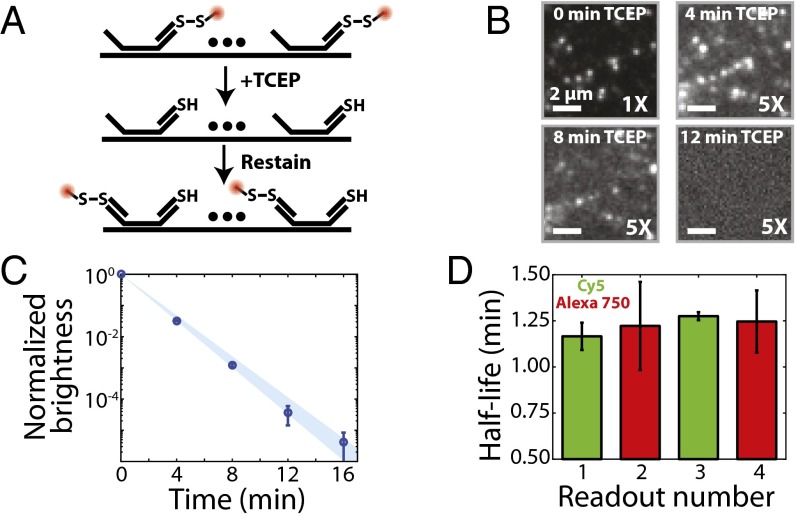
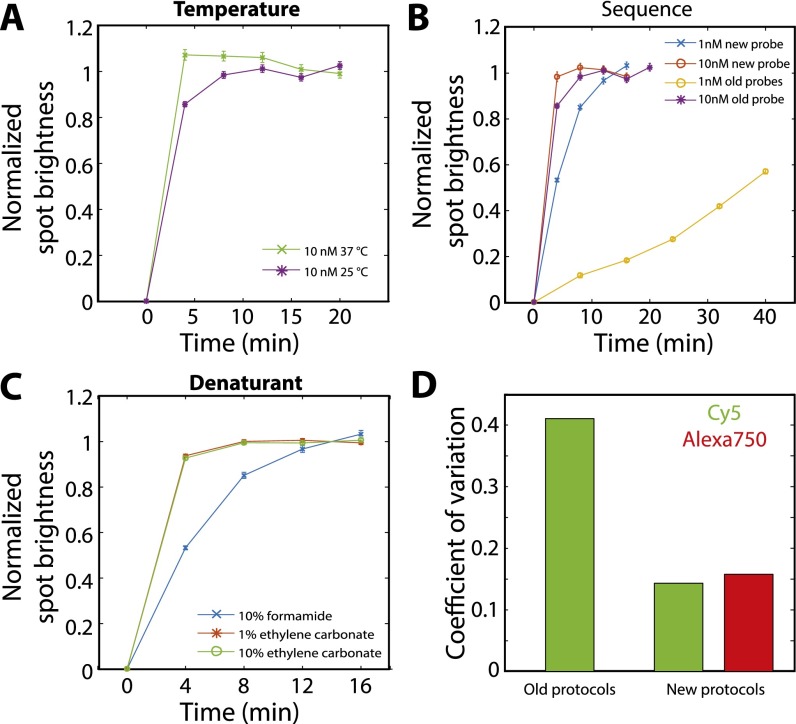
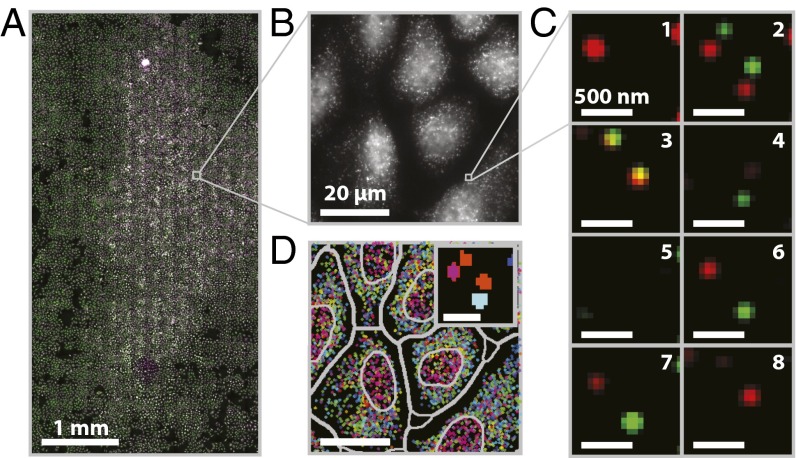
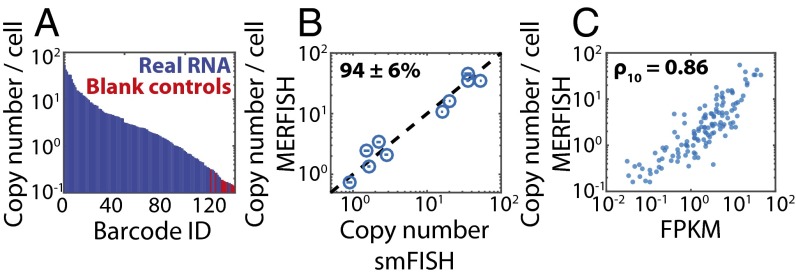
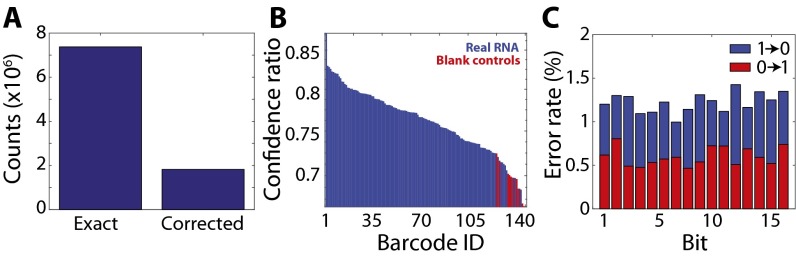
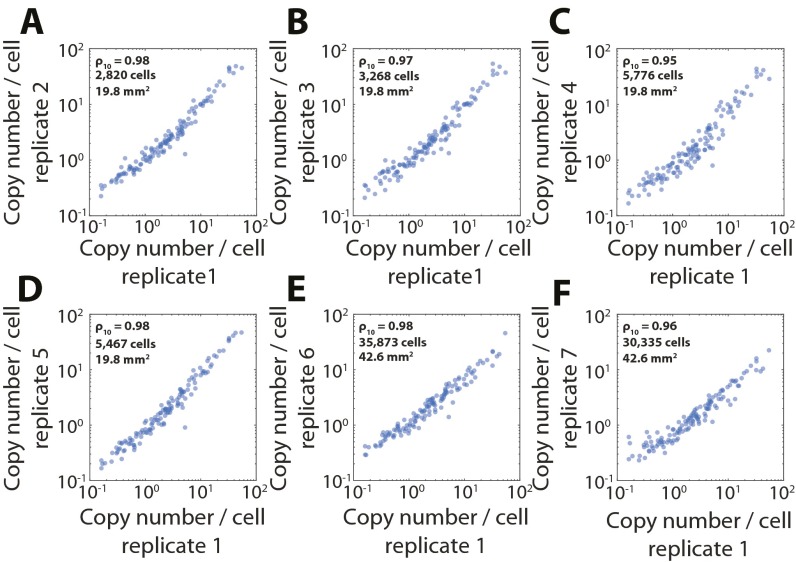
Image-based approaches to single-cell transcriptomics, in which RNA species are identified and counted in situ via imaging, have emerged as a powerful complement to single-cell methods based on RNA sequencing of dissociated cells. These image-based approaches naturally preserve the native spatial context of RNAs within a cell and the organization of cells within tissue, which are important for addressing many biological questions. However, the throughput of these image-based approaches is relatively low. Here we report advances that lead to a drastic increase in the measurement throughput of multiplexed error-robust fluorescence in situ hybridization (MERFISH), an image-based approach to single-cell transcriptomics. In MERFISH, RNAs are identified via a combinatorial labeling approach that encodes RNA species with error-robust barcodes followed by sequential rounds of single-molecule fluorescence in situ hybridization (smFISH) to read out these barcodes. Here we increase the throughput of MERFISH by two orders of magnitude through a combination of improvements, including using chemical cleavage instead of photobleaching to remove fluorescent signals between consecutive rounds of smFISH imaging, increasing the imaging field of view, and using multicolor imaging. With these improvements, we performed RNA profiling in more than 100,000 human cells, with as many as 40,000 cells measured in a single 18-h measurement. This throughput should substantially extend the range of biological questions that can be addressed by MERFISH.

Keywords: fluorescence; in situ hybridization; multiplexed imaging; single-cell analysis; transcriptomics.


Conflict of interest statement

X.Z., J.R.M., and K.H.C. are inventors on a patent applied for by Harvard University that covers the MERFISH method.

Figures

Fig. 1.
Fig. 1.
Approaches to improve the measurement throughput of MERFISH. (A) Simplified schematic of a MERFISH readout protocol. Target RNAs are stained with encoding probes that contain a barcode comprising a combination of readout sequences unique to each RNA species. The barcode then is identified through successive rounds of smFISH, each with a readout probe complementary to one readout sequence. A registered stack of smFISH images for each sample produces an ensemble of fluorescence spots with on/off patterns that define binary barcodes (“1” represents fluorescent signal on, and “0” represents fluorescent signal off) which allow individual RNA species to be identified. A more detailed hybridization and imaging procedure is shown in Fig. S1. (B) The time required to perform a MERFISH experiment for a given sample area for the published protocol (18, 23) that uses photobleaching to remove smFISH signal (red line), a modified protocol without photobleaching (purple line), a modified protocol without photobleaching and a larger FOV (green line), and a modified protocol without photobleaching, a large FOV, and two-color imaging (blue line).
Fig. S1.
Fig. S1.
Diagram of the hybridization and imaging procedure with encoding and readout probes. Encoding probes are first hybridized to each cellular RNA. Each encoding probe contains a 30-nt target region (black) that binds to the target RNA and three 20-nt readout sequences (purple, green, blue, or orange). The specific choice of readout sequences for a given RNA determines the barcode that will be used to identify it. During each readout hybridization, one readout probe complementary to a given readout sequence (depicted in orange for the first hybridization round) conjugated to a dye (red circle) is hybridized to the sample. The sample is imaged, and the fluorescence signal is eliminated (as indicated by the gray circles). This process is repeated, with a different readout probe hybridized in each of the N rounds of readout hybridization. If the readout probe in a specific round of hybridization is bound to the RNA, we assign “1” to the corresponding bit of the binary barcode of the RNA. Otherwise, a value “0” is assigned to the bit.
Fig. 2.
Fig. 2.
Reductive cleavage of disulfide-linked fluorophores removes the fluorescent signal efficiently. (A) Schematic diagram of the use of TCEP to extinguish the fluorescence signal via cleavage of a disulfide bond linking a fluorescent dye to a readout probe. (B) Images of a region of a human fibroblast (IMR-90) stained with an encoding probe for the FLNA RNA and a readout probe linked to Cy5 via a disulfide bond as a function of time exposed to 50 mM TCEP. Each panel represents the same portion of an FOV. (Scale bars: 2 µm.) Except for the upper left panel, the contrast has been increased fivefold to illustrate better the fluorescent signal remaining in the sample after TCEP treatment. (C) The average brightness of readout probe 1 bound to encoding probes targeting FLNA (normalized to the brightness before TCEP exposure) as a function of the total time of exposure to 50 mM TCEP. Error bars represent SEM (n provided in Fig. S2B), and the blue region represents the 95% confidence interval for a fit to an exponential decay. (D) The measured half-life for the average brightness when exposed to 50 mM TCEP for four readout probes (1–4), each with a different sequence and linked to either Cy5 (green) or Alexa750 (red). Error bars represent the 95% confidence interval for the fit to an exponential decay shown in C for readout probe 1 and in Fig. S2A for readout probes 2–4.
Fig. S2.
Fig. S2.
TCEP cleavage efficiently extinguishes the fluorescence signal from readout probes for different readout sequences and fluorophores. (A) The average brightness of all smFISH spots observed for labeled FLNA mRNAs in human fibroblast (IMR-90) cells as a function of the total time of exposure to cleavage buffer (50 mM TCEP in 2× SSC) for four different readout sequences (blue, green, cyan, and red) and two different fluorophores (Cy5 was conjugated to readouts 1 and 4, and Alexa750 was conjugated to readouts 2 and 3). The readout sequences are provided in Table S1. The brightness values are normalized to the values observed before TCEP treatment (time 0). (B) The fraction of smFISH spots that have a brightness greater than half the brightness determined for a single dye (either Cy5 or Alexa750) as a function of the total exposure time to TCEP cleavage buffer. The colors indicate the readout and dye combinations depicted in A. (C) Representative images of the FLNA mRNA stained with a readout probe corresponding to the first bit (Top), treated with TCEP cleavage buffer for 16 min (Middle), and restained with a readout probe corresponding to the second bit (Bottom). The error bars in A represent SEM based on the number of RNA spots observed at each time point. The numbers of RNA spots observed before TCEP treatment (time 0) were 19,696, 17,644, 20,156, 17,415 for readout probes 1, 2, 3, and 4, respectively. The number of spots determined at all other time points is specified by the survival fraction in B. Missing data points indicate times at which no spots were visible in the sample. (Scale bars: 2 µm.)
Fig. S3.
Fig. S3.
Characterization of the hybridization properties of different readout probes and different hybridization conditions. (A) The average normalized smFISH spot brightness for FLNA molecules labeled first with encoding probes and then with readout probes vs. the total time the sample is exposed to 10 nM of readout probes at 37 °C (green crosses) or at room temperature (25 °C; purple stars). The sequence of the readout probe is CGCAACGCTTGGGACGGTTCCAATCGGATC, which is one of our previously published readout probe sequences. The hybridization buffer is our previously published, formamide-based hybridization buffer (18, 23). (B) The average normalized smFISH spot brightness as in A but with the sample stained with 10 nM of a previously published 30-nt four-letter readout probe (purple stars; reproduced from A), 10 nM of a 20-nt three-letter readout probe (ATCCTCCTTCAATACATCCC) that does not contain G (red circles), 1 nM of the previously published 30-nt four-letter readout probe (orange circles), or 1 nM of a 20-nt three-letter readout probe (blue crosses). Hybridization was conducted at room temperature in the formamide-based buffer. (C) The average normalized smFISH spot brightness as in A for 1 nM of a 20-nt three-letter readout probe hybridized at room temperature but using different buffers: a hybridization buffer containing 10% formamide as described previously (18, 23) (blue crosses, reproduced from B), a hybridization buffer in which formamide was replaced with 1% (vol/vol) ethylene carbonate (red stars), or a hybridization buffer with 10% (vol/vol) ethylene carbonate (green circles). (D) The coefficient of variation (the SD divided by the mean) for the average brightness of smFISH spots across all rounds of imaging in the 16-bit MERFISH experiment conducted with the previously published 30-nt readout probes and formamide-based hybridization protocol (18, 23) (old protocols) and with the readout protocols published here (new protocols; 20-nt 3-letter readout sequence and an ethylene-carbonate–based hybridization protocol). Error bars in AC represent SEM across all measured RNA spots; more than 10,000 RNA spots were measured for each data point.
Fig. S4.
Fig. S4.
Thresholding of RNA signals based on area and brightness. (A) Histogram of the log10 brightness for all observed single-RNA-molecule signals from the data presented in Fig. 3. The gray dashed line defines the brightness threshold used to discard dim single-molecule signals that likely represent background rather than real RNA signals. (B) Scatter plot of the observed log10 brightness for single-molecule signals with a given area (gray markers), i.e., the number of contiguous pixels assigned to the same RNA molecule, with the associated probability distributions (cyan). For clarity, only 1,000 randomly selected single-molecule signals are plotted for each area. Note that single-molecule signals with smaller areas also tend to be low brightness. The gray dashed lines represent the cuts applied to separate spurious background signals from foreground RNA signals, i.e., a brightness greater than 100.75 and an area of four pixels or larger.
Fig. 3.
Fig. 3.
A MERFISH measurement of an ∼20 mm2 sample area (∼15,000 cells). (A) Mosaic image of a 3.2 × 6.2 mm region of cultured U-2 OS cells stained with DAPI (purple), encoding probes for 130 RNAs and a Cy5-labeled readout probe (green). (Scale bar: 1 mm.) (B) Image of the Cy5 channel in the first round of readout hybridization for the small portion of the field in A marked by the gray square. (Scale bar: 20 µm.) (C) Two-color images of the smFISH stains for all eight rounds of hybridization and imaging for the small portion of the field in B marked by the gray square after the application of a high-pass filter to remove background, deconvolution to tighten spots, and a low-pass filter to connect spots in different images more accurately (SI Materials and Methods). Green, red, and orange represent the Cy5 channel, the Alexa750 channel, and the overlay between the two, respectively. (Scale bars: 500 nm.) (D) The decoded barcodes for the region shown in B. Spots represent individual molecules color-coded based on their RNA species identities (barcodes). Both the nuclear boundaries and the boundaries used to assign RNAs to individual cells are depicted (gray). (Scale bar: 20 µm.) (Inset) An image of the barcode assignment (indicated by color) for each pixel in the images shown in C. (Scale bar: 500 nm.)
Fig. 4.
Fig. 4.
Performance of the high-throughput MERFISH measurements. (A) The average RNA copy numbers per cell measured in Fig. 3 sorted from largest to smallest abundance. Barcodes assigned to real RNAs are marked in blue, and those not assigned to RNAs, i.e., blank controls, are marked in red. (B) The average RNA copy numbers per cell determined via MERFISH vs. that determined via conventional smFISH for 10 of the 130 RNAs. The dashed line represents equality. The average ratio of counts determined by MERFISH to that determined by smFISH indicates a calling rate (mean ± SEM) of 94 ± 6% (n = 10). Plotted error bars represent the SEM across the number of measured cells (>300 cells) for each gene measured via smFISH. (C) The average RNA copy number per cell determined by MERFISH vs. the abundance as determined by bulk sequencing. The Pearson correlation coefficient between the log10 values (ρ10) is 0.86 with a P value of 6 × 10−39. FPKM, fragments per kilobase per million reads.
Fig. S5.
Fig. S5.
Additional metrics to evaluate the performance of MERFISH measurements. (A) The total number of RNAs decoded without (Exact) and with (Corrected) error correction. (B) The confidence ratio for all barcodes representing real RNAs (blue) and the blank controls (red) sorted from largest to smallest value. The confidence ratio for any given gene (or barcode) is defined as the ratio between the number of exact matches to this barcode and the total number of exact matches to this barcode plus matches with single-bit errors. Of the 130 barcodes encoding real RNAs, 123 have a confidence ratio larger than that of the largest confidence ratio of the blank barcodes. (C) The error rate (the fraction of measured barcodes that contain a given bit flip) for each bit. Both 1-to-0 error rates (blue) and 0-to-1 error rates (red) are shown for each bit. The data presented in this figure represent the error properties of the dataset presented in Fig. 3 and are representative of those observed for all other datasets.
Fig. S6.
Fig. S6.
Reproducibility of high-throughput MERFISH measurements. (A) The average RNA copy number per cell for a replicate MERFISH measurement vs. that shown in Fig. 3. ρ10 represents the Pearson correlation coefficient between the log10 copy numbers. (BF) As in A but for five additional MERFISH measurements. The strong correlation between these values shows the high reproducibility of MERFISH measurements. The number of segmented cells and the total imaged area are also listed for replicates 2–7. The number of segmented cells and the total imaged area for replicate 1 is described in the main text. The P values for all Pearson correlation coefficients are less than 1 × 10−71.
Fig. 5.
Fig. 5.
Characterizing the expression differences of a subpopulation of cells undergoing DNA replication or cell division. (A) Violin plot of the distribution of total DAPI intensity for individual cells. The dashed line defines the intensity threshold (based on a local minimum) used to group cells with low DAPI signal into group 1 and cells with high DAPI signal into group 2. Gray dots indicate the values for individual cells, and the blue-shaded area represents the probability distributions. For clarity, only 1,000 randomly selected cells are displayed. (B) The log2 ratio of the mean fractional expression level of each RNA species in group 2 relative to that of group 1. The fractional expression level for an RNA species is defined as the copy number of that RNA divided by the total copy number of all 130 RNAs detected in the cell. The mean and SEM are computed across three biologic replicates. Green and red markers indicate genes further examined in C. (C) Violin plots of the distribution of expression levels for individual genes within group 1 (blue) or group 2 (red) for the 10 genes with the largest magnitude of up-regulation (Upper; marked green in B) or the 10 genes with the largest magnitude of down-regulation (Lower; marked red in B) in group 2 relative to group 1. The solid black lines represent the mean, and the colored curves represent the probability distributions. The gray dots represent the expression levels for 1,000 randomly selected cells. (D) A small region of one dataset showing the location of MALAT1 (gray), CENPF (red), and CKAP5 (green). The gray lines represent the boundaries of cells (segmented based on the density profile of all 130 measured RNAs). Note that MALAT1 clearly defines the nucleus. (E) The Pearson correlation coefficient for the relative expression of CENPF (red) or CKAP5 (green) observed between pairs of cells separated by various distances. The cell–cell separation index is defined as 1 for any given cell and its nearest neighbor, 2 for any given cell and its second closest neighbor, and so forth. These correlations were calculated for all cells within each of the three datasets and then were averaged across these datasets.

References

    1. Sandberg R. Entering the era of single-cell transcriptomics in biology and medicine. Nat Methods. 2014;11(1):22–24. - PubMed
    1. Eberwine J, Sul J-Y, Bartfai T, Kim J. The promise of single-cell sequencing. Nat Methods. 2014;11(1):25–27. - PubMed
    1. Shapiro E, Biezuner T, Linnarsson S. Single-cell sequencing-based technologies will revolutionize whole-organism science. Nat Rev Genet. 2013;14(9):618–630. - PubMed
    1. Shalek AK, et al. Single-cell transcriptomics reveals bimodality in expression and splicing in immune cells. Nature. 2013;498(7453):236–240. - PMC - PubMed
    1. Shalek AK, et al. Single-cell RNA-seq reveals dynamic paracrine control of cellular variation. Nature. 2014;510(7505):363–369. - PMC - PubMed

Publication types