. 2016 Aug 30:9:75.
doi: 10.3389/fnmol.2016.00075. eCollection 2016.

Causal Interrogation of Neuronal Networks and Behavior through Virally Transduced Ivermectin Receptors

Affiliations

Causal Interrogation of Neuronal Networks and Behavior through Virally Transduced Ivermectin Receptors

Horst A Obenhaus et al. Front Mol Neurosci. .

Abstract

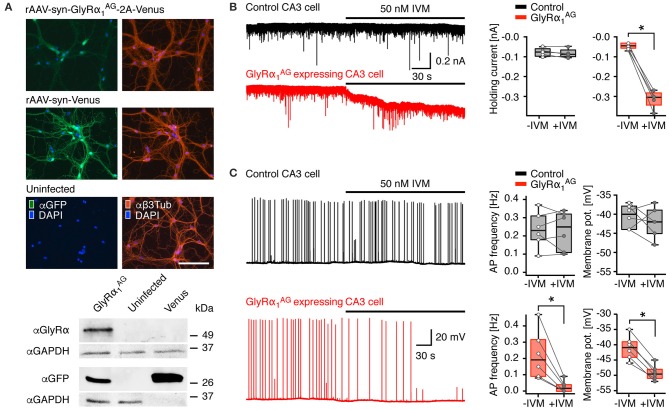
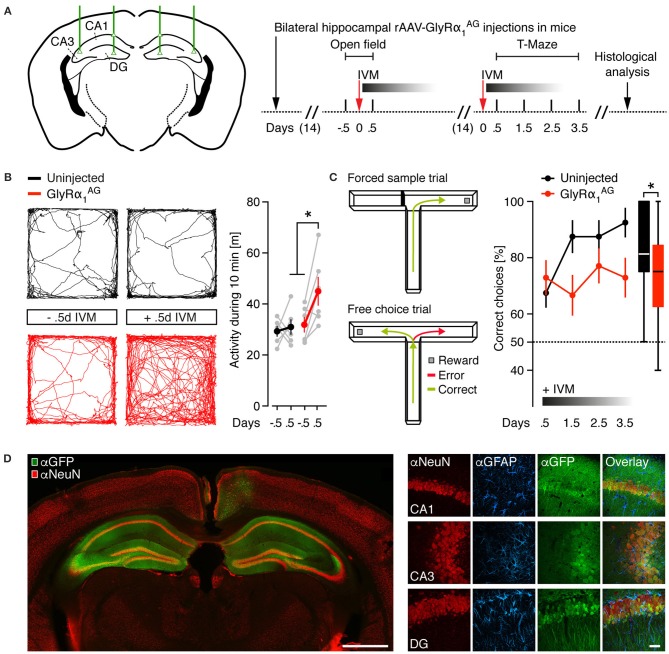
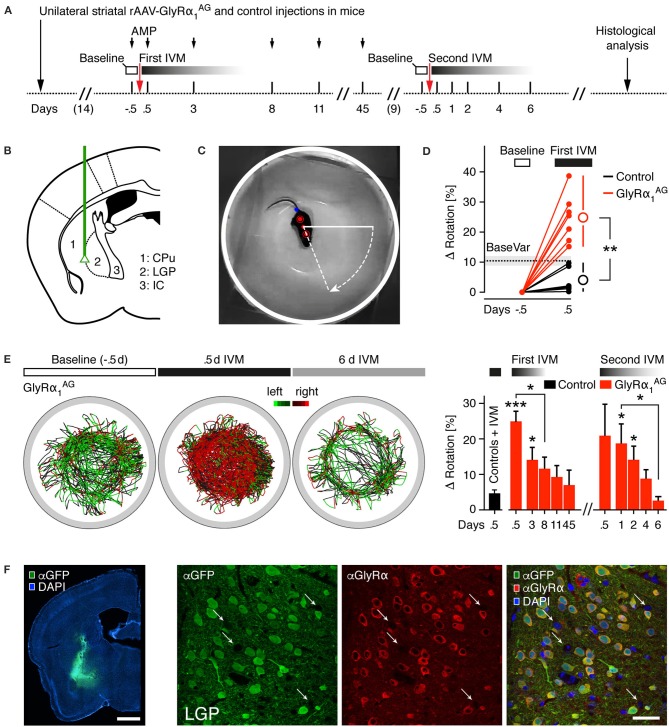
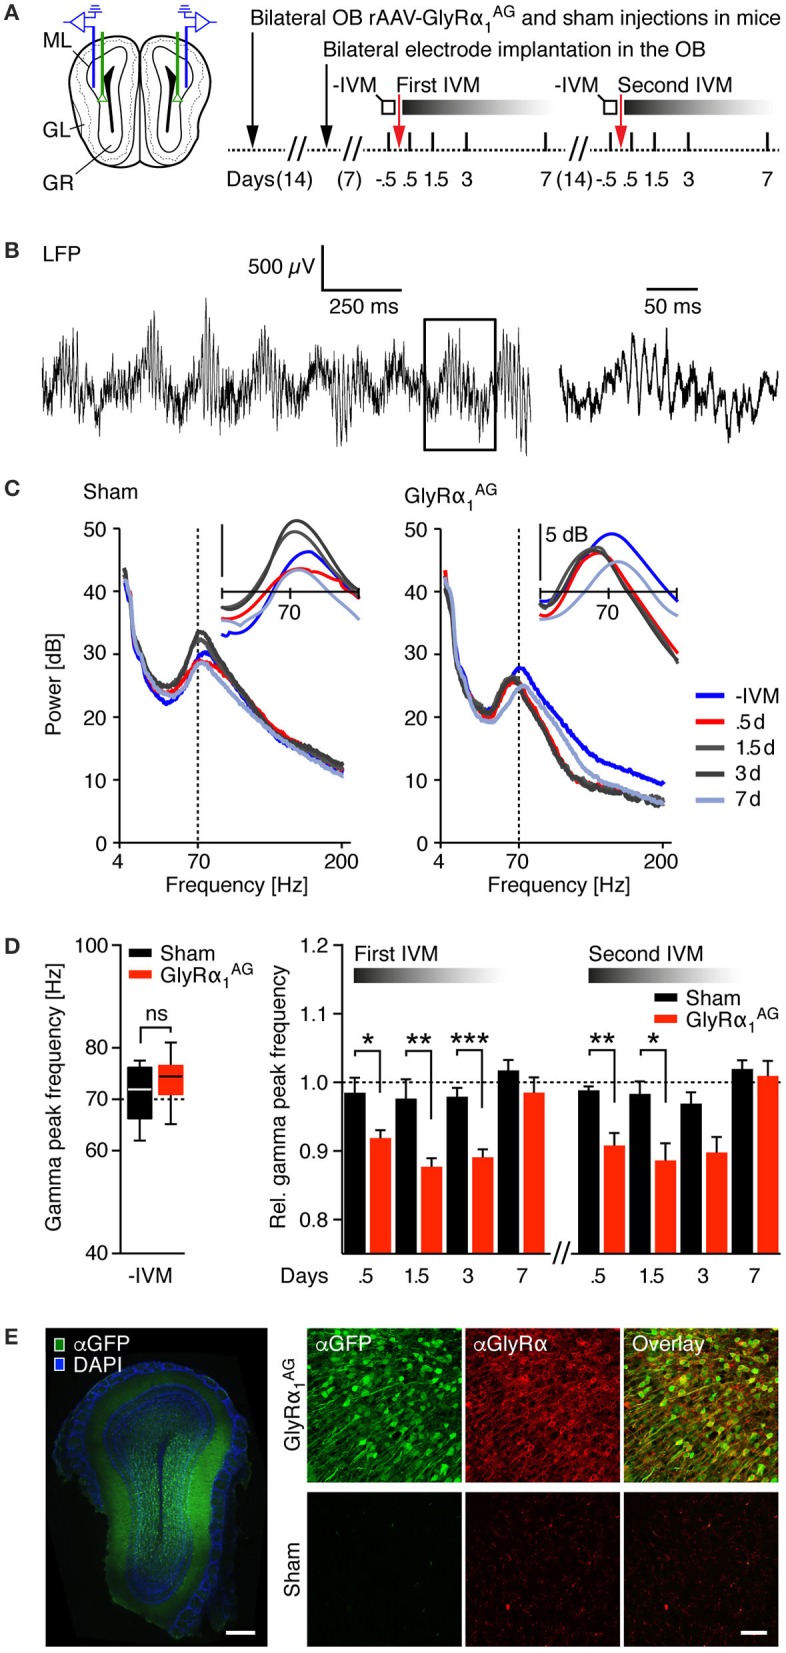
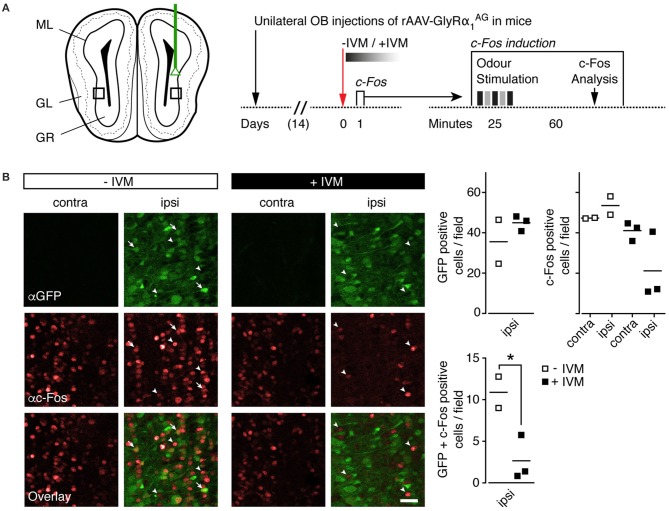
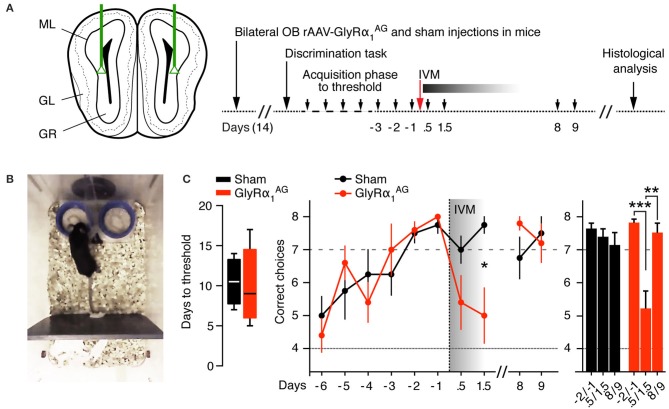
The causal interrogation of neuronal networks involved in specific behaviors requires the spatially and temporally controlled modulation of neuronal activity. For long-term manipulation of neuronal activity, chemogenetic tools provide a reasonable alternative to short-term optogenetic approaches. Here we show that virus mediated gene transfer of the ivermectin (IVM) activated glycine receptor mutant GlyRα1 (AG) can be used for the selective and reversible silencing of specific neuronal networks in mice. In the striatum, dorsal hippocampus, and olfactory bulb, GlyRα1 (AG) promoted IVM dependent effects in representative behavioral assays. Moreover, GlyRα1 (AG) mediated silencing had a strong and reversible impact on neuronal ensemble activity and c-Fos activation in the olfactory bulb. Together our results demonstrate that long-term, reversible and re-inducible neuronal silencing via GlyRα1 (AG) is a promising tool for the interrogation of network mechanisms underlying the control of behavior and memory formation.

Keywords: glycine receptor; ivermectin; neuronal silencing; odor discrimination; rAAV.


Figures

Figure 1
Figure 1
GlyRα1AG expression in transduced hippocampal primary neurons and acute slices of virus injected mice. (A) Top: Rat hippocampal primary neurons infected with rAAV-syn-GlyRα1AG-2A-Venus, rAAV-syn-Venus, and uninfected control; left column: Venus fluorescence amplified with an anti-GFP immunostain (αGFP, green); right column anti-Beta3Tubulin (αβ3Tub, red). The rAAV-syn-GlyRα1AG-2A-Venus infected cells show regular morphology and branching compared to rAAV-syn-Venus infected and uninfected cells; nuclei stained with DAPI (blue); scale bar 125 μm. Bottom: Cut outs of αGlyRα, αGFP and αGAPDH immunoblots of primary neuron cell extracts infected with rAAV-syn-GlyRα1AG-2A-Venus (GlyRα1AG), rAAV-syn-Venus (Venus), and uninfected cells. Please note that for αGFP blots the protein amount of rAAV-syn-Venus infected cell extracts loaded was 1 μg as compared to 10 μg for all other lanes shown. The full version of the immunoblot is presented in Supplementary Figure 1. (B) Patch clamp recordings from acute brain slices of mice injected with either rAAV-syn-GlyRα1AG-2A-Venus or rAAV-syn-Venus (control) into the hippocampus. IVM application failed to trigger any detectable current in CA3 pyramidal cells in slices from control animals (black trace), but activated a strong outward chloride current in Venus positive cells in slices from rAAV-syn-GlyRα1AG-2A-Venus injected animals (red trace); box plots (right) show cumulative data from n = 5 cells each (median, 25th/75th percentile); *p < 0.05 (C) IVM bath application had no effect on the AP frequency or the membrane potential of control neurons (representative black trace) but lead to a strong decrease in AP frequency and membrane potential in GlyRα1AG expressing CA3 pyramidal cells (representative red trace); box plots on the right summarize data from all recorded neurons (median, 25th/75th percentile); *p < 0.05. The open and filled circles represent AP frequency and membrane potential in individual experiments before and after IVM application (n = 6, except membrane potential of controls with n = 5), respectively.
Figure 2
Figure 2
IVM induced hyperactivity and spatial working memory impairment in mice with bilateral neuronal expression of GlyRα1AG in the dorsal hippocampus. (A) Left: Injection scheme, green lines and triangles indicate the coordinates used for bilateral stereotactic rAAV-syn-GlyRα1AG-2A-Venus injections into the dorsal hippocampus of mice (DG, dentate gyrus; CA1 and CA3, cornu ammonis 1 and 3). Right: Time line of the experiment. (B) Left: Representative trace diagrams in an open field of one virus uninjected control and one GlyRα1AG transduced mouse before (−0.5 d) and after (+0.5 d) IVM exposure. Right: GlyRα1AG transduced mice showed a hyperactive phenotype 0.5 days after the i.p. injection of IVM; GlyRα1AG n = 6, Uninjected n = 6; data shown as means ± SEM; *p < 0.05. (C) Left: The two phases of the T-Maze rewarded alternation task: One arm is randomly blocked in the first trial (Forced sample trial) and re-opened in the second trial (Free choice trial); alternations in the free choice trial are counted as correct, while re-entries into the same arm as entered in the forced sample trial are counted as error. Right: 0.5–3.5 days after IVM injection, GlyRα1AG expressing mice performed worse than virus uninjected control mice in the rewarded alternation task; GlyRα1AG n = 6, Uninjected n = 5; data shown as means ± SEM; box plot on the right shows cumulative data over all days and trials (median, 25th/75th percentile, *p < 0.05). (D) Left: Representative image of a coronal brain section from one rAAV-syn-GlyRα1AG-2A-Venus injected mouse [αNeuN (red) and αGFP (green) staining]; Venus expression is prominent in both hippocampi; scale bar: 1 mm. Right: Confocal imaging (maximum intensity projections) of hippocampal subregions in coronal brain slices from a rAAV-syn-GlyRα1AG-2A-Venus injected mouse, immunostained for αNeuN (red), αGFAP (blue), and αGFP (green); note colocalization of NeuN and GFP fluorescences; scale bar: 20 μm.
Figure 3
Figure 3
Unilateral expression of GlyRα1AG in the striatum of mice leads to a rotational phenotype after intraperitoneal IVM injection. (A) Time line of the experiment (AMP, amphetamine; IVM, ivermectin); injection time points of IVM are shown as arrows. (B) Injection sites; green line indicates path of injection cannula for unilateral striatal rAAV-syn-GlyRα1AG-2A-Venus and mock control (rAAV-syn-GlyRα1-2A-Venus and rAAV-syn-Venus) injections. Subregions depicted: CPu, caudate putamen; LGP, lateral globus pallidus; IC, internal capsule. (C) Camera picture and overlay showing the automatic extraction of three points on the mouse body (red dots) used to trace the rotation angle; tail point is marked in blue. (D) The baseline variability (BaseVar) of the rotational bias was quantified for all control mice on trials without preceding IVM injection; the i.p. injection of IVM led to a strong increase in rotational bias in all GlyRα1AG expressing mice 0.5 days after IVM exposure as compared to IVM treated, mock injected control animals; open circles indicate group averages (ΔRotation: Difference to baseline bias). (E) Left: Example trace diagrams of a mouse injected with rAAV-syn-GlyRα1AG-2A-Venus in the left hemisphere (45 min per trace), color coded for left (green) and right (red) turns; 0.5 days after IVM injection a strong bias to the right was found, which reversed after 6 days. Right: Time course of rotational bias after the first (2.5 mg/kg) and second (1.5 mg/kg) IVM injections in GlyRα1AG expressing mice; first bar on the left (black) shows all mock injected control mice 0.5 days after IVM injection (Controls + IVM, pooled first and second IVM injection); stars on top of bars indicate statistical significance vs. Controls + IVM (first bar on the left); 3.5 mg/kg AMP was injected i.p. 10 min before the recording started (First IVM). First IVM: GlyRα1AG n = 7, Control n = 6; Second IVM: GlyRα1AG n = 5; Control n = 5; data are shown as means ± SEM; *p < 0.05, **p < 0.01, ***p < 0.001. (F) Left: Representative image of a coronal brain section of a rAAV-syn-GlyRα1AG-2A-Venus injected mouse, immunostained for Venus (αGFP, green) and counterstained with DAPI (blue); scale bar 1 mm. Right: Maximum intensity projections of confocal microscopy images acquired in a brain slice in the injected region (LGP), immunostained for Venus (αGFP, green) and GlyRα1AG (αGlyRα, red), counterstained with DAPI (blue). Note GlyRα staining surrounding Venus expressing neurons; white arrows indicate putative uninfected neurons; scale bar: 40 μm.
Figure 4
Figure 4
IVM induced shifts toward slower gamma oscillations in the olfactory bulb of mice expressing GlyRα1AG. (A) Left: Injection scheme; green lines indicate the path of the injection cannula for bilateral stereotactic rAAV-syn-GlyRα1AG-2A-Venus and sham (PBS) injections, and blue lines symbolize the position of the recording electrodes in the OB. Right: Time line of the experiment. Local field potentials (LFPs) were analyzed twice for 10 min in freely moving mice in an open arena on the days indicated. (B) Example raw signal of an intracranial LFP recording. Left: Fast oscillations overlying a slower rhythm are clearly visible. Right: Magnification of the box shown on the left shows fast oscillations in the gamma range. (C) Frequency analysis of LFPs (4–200 Hz) for one sham (left) and one GlyRα1AG expressing mouse (right) over 10 min recordings; colors indicate recordings on different days over the time course of 1 week; vertical dashed line at 70 Hz is shown for reference. Inset: smoothed frequency analysis in the 40–100 Hz range. (D) Left: Baseline gamma peak frequencies (pooled first and second IVM injection); ns, not significant (p > 0.05); median, 25th/75th percentile. Right: Relative gamma peak frequencies normalized to baseline during 1 week after IVM; a substantial shift in the relative gamma peak frequency was observable 0.5, 1.5, and 3 days after IVM treatment in the OBs of rAAV-syn-GlyRα1AG-2A-Venus but not sham injected mice. First IVM: GlyRα1AG n = 4, sham n = 4 (1.5d: GlyRα1AG n = 3, sham n = 2); second IVM: GlyRα1AG n = 3, sham n = 2. Data shown as mean ± SEM; *p < 0.05; **p < 0.01; ***p < 0.001. (E) Left: Stereotactic injection of rAAV-syn-GlyRα1AG-2A-Venus into the OB yielded broad expression of Venus (αGFP, green) at the injection site; counterstained for DAPI (blue); scale bar: 250 μm. Right: Confocal imaging revealed over-expression of GlyRα1AG (αGlyRα, red) in Venus (αGFP, green) positive neurons; scale bar: 40 μm.
Figure 5
Figure 5
IVM induced GlyRα1AG activation lead to a decrease in odor induced c-Fos expression in the olfactory bulb. (A) Left: Scheme of unilateral stereotactic OB injection of rAAV-syn-GlyRα1AG-2A-Venus. Black squares indicate approximate size and position of fields shown in (B). ML, mitral/tufted cell layer; GL, glomerular layer; GR, granule cell layer. Right: Time line of the experiment; the c-Fos induction protocol used 1 day after IVM injection is shown on the right. (B) Left: Fields of 150 × 150 μm were evaluated for c-Fos (αc-Fos, red) and Venus (αGFP, green) expression. Without IVM injection (−IVM), the number of c-Fos immunoreactive cells was comparable on contra- and ipsilateral sides; after the injection of IVM (+IVM), the number of c-Fos immunoreactive cells and the number of GFP and c-Fos double labeled cells decreased steeply on the ipsilateral side (arrow tips: c-Fos only labeled cells, whole arrows: GFP/c-Fos double positive cells); scale bar: 30 μm. Right: Quantification of GFP and c-Fos positive cells (top row) and GFP/c-Fos double positive cells (bottom row), numbers per 150 × 150 μm; horizontal line indicates mean; GlyRα1AG +IVM, n = 3; GlyRα1AG −IVM, n = 2; *p < 0.05.
Figure 6
Figure 6
IVM induced GlyRα1AG activation in the olfactory bulb lead to a deficit in odor discrimination. (A) Left: Scheme of bilateral stereotactic rAAV-syn-GlyRα1AG-2A-Venus and sham (PBS) injections into the OB. Right: Time line of the experiment. Small black arrows indicate days on which olfactory discrimination testing was performed. (B) Picture of the apparatus used in the discrimination test; the lids (blue) were scented with two odors of which only one was rewarded; both lids could be quickly removed from the apparatus if mice started to dig on the side with the wrong odor. (C) Left: The number of days in the acquisition phase required to reach the threshold criterion did not differ significantly in between groups (median, 25th/75th percentile, p > 0.05). Middle: 0.5–1.5 days after IVM injection, GlyRα1AG expressing mice performed worse than on the 3 days prior to injection and compared to sham injected mice; mice recovered from this deficit 8 days after IVM injection. Right: Comparison of pairs of test days, each: -2 d and -1 d prior to, 0.5 d and 1.5 d after, and +8 d and +9 d after, IVM injection; GlyRα1AG n = 5, Sham n = 4. Data shown as means ± SEM; *p < 0.05, **p < 0.01, ***p < 0.001.

Similar articles

Cited by

References

    1. Abraham N. M., Egger V., Shimshek D. R., Renden R., Fukunaga I., Sprengel R., et al. . (2010). Synaptic inhibition in the olfactory bulb accelerates odor discrimination in mice. Neuron 65, 399–411. 10.1016/j.neuron.2010.01.009 - DOI - PMC - PubMed
    1. Adamson T. W., Kendall L. V., Goss S., Grayson K., Touma C., Palme R., et al. . (2010). Assessment of carprofen and buprenorphine on recovery of mice after surgical removal of the mammary fat pad. J. Am. Assoc. Lab. Anim. Sci. 49, 610–616. - PMC - PubMed
    1. Adelsberger H., Lepier A., Dudel J. (2000). Activation of rat recombinant α1β2γ2S GABAA receptor by the insecticide ivermectin. Eur. J. Pharmacol. 394, 163–170. 10.1016/S0014-2999(00)00164-3 - DOI - PubMed
    1. Armbruster B. N., Li X., Pausch M. H., Herlitze S., Roth B. L. (2007). Evolving the lock to fit the key to create a family of G protein-coupled receptors potently activated by an inert ligand. Proc. Natl. Acad. Sci. U.S.A. 104, 5163–5168. 10.1073/pnas.0700293104 - DOI - PMC - PubMed
    1. Barber D. L., Blackburn T. P., Greenwood D. T. (1973). An automatic apparatus for recording rotational behavior in rats with brain lesions. Physiol. Behav. 11, 117–120. - PubMed