. 2016 Aug 4;2(8):e00136.
doi: 10.1016/j.heliyon.2016.e00136. eCollection 2016 Aug.

Metric projection for dynamic multiplex networks

Affiliations

Metric projection for dynamic multiplex networks

Giuseppe Jurman. Heliyon. .

Abstract

Evolving multiplex networks are a powerful model for representing the dynamics along time of different phenomena, such as social networks, power grids, biological pathways. However, exploring the structure of the multiplex network time series is still an open problem. Here we propose a two-step strategy to tackle this problem based on the concept of distance (metric) between networks. Given a multiplex graph, first a network of networks is built for each time step, and then a real valued time series is obtained by the sequence of (simple) networks by evaluating the distance from the first element of the series. The effectiveness of this approach in detecting the occurring changes along the original time series is shown on a synthetic example first, and then on the Gulf dataset of political events.

Keywords: Applied mathematics; Computational mathematics; Computer science; Information science.


Figures
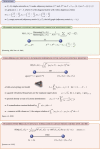
Figure 1
Figure 1
Summary of the definitions of the HIM distance and its Hamming (H) and Ipsen–Mikhailov (IM) components.
Figure 2
Figure 2
Graphical representation in circular layout (a), scatterplot (b) and tabular (c) representation of the HIM distance in the Ipsen–Mikhailov (IM axis) and Hamming (H axis) distance space between ring network (A), the star network (B), a regular network with degree three (C) and a 3 × 2 regular lattice (D).
Figure 3
Figure 3
Graphical representation of a sequence N of τ multiplex networks N(t) with λ layers.
Figure 4
Figure 4
Construction of the metric projection LN(t) at a given time point t = i for a multiplex network with λ = 5 layers; the metric projection is a new network with one node for each layer of the original net, and the edge weight is given by the complement of the HIM distance between the corresponding layers.
Figure 5
Figure 5
Construction of the collapsed projection CN(t) at a given time point t = i for a multiplex network with λ = 5 layers; the collapsed projection is a new network sharing the same nodes of the original multiplex net, where a link exists in the projection if the same link appears in at least one of the layers of the multiplex network, as if all the layers were collapsed into a single one.
Figure 6
Figure 6
Construction of the distance series D1 for the first layer of the sequence N of multiplex network in Figure 3. The value of the time series at time point t = i is the HIM distance between the layer L1 at time t = i and at time t = 1.
Figure 7
Figure 7
Construction of the distance series D2 for the sequence CN of collapsed networks in Figure 5. The value of the time series at time point t = i is the HIM distance between CN at time t = i and at time t = 1.
Figure 8
Figure 8
Construction of the distance series D3 for the sequence LN of metric projections in Figure 4. The value of the time series at time point t = i is the HIM distance between LN at time t = i and at time t = 1.
Figure 9
Figure 9
D1, D2, D3 for a synthetic example on 5 layers and 30 timepoints; in the right column, third row, we plot D1=15i=15Di(Li).
Figure 10
Figure 10
Occurrences along time of the top-8 most frequent links. The blue area marks FGW, while the red dashed line indicates IDC in February 98.
Figure 11
Figure 11
D1 time series for the layer 37, corresponding to WEIS code 102 (“Urge or suggest action or policy”). The period corresponding to FGW is marked by the blue background, while the red dashed line indicates IDC in February 1998.
Figure 12
Figure 12
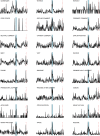
Curves of indicator D1 for the 24 layers Li(t), for i = 1,…,24: the blue area marks FGW, while the red dashed line indicates IDC in February 98. For each curve, the corresponding World Event/Interaction Survey category is indicated in the top left corner.
Figure 13
Figure 13
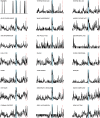
Curves of indicator D1 for the 21 layers Li(t), for i = 25,…,45: the blue area marks FGW, while the red dashed line indicates IDC in February 98. For each curve, the corresponding World Event/Interaction Survey category is indicated in the top left corner.
Figure 14
Figure 14
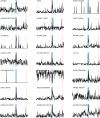
Curves of indicator D1 for the 21 layers Li(t), for i = 46,…,66: the blue area marks FGW, while the red dashed line indicates IDC in February 98. For each curve, the corresponding World Event/Interaction Survey category is indicated in the top left corner.
Figure 15
Figure 15
Time evolution of a global view of the (monthly) Gulf Dataset. (top) D2 dynamics of the collapsed projections {CN(t)}t=1240 and (bottom) D3 dynamics of the metric projections {LN(t)}t=1240. For each date, the value on y-axis is the HIM distance from the first element of the time series. Different colors mark different time periods. The black line represents the fixed-interval smoothing via a state-space model .
Figure 16
Figure 16
Planar multidimensional scaling plot with HIM distance of the collapsed (top) and metric (bottom) projection for the monthly Gulf Dataset. Colors are consistent with those in Figure 15.
Figure 17
Figure 17
Dimension of the three communities identified by the Louvain algorithm in LN along the 240 months.
Figure 18
Figure 18
Community evolution along time for each of the 66 WEIS categories, ranked by community distribution.
Figure 19
Figure 19
Triangleplot projection of the 66 WEIS categories defined by their community distribution.

Similar articles

References

    1. Boccaletti S., Bianconi G., Criado R., del Genio C.I., Gómez-Gardeñes J., Romance M., Sendiña-Nadal I., Wang Z., Zanin M. The structure and dynamics of multilayer networks. Phys. Rep. 2014;544(1):1–122. - PMC - PubMed
    1. De Domenico M., Solé-Ribalta A., Cozzo E., Kivelä M., Moreno Y., Porter M.A., Gómez S., Arenas A. Mathematical formulation of multilayer networks. Phys. Rev. X. 2013;3
    1. Kivelä M., Arenas A., Barthelemy M., Gleeson J.P., Moreno Y., Porter M.A. Multilayer networks. J. Complex Netw. 2014;2(3):203–271.
    1. Menichetti G., Remondini D., Panzarasa P., Mondragón R.J., Bianconi G. Weighted multiplex networks. PLoS ONE. 2014;9(6) - PMC - PubMed
    1. Weiyi L., Lingli C., Guangmin H. Mining essential relationships under multiplex networks. 2015. arXiv:1511.09134

LinkOut - more resources