. 2016 Oct 6;538(7623):118-122.
doi: 10.1038/nature19759. Epub 2016 Sep 14.

Acetylation-regulated interaction between p53 and SET reveals a widespread regulatory mode

Affiliations

Acetylation-regulated interaction between p53 and SET reveals a widespread regulatory mode

Donglai Wang et al. Nature. .

Abstract

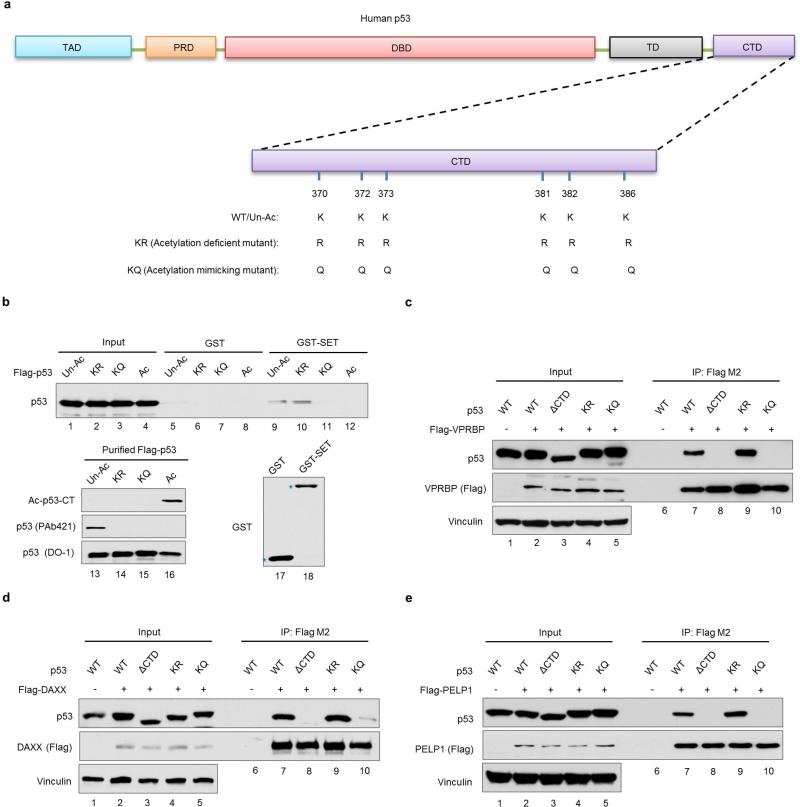
Although lysine acetylation is now recognized as a general protein modification for both histones and non-histone proteins, the mechanisms of acetylation-mediated actions are not completely understood. Acetylation of the C-terminal domain (CTD) of p53 (also known as TP53) was an early example of non-histone protein acetylation and its precise role remains unclear. Lysine acetylation often creates binding sites for bromodomain-containing 'reader' proteins. Here we use a proteomic screen to identify the oncoprotein SET as a major cellular factor whose binding with p53 is dependent on CTD acetylation status. SET profoundly inhibits p53 transcriptional activity in unstressed cells, but SET-mediated repression is abolished by stress-induced acetylation of p53 CTD. Moreover, loss of the interaction with SET activates p53, resulting in tumour regression in mouse xenograft models. Notably, the acidic domain of SET acts as a 'reader' for the unacetylated CTD of p53 and this mechanism of acetylation-dependent regulation is widespread in nature. For example, acetylation of p53 also modulates its interactions with similar acidic domains found in other p53 regulators including VPRBP (also known as DCAF1), DAXX and PELP1 (refs. 7, 8, 9), and computational analysis of the proteome has identified numerous proteins with the potential to serve as acidic domain readers and lysine-rich ligands. Unlike bromodomain readers, which preferentially bind the acetylated forms of their cognate ligands, the acidic domain readers specifically recognize the unacetylated forms of their ligands. Finally, the acetylation-dependent regulation of p53 was further validated in vivo by using a knock-in mouse model expressing an acetylation-mimicking form of p53. These results reveal that acidic-domain-containing factors act as a class of acetylation-dependent regulators by targeting p53 and, potentially, other proteins.


Figures

Extended Data Figure 1
Extended Data Figure 1. Further analysis of p53-SET interaction
a, A list of SET peptides identified by mass spectrometry. b, In vitro binding assay of methylated p53 CTD and purified SET. c, d, e, In vitro binding assay between SET and purified ubiquitinated, sumoylated or neddylated form of p53. f, g, Western blot analysis of domains of p53 and SET for their interaction. In vitro binding assay was performed by incubating immobilized GST, GST-p53 or GST-SET with each purified SET or p53, as indicated. h, Western blot analysis of the interaction between p53 and SET in cells. H1299 cells were co-transfected with indicated expressing constructs and the nuclear extract was subjected to Co-IP assay. i, j, k, ChIP analysis of p53 or SET recruitment onto PUMA (i), TIGAR (j) or GLS2 (k) promoter. HCT116 cells were treated with or without 1 μM doxorubicin for 24 hours and then the cellular extracts were subjected to ChIP assay by indicated antibodies. Asterisks indicate the specific bands of indicated proteins. Error bars indicate mean ± s.d., n=3 for technical replicates. Data were shown as representative of three experiments. Uncropped blots were shown in Supplementary Fig. 1.
Extended Data Figure 2
Extended Data Figure 2. RNA-seq analysis to identify genes regulated by p53-SET interplay
a, Western blot analysis of the expression of p53 in U2OS-derived CRISPR control cells or CRISPR p53-KO cells. b, Heatmap of genes regulated by p53-SET interplay. U2OS (CRISPR Ctr or CRISPR p53-KO) cells were transfected with control siRNA or SET-specific siRNA for 4 days and the total RNA were prepared for RNA-seq analysis with two or three biological replicates, as indicated. Known p53 target genes which were also repressed by SET in a p53-dependent manner were selected and presented as a Heatmap. The relative SET expression was shown in the last row of the Heatmap. c, qPCR validation of the genes regulated by p53-SET interplay. Error bars indicate mean ± s.d., n=3 for technical replicates. Data were shown as representative of three experiments. Uncropped blots were shown in Supplementary Fig. 1.
Extended Data Figure 3
Extended Data Figure 3. SET-mediated effects on cell proliferation and tumor growth
a, b, Representative image (a) or quantitative analysis (b) of SET knockdown-mediated effect on cell growth of U2OS-derived CRISPR control cells or CRISPR p53-KO cells. c, Western blot analysis of the expression of p53 in HCT116-derived CRISPR control cells or CRISPR p53-KO cells. d, Xenograft analysis of SET-mediated effect on tumor growth by HCT116-derived CRISPR control cells or CRISPR p53-KO cells. e, Western blot analysis of p53 expression in control or derived HCT116 cell lines, as indicated. Error bars indicate mean ± s.d., n=3 in (b) or n=5 in (d) for biological replicates. Uncropped blots were shown in Supplementary Fig. 1.
Extended Data Figure 4
Extended Data Figure 4. SET regulates histone modifications on p53 target promoter
a, Western blot analysis of SET knockdown-mediated effect on p53 C-terminal acetylation in HCT116 cells. Doxorubicin (Dox)-treated cells were also analyzed in parallel as a positive control. b, Western blot analysis of SET-mediated effect on CBP-induced p53 C-terminal acetylation in H1299 cells. c, e, ChIP analysis of promoter-recruitment of p53 (c) or p300/CBP (e) upon SET depletion in HCT116 cells. d, ChIP analysis of SET knockdown-mediated effect on histone modifications on PUMA promoter in HCT116 cells. f, ChIP analysis of SET-mediated effect on p53-dependent H3K18 and H3K27 acetylation on PUMA promoter. Error bars indicate mean ± s.d., n=3 for technical replicates. Data were shown as representative of three experiments. Uncropped blots were shown in Supplementary Fig. 1.
Extended Data Figure 5
Extended Data Figure 5. Acetylation regulates the interaction between acidic-domain-containing proteins and their acetylatable ligands
a, A summary table of characteristic features of acidic domain-containing protein SET, VPRBP, DAXX and PELP1. The acidic amino acids were underlined. b, In vitro binding assay of p53 CTD and purified full-length of VPRBP, DAXX or PELP1. c, d, e, Western blot analysis of the interaction between p53 and VPRBP (c), DAXX (d) or PELP1 (e) in nuclear fraction of H1299 cells. f, g, h, In vitro binding assay between purified SET and lysine-rich domain of H3 (f), KU70 (g) or FOXO1 (h). i, In vitro binding assay of H3 lysine-rich domain and purified VPRBP, DAXX or PELP1. j, In vitro binding assay of H3 lysine-rich domain and BRD4 or BRD7 (nuclear extract). Uncropped blots were shown in Supplementary Fig. 1.
Extended Data Figure 6
Extended Data Figure 6. p53KQ mutant mimics acetylated p53
a, Schematic diagraph of human unacetylated p53, acetylation-deficient or acetylation-mimicking mutant of p53. b, In vitro binding assay of SET and different types of p53, as indicated. c, d, e, Western blot analysis of the interaction between acidic domain-containing proteins (c, VPRBP; d, DAXX; e, PELP1) and different types of p53 in cells. H1299 cells were co-transfected with indicated expressing constructs, and the nuclear extract was subjected to Co-IP assay. Asterisks indicate the purified proteins. Uncropped blots were shown in Supplementary Fig. 1.
Extended Data Figure 7
Extended Data Figure 7. Generation of the p53KQ/KQ mice
a, Schematic diagram of gene targeting strategy to replace p53 C-terminal 7 lysines with 7 glutamine in mouse p53. b, Southern blot screening of ES cells to identify p53+/KQ clones. c, PCR genotyping analysis of wildtype mouse (110 bps), p53+/KQ heterozygous mouse (110 bps and 150 bps), and p53KQ/KQ homozygous mouse (150 bps only). d, Sequencing analysis of the transcripts prepared from p53+/KQ heterozygous mouse spleen. e, A summary table of observed numbers from p53+/KQ heterozygous intercrosses. f, Positive control of p53 staining in IHC assay. The spleen tissue sections of p53+/+ mice treated with or without 6 Gy γ-radiation was stained with p53 (CM-5) antibody. g, h, Representative image (g) or quantitative analysis (h) of SET knockdown-mediated cell growth of p53+/+ or p53KQ/KQ MEFs (P2). Error bars indicate mean ± s.d., n=3 for biological replicates. Uncropped blots were shown in Supplementary Fig. 1.
Extended Data Figure 8
Extended Data Figure 8. Characterization of Set conditional knockout mice
a, Schematic diagraph of strategy to generate Set conditional knockout mice. b, Validation of Set knockout in embryos (E8.5) by genotyping and western blot analysis. c, A summary table of observed numbers from Set+/− intercrosses. d, Representative picture of Set+/+ and Set−/− embryos (E10.5). e, qPCR analysis of the expression of p53 target genes in Set+/+ and Set−/− embryos (E10.5). Error bars indicate mean ± s.d., n=3 for technical replicates. Data were shown as representative of three experiments. Uncropped blots were shown in Supplementary Fig. 1.
Figure 1
Figure 1. Identification of SET as a specific co-repressor of C-terminal unacetylated p53
a, Schematic diagraph of synthesized biotin-conjugated p53 CTD. b, Coomassie Blue staining of the protein complex bound with p53 CTD. c, Schematic diagraph of SET. DD: dimerization domain; ED: earmuff domain; AD: acidic domain. d, In vitro binding assay of p53 CTD and purified SET. e, Western blot analysis of the interaction between p53 and SET in nuclear fraction of H1299 cells. f, EMSA showing SET/p53-DNA complex formation in vitro. g, Luciferase assays of SET-mediated regulation on p53 transactivity in H1299 cells. h, Western blot analysis of the endogenous interaction between p53 and SET upon doxorubicin (Dox) treatment in HCT116 cells. i, ChIP analysis of p53 or SET recruitment on p21 promoter upon Dox treatment in HCT116 cells. j, A model of dynamic promoter-recruitment of SET regulated by p53 CTD acetylation status. Error bars indicate mean ± s.d., n=3 for technical replicates. Data were shown as representative of three experiments. Uncropped blots were shown in Supplementary Fig. 1.
Figure 2
Figure 2. SET negatively regulates p53 transactivity by inhibiting p300/CBP-mediated H3K18 and H3K27 acetylation on p53 target promoter
a, b, c Western blot analysis of SET knockdown-mediated effect on p53 activity in cells. d, Xenograft analysis of SET-mediated effect on tumor growth. e, ChIP analysis of SET knockdown-mediated effect on histone modifications at p21 promoter in HCT116 cells. f, In vitro acetylation assay of SET effect on p300-mediated H3K18 and H3K27 acetylation. g, ChIP analysis of SET-mediated effect on p53-dependent H3K18 and H3K27 acetylation on p21 promoter in H1299 cells. h, A model of SET-mediated regulation on p53 transactivity. Error bars indicate mean ± s.d., n=3 for technical replicates in (e) and (g); n=5 (p53+/+ group) or n=3 (p53−/− group) for biological replicates in (d). Data were shown as representative of three experiments. Uncropped blots were shown in Supplementary Fig. 1.
Figure 3
Figure 3. Acidic domain-containing proteins represent a new class of “reader” for their unacetylated ligands
a, Schematic diagraph of acidic domain (AD)-containing protein SET, VPRBP, DAXX and PELP1. b, c, d, In vitro binding assay of p53 CTD and acidic domain of VPRBP (b), DAXX (c) or PELP1 (d). e, Schematic diagraph of lysine-rich domain (KRD)-containing protein histone H3, KU70 and FOXO1. f, g, h, In vitro binding assay between purified SET acidic domain and lysine-rich domain of H3 (f), KU70 (g) or FOXO1 (h). i, A model of acetylation-dependent regulation of the interactions between lysine-rich domain (KRD)-containing proteins and their acidic domain (AD)-containing “readers”. Uncropped blots were shown in Supplementary Fig. 1.
Figure 4
Figure 4. The physiological significance of acetylation-dependent dissociation of p53 from its acidic domain-containing “readers”
a, The new born of p53+/+ and p53KQ/KQ mice. b, The brains from p53+/+ and p53KQ/KQ mice. c, Immunohistochemistry analysis of brain sections from p53+/+ and p53KQ/KQ mice. d, RT-qPCR analysis of p53 target gene expression in p53+/+ and p53KQ/KQ tissues. e, Western blot analysis of the interaction between p53 and acidic domain-containing proteins in p53+/+ or p53KQ/KQ MEFs treated with proteasome inhibitor Epoxomicin. f, Cell growth analysis of p53+/+ or p53KQ/KQ MEFs (P3). g, Morphological representative of p53+/+ and p53KQ/KQ MEFs from P0 to P4. h, SA-β-gal staining of p53+/+ and p53KQ/KQ MEFs (P3). i, Western blot analysis of p21 and p53 expression in p53+/+ and p53KQ/KQ MEFs. j, Western blot analysis of p53 targets in Set conditional knockout MEFs. Error bars indicate mean ± s.d., n=3 for technical replicates in (d); n=3 for biological replicates in (f). Data were shown as representative of three experiments. Uncropped blots were shown in Supplementary Fig. 1.

Comment in

References

    1. Zhao S, et al. Regulation of cellular metabolism by protein lysine acetylation. Science. 2010;327:1000–1004. doi:10.1126/science.1179689. - PMC - PubMed
    1. Choudhary C, et al. Lysine acetylation targets protein complexes and co-regulates major cellular functions. Science. 2009;325:834–840. doi:10.1126/science.1175371. - PubMed
    1. Kim SC, et al. Substrate and functional diversity of lysine acetylation revealed by a proteomics survey. Molecular cell. 2006;23:607–618. doi:10.1016/j.molcel.2006.06.026. - PubMed
    1. Gu W, Roeder RG. Activation of p53 sequence-specific DNA binding by acetylation of the p53 C-terminal domain. Cell. 1997;90:595–606. - PubMed
    1. Dhalluin C, et al. Structure and ligand of a histone acetyltransferase bromodomain. Nature. 1999;399:491–496. doi:10.1038/20974. - PubMed

MeSH terms